Probability Questions and Answers

Statistics
ProbabilityHomework 4 4 Score 0 8 0 8 answered Question 6 At a university 18 of students smoke a Calculate the expected number of smokers in a random sample of 130 students from this university please do not round your answer b The university gym opens at 9 am on Saturday mornings One Saturday morning at 8 55 am there are 30 students outside the gym waiting for it to open Should you use the same approach from part a to calculate the expected number of smokers among these 30 students No it is unlikely that smoking habits and waking up early to go to the gym on Saturday are independent Yes it is reasonable to believe that people who go to the gym when it first opens on Saturday mornings is a representative sample Question Help Post to forum Submit All Parts

Statistics
Probability15 Which of the following is a true statement about experimental design A Replication is a key component in experimental design Thus an experiment needs to be conducted on repeated samples before generalizing results B Control is a key component of experimental design Thus a control group that receives a placebo is a requirement for experimentation C Randomization is a key component in experimental design Randomization is used to reduce bias D Blocking eliminates the effects of all lurking variables E The placebo effect is a concern for all experiments

Statistics
Probability14 In a game of chance three fair coins are tossed simultaneously If all three coins show heads then the player wins 15 If all three coins show tails then the player wins 10 If it costs 5 to play the game what is the player s expected net gain or loss at the end of two games C gain 3 75 D lose 1 88 A gain 15 B gain 1 88 E lose 3 75

Statistics
Probability2 Ann Landers who wrote a daily advice column appearing in newspapers across the country once asked her readers If you had it to do over again would you have children Of the more than 10 000 readers who responded 70 said no I m certain your parents would say yes What does this show A The survey is meaningless because of voluntary response bias B No meaningful conclusion is possible without knowing something more about the characteristics of her readers C The survey would have been more meaningful if she had picked a random sample of the 10 000 readers who responded D The survey would have been meaningful if she had used a control group E This was a legitimate sample drawn from her readers and of sufficient size to allow the conclusion that most of her readers who are parents would have second thoughts about having children

Statistics
ProbabilityDetermine whether the following statement is true or false A score in the 50th percentile on a standardized test is the median Choose the correct answer below A The statement is false because a score in the 50th percentile is the standard deviation B The statement is false because the median or first quartile is the 25th percentile Oc The statement is true because the median or second quartile is the 50th percentile D The statement is false because the median or third quartile is the 75th percentile

Statistics
ProbabilityIn a random sample of 60 computers the mean repair cost was 150 and assume that the population standard deviation is 36 Construct a 90 confidence interval for the population mean OA 537 654 OB 141 159 OC 138 162 O D 142 158

Statistics
ProbabilityPractice 1 You roll a six sided die What is the probability of rolling a 1 or an 2 You roll a six sided die What is the probability of rolling a number less than 4 or an even number 3 In a survey of 300 students 150 like pop music or country music There are 97 students who like pop music and there are 83 students who like country music What is the probability that a randomly selected student likes both pop music and country music

Statistics
Probabilityabout a mean using the critical value method 4 7 points Example Hypothesis Test Critical Value A computer software vendor claims that a new version of their operating system will crash less than seven times per year on average A system administrator installs the operating system on a random sample of 41 computers At the end of a year the sample mean number of crashes is 8 1 with a standard deviation of 3 9 Can you conclude that the vendor s claim is false Use the a 0 05 significance level Degrees of Freedom Hints Area in the Right Tail 0 10 0 05 0 025 39 1 304 40 1 303 50 1 299 1 685 1 684 1 676 2 023 2 021 2 009 In Calculator to find t Use STAT Tests Ttest Stats HO X S X n o o o Calculate If t ta we reject Ho If t ta we don t reject Ho 4 points Describe the relationship between hypothesis tests and confidence intervals through an example

Statistics
Probability9 4 1 Test a hypothesis about a proportion using the P value me 27 7 points Example Hypothesis Test P value An educational specialist is studying attitudes of teachers about the use of virtual reality in the classroom She samples 555 teachers and finds that 417 of them believe that virtual reality would have a positive effect Can she conclude that the proportion of teachers who believe it will have a positive effect is greater than 90 Use the a 0 05 level of significance Hints Z p Po Po 1 P n Z Statistic To get Z value in calculator STAT Tests 1 PropZtest Stats pc n prop Po Po po Calculate Output will be z po p n To find p from z use this function normalcdf 3 13 199 0 1 8 7499861955 4

Statistics
Probabilityson grac 3 What is the probability that a tool selected at random is defective given that the tool was produced by the new method

Statistics
ProbabilityConsidering the selling price of items from a large estate sale of a wealthy individual a Is the median item value more or less than the mean value Why Typed document only except for hand drawn graph
Statistics
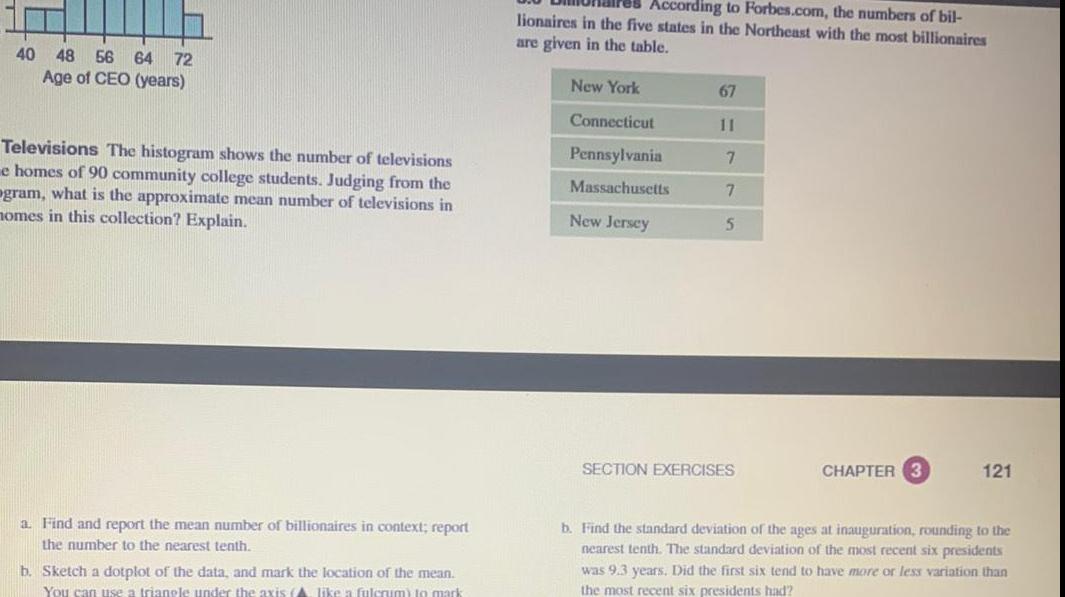
Probability40 48 56 64 72 Age of CEO years Televisions The histogram shows the number of televisions e homes of 90 community college students Judging from the ogram what is the approximate mean number of televisions in homes in this collection Explain a Find and report the mean number of billionaires in context report the number to the nearest tenth b Sketch a dotplot of the data and mark the location of the mean You can use a triangle under the axis A like a fulcrum to mark According to Forbes com the numbers of bil lionaires in the five states in the Northeast with the most billionaires are given in the table New York Connecticut Pennsylvania Massachusetts New Jersey 67 11 7 7 5 SECTION EXERCISES CHAPTER 3 121 b Find the standard deviation of the ages at inauguration rounding to the nearest tenth The standard deviation of the most recent six presidents was 9 3 years Did the first six tend to have more or less variation than the most recent six presidents had
Statistics
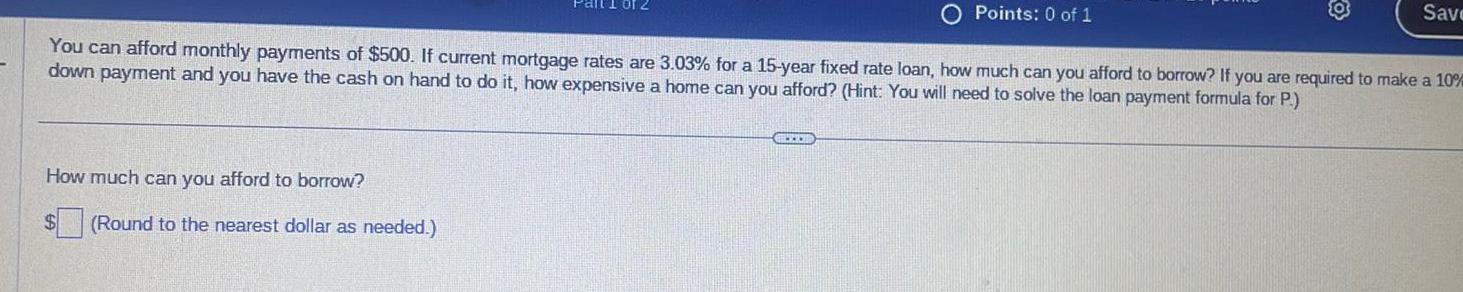
ProbabilityHow much can you afford to borrow You can afford monthly payments of 500 If current mortgage rates are 3 03 for a 15 year fixed rate loan how much can you afford to borrow If you are required to make a 10 DU down payment and you have the cash on hand to do it how expensive a home can you afford Hint You will need to solve the loan payment formula for P Round to the nearest dollar as needed Points 0 of 1 BEUR Save
Statistics
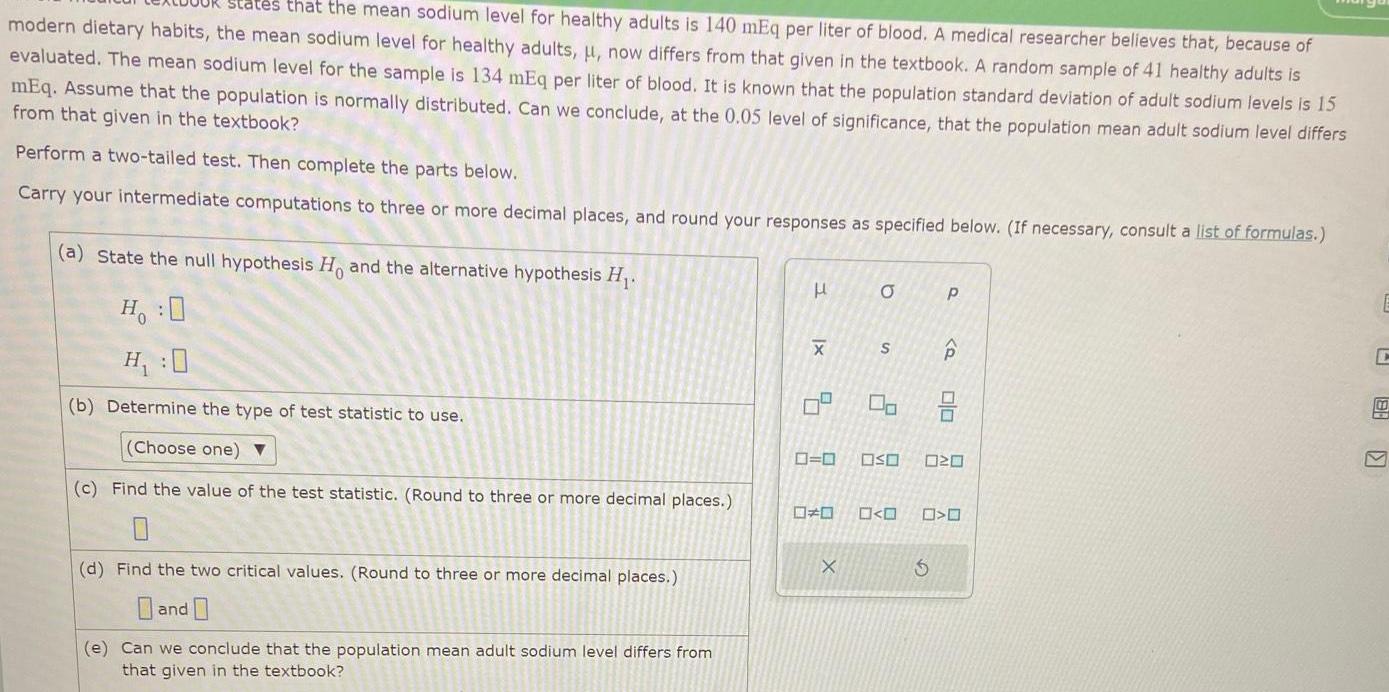
Probabilitystates that the mean sodium level for healthy adults is 140 mEq per liter of blood A medical researcher believes that because of modern dietary habits the mean sodium level for healthy adults now differs from that given in the textbook A random sample of 41 healthy adults is evaluated The mean sodium level for the sample is 134 mEq per liter of blood It is known that the population standard deviation of adult sodium levels is 15 mEq Assume that the population is normally distributed Can we conclude at the 0 05 level of significance that the population mean adult sodium level differs from that given in the textbook Perform a two tailed test Then complete the parts below Carry your intermediate computations to three or more decimal places and round your responses as specified below If necessary consult a list of formulas a State the null hypothesis H and the alternative hypothesis H H O H 0 b Determine the type of test statistic to use Choose one c Find the value of the test statistic Round to three or more decimal places 0 d Find the two critical values Round to three or more decimal places and e Can we conclude that the population mean adult sodium level differs from that given in the textbook H x X 5 1 a X S 0 0 OSO 00 P Q Olo 20 O C 88 V
Statistics
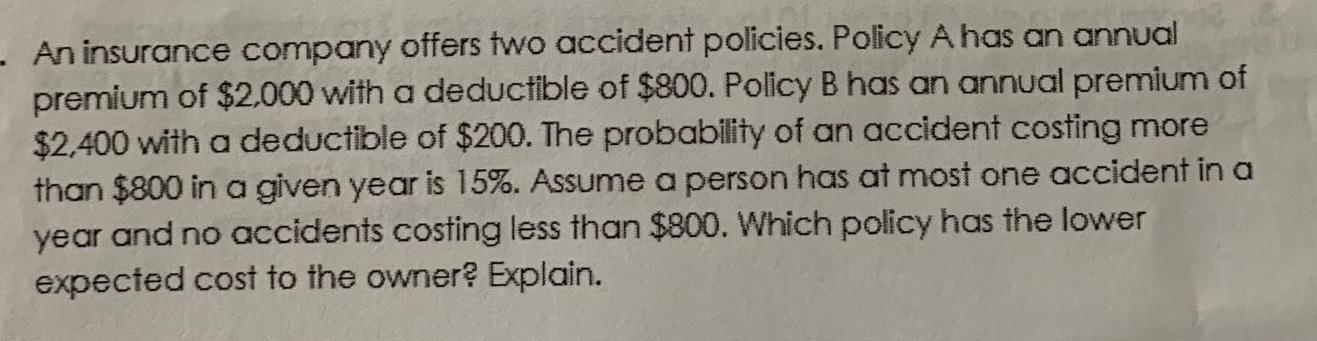
ProbabilityAn insurance company offers two accident policies Policy A has an annual premium of 2 000 with a deductible of 800 Policy B has an annual premium of 2 400 with a deductible of 200 The probability of an accident costing more than 800 in a given year is 15 Assume a person has at most one accident in a year and no accidents costing less than 800 Which policy has the lower expected cost to the owner Explain

Statistics
ProbabilityAssuming there is a 0 5 probability that a coin will land on heads what is the probability that flipping coin will land on heads then heads then tails and then heads again

Statistics
ProbabilityWhen rolling a die what is the probability of rolling a I or a 4 Write your answer as a fraction
Statistics
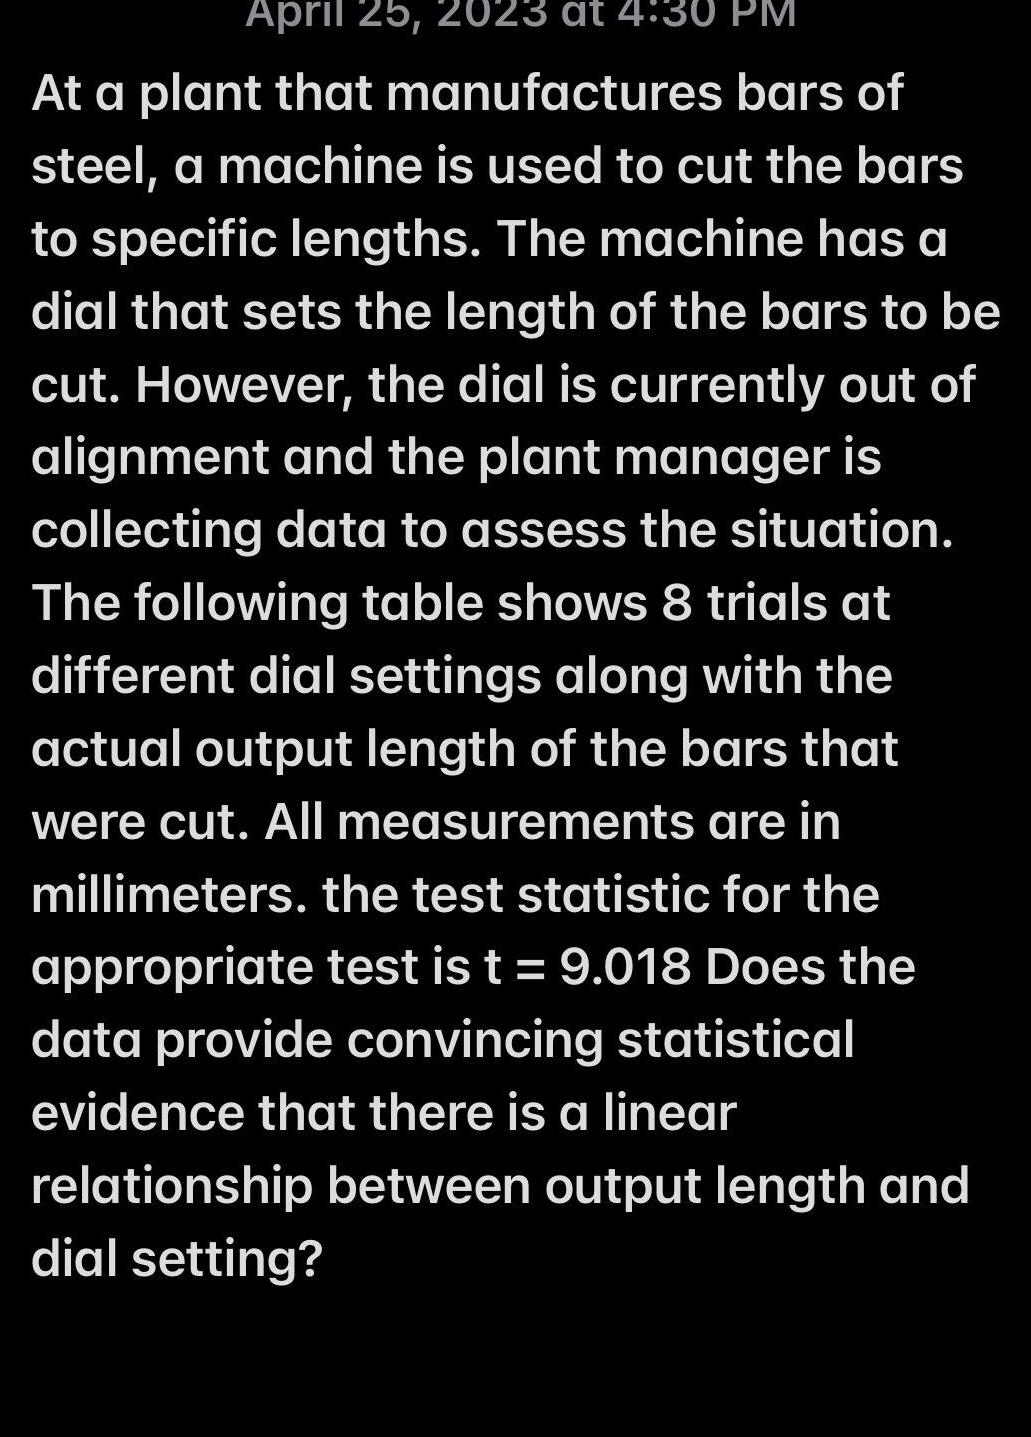
ProbabilityApril 25 2023 at 4 30 PM At a plant that manufactures bars of steel a machine is used to cut the bars to specific lengths The machine has a dial that sets the length of the bars to be cut However the dial is currently out of alignment and the plant manager is collecting data to assess the situation The following table shows 8 trials at different dial settings along with the actual output length of the bars that were cut All measurements are in millimeters the test statistic for the appropriate test is t 9 018 Does the data provide convincing statistical evidence that there is a linear relationship between output length and dial setting
Statistics
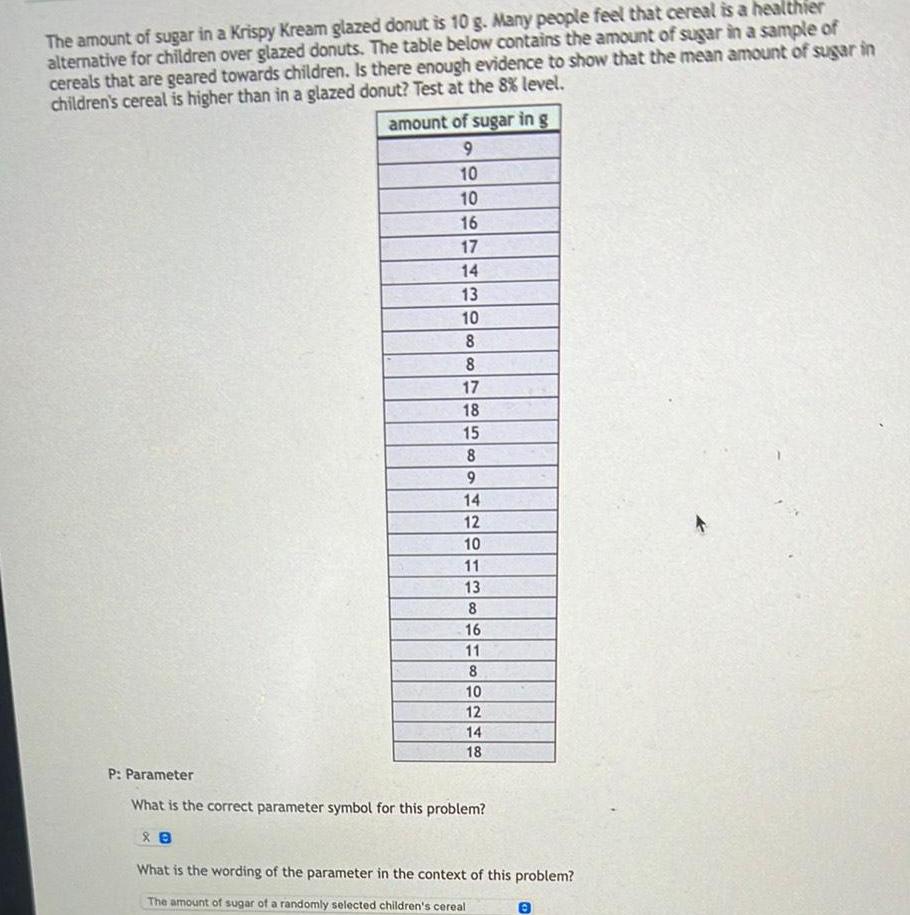
ProbabilityThe amount of sugar in a Krispy Kream glazed donut is 10 g Many people feel that cereal is a healthier alternative for children over glazed donuts The table below contains the amount of sugar in a sample of cereals that are geared towards children Is there enough evidence to show that the mean amount of sugar in children s cereal is higher than in a glazed donut Test at the 8 level amount of sugar in g 9 10 10 16 17 14 13 10 8 8 17 18 15 8 9 14 12 88 10 11 13 8 16 11 8 10 12 14 18 P Parameter What is the correct parameter symbol for this problem What is the wording of the parameter in the context of this problem The amount of sugar of a randomly selected children s cereal
Statistics
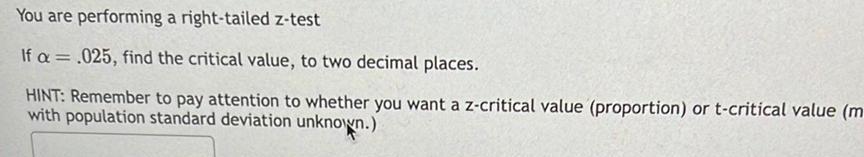
ProbabilityYou are performing a right tailed z test If a 025 find the critical value to two decimal places HINT Remember to pay attention to whether you want a z critical value proportion or t critical value m with population standard deviation unknown
Statistics
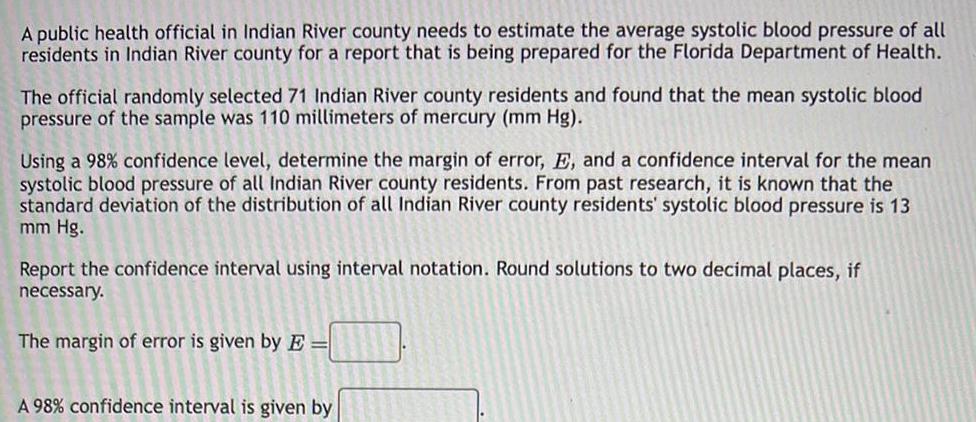
ProbabilityA public health official in Indian River county needs to estimate the average systolic blood pressure of all residents in Indian River county for a report that is being prepared for the Florida Department of Health The official randomly selected 71 Indian River county residents and found that the mean systolic blood pressure of the sample was 110 millimeters of mercury mm Hg Using a 98 confidence level determine the margin of error E and a confidence interval for the mean systolic blood pressure of all Indian River county residents From past research it is known that the standard deviation of the distribution of all Indian River county residents systolic blood pressure is 13 mm Hg Report the confidence interval using interval notation Round solutions to two decimal places if necessary The margin of error is given by E A 98 confidence interval is given by
Statistics
ProbabilityAn epidemiologist with the Florida Department of Health needs to estimate the proportion of Floridians who are infected with the corona virus but are asymptomatic show no signs of the virus The epidemiologist compiled a preliminary random sample of infected patients and found that 47 of the sample were also asymptomatic How large a sample should be selected such that the margin of error of the estimate for a 96 confidence interval is at most 4 43 Round the solution up to the nearest whole number n
Statistics
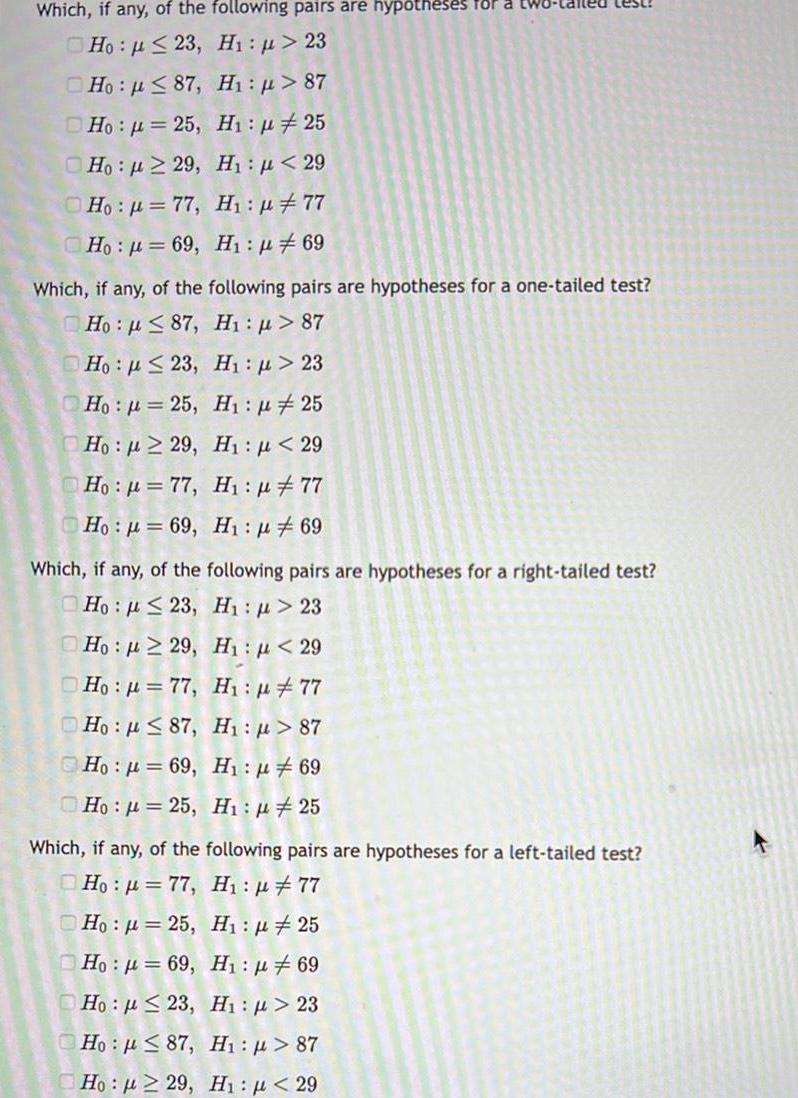
ProbabilityWhich if any of the following pairs are hypotheses for Ho p 23 Hi p 23 Ho 87 H p 87 Ho 25 H 25 Ho 229 H 29 H p 77 Ho p 77 Ho 69 H 69 Which if any of the following pairs are hypotheses for a one tailed test Ho 87 H 87 Ho 23 H 23 Ho 25 Ho 29 00 H 25 H 29 Hop 77 H 77 Ho 69 H 69 Which if any of the following pairs are hypotheses for a right tailed test Ho 23 H 23 Ho 29 H 29 Ho 77 H 77 Ho 87 H 87 Ho 69 H 69 Ho 25 Hi 25 Which if any of the following pairs are hypotheses for a left tailed test Ho 77 H 77 Ho 25 H1 25 Ho 69 H 69 Ho 23 Hi p 23 H p 87 Hn p 87 H p 29 H1 29
Statistics
ProbabilityYou measure 38 dogs weights and find they have a mean weight of 30 ounces Assume the population standard deviation is 6 7 ounces Based on this construct a 95 confidence interval for the true population mean dog weight Give your answers as decimals to two places

Statistics
ProbabilityComplete the problems to find the profit or loss 1 You paid 1 829 for 40 shares of JTT stock You sold the stock for 61 50 per share The commission you paid was 35 50 2 You paid 24 000 for 1 000 shares of EXO stock You sold the stock for 22 50 per share The commission you paid was 49 95

Statistics
ProbabilityThe National Academy of Science reported that 33 of research in mathematics is published by US authors The mathematics chairperson of a prestigious university wishes to test the claim that this percentage is no longer 33 He has no indication of whether the percentage has increased or decreased since that time He surveys a simple random sample of 234 recent articles published by reputable mathematics research journals and finds that 62 of these articles have US authors Does this evidence support the mathematics chairperson s claim that the percentage is no longer 33 Use a 0 05 level of significance Step 1 of 3 State the null and alternative hypotheses for the test Fill in the blank below Answer 05 Points Ho p 0 33 Ha P 0 33 Keypad

Statistics
ProbabilitySuppose the following estimated regression equation was determined to predict salary based on years of experien Estimated Salary What is the estimated salary for an employee with 3 years of experience 23 932 92 2352 69 Years of Experience

Statistics
ProbabilityScore on last try 0 of 1 pts See Details for more You can retry this question below Suppose a jar contains 19 red marbles and 26 blue marbles If you reach in the jar and pull out 2 marbles at random at the same time find the probability that both are red Question Help Video Post to forum Submit Question

Statistics
ProbabilityAfter studying all night for a final exam a bleary eyed student randomly grabs 2 socks from a drawer containing 13 black socks 8 brown socks and 2 blue socks all mixed toget probability that the student grabs a matched pair The probability of a matched pair is Type an integer or a simplified fraction GELCH

Statistics
ProbabilityA reader wrote the following passage to a column in a magazine You have 6 envelopes to pick from Two thirds that is 4 are empty One third that is 2 contain a 100 bill You re told to choose 2 envelopes at random Which least one 100 bill or 2 that you ll get no 100 bill at all Find the two probabilities The probability that you will get at least one 100 bill is Type an integer or a simplified fraction and the probability that you ll get no 100 bill at all is

Statistics
ProbabilityFor the experiment described below let x determine a random variable and use your knowledge of probability to prepare a probability distribution The sums that appear when two fair four sided dice tetrahedrons with sides 3 6 9 and 12 are tossed Complete the probability distribution below Sum Probability Sum Probability 6 18 9 21 12 24 15 Type simplified fractions

Statistics
Probabilitywo cards are drawn at random from an ordinary deck of 52 cards What is the probability that all 2 are the same ne probability is P E ype an integer or a simplified fraction

Statistics
ProbabilityK Twenty five slips of paper are each marked with a different letter of the alphabet and placed in a basket A slip is pulled out its letter recorded in the order in which the slip was drawn a replaced This is done 3 times Find the probability that a word with no repetition of letters is formed Which of the following can be used to find the probability Choose the correct answer below OA 25 24 231 325 O C OE 31 31 25 3 1 31 25 3 O G 3 31 The probability is Type an integer or decimal rounded to four decimal places as needed OB 253 25 24 23 OD P 25 3 OF 25 24 23 253 OH C 25 3

Statistics
ProbabilityFind the expected payback for a game in which you bet 8 on any number from 0 to 999 If your number comes up you get 500 The expected payback is Round to the nearest cent as needed

Statistics
ProbabilityA survey found that customers are overcharged by price scanning systems on average on 1 65 of items Suppose a customer purchases 14 items Find the following pr A customer is overcharged on 1 item The probability is Round to six decimal places as needed

Statistics
ProbabilityA die is rolled 10 times Find the probability of rolling no more than 4 sixes The probability of rolling no more than 4 sixes is Type an integer or decimal rounded to four decimal places as needed Round all intermediate values to four decimal places as nee

Statistics
ProbabilityA die is rolled 4 times Find the probability of rolling exactly 1 five Use the formula for binomial probability to calculate the probability of rolling exactly 1 five Assume success in this case is rolling a 1 P x successes in n trials C n x p 1 p C 4 1 Type integers or fractions CCX The probability is Round to four decimal places as needed

Statistics
ProbabilityA survey finds that customers are overcharged by price scanning systems on average on 1 70 of items Suppose a customer purchases 10 items Find the following proba A customer is not overcharged for any itern The probability is Round to four decimal places as needed www

Statistics
ProbabilityA raffle offers a first prize of 1000 2 second prizes of 300 and 20 third prizes of 10 each If 10000 tickets are sold at 25 cents each find the expected winnings for a person buying What are the expected winnings cents Round your answer to the nearest whole cent XX

Statistics
Probability1 Suppose that a family has 7 children Also suppose that the probability of having a boy based on the gender assigned at birth is Find the probability that the family has no more than 5 2 The probability that the family has no more than 5 boys is Type an integer or a simplified fraction

Statistics
ProbabilityA die is rolled 9 times Find the probability of rolling exactly 1 The probability is Round to four decimal places as needed

Statistics
ProbabilityOne option in a roulette game is to bet 8 on red There are 18 red compartments 18 black compartments and two compartments that are neither red nor black If the ball lands on red you ge keep the 8 you paid to play the game and you are awarded 8 If the ball lands elsewhere you are awarded nothing and the 8 that you bet is collected Find the expected payback for this roul game if you bet 8 on red The expected payback is Round to the nearest cent as needed

Statistics
Probability1 Suppose that a family has 4 children Also suppose that the probability of having a girl based on the gender assigned at birth is Find the probability that the family has the follo 2 Exactly 2 girls and 2 boys The probability is Type an integer or a simplified fraction GCEER

Statistics
Probabilityhipment of 9 printers contains 3 that are defective Find the probability that a sample of size 3 drawn from the 9 will not contain a defective probability is pe an integer or a simplified fraction COLLE

Statistics
ProbabilityHere is a bivariate data set x 1 7 67 5 46 5 12 6 23 9 r y 65 4 173 8 107 4 88 4 80 1 4 7 87 9 4 35 2 4 7 8 9 37 1 42 3 47 3 105 9 35 4 133 6 16 9 9 8 122 8 83 7 7 3 39 2 73 1 56 2 9 2 25 3 15 4 29 4 26 3 8 6 18 3 This data can be downloaded as a csv file with this link Download CSV 64 1 40 8 Find the correlation coefficient and report it accurate to three decimal places What proportion of the variation in y can be explained by the variation in the values of x Report answer as a percentage accurate to one decimal place m

Statistics
ProbabilityHere is a bivariate data set X 51 70 8 57 6 19 2 y 21 25 3 155 8 139 6 62 4 64 3 67 2 114 4 58 2 64 8 This data can be downloaded as a csv file with this link Download CSV Find the correlation coefficient and report it accurate to three decimal places r What proportion of the variation in y can be explained by the variation in the values of x Report answer as a percentage accurate to one decimal place R

Statistics
ProbabilityWhich notation represents the conditional probability of the event A given event B O P A or B O P BIA O P AB O P A and B

Statistics
ProbabilityIn probability which of the following visual displays shows conditional probability values None of these displays do Venn diagram two way table O probability tree

Statistics
ProbabilityThe notation for conditional probabilities always follows which general format O Pla specific outcome and some relevant information O Pla specific outcome some relevant information O P some relevant information a specific outcome O either P a specific outcome some relevant information or P some relevant information a specific outcome whichever format you like best

Statistics
ProbabilityIf 6ft stands for a human height of at least 6 feet then P 6ft man is the probability O of being a man but not one who is 6ft tall O of being 6ft tall if the person is a man O of being a man and being 6ft tall O of being 6ft tall but not a man of being a man if the person is 6ft tall O of being neither a man nor 6ft tall