Probability Questions and Answers


Statistics
ProbabilityC www awu aleks com alekscgi x 1st exe II O PROBABILITY Probabilities involving two re An ordinary fair die is a cube with

Statistics
ProbabilityUse a table of cumulative areas under the normal curve to find the z score that corresponds to the given cumulative area If the area is not in the table use the entry closest to the area If the area is hallway between two entries use the 2 score halfway between the corresponding z scores If convenient use technology to find the z score 0049 Click to view page 1 of the table Click to view page 2 of the table The cumulative area corresponds to the z score of Round to three decimal places as needed

Statistics
ProbabilityAssume a member is selected at random from the population represented by the graph Find the probability that the member selected at random is from the shaded region of the graph Assume the variable x is normally distributed RECE The probability that the member selected at random is from the shaded area of the graph is Round to four decimal places as needed Standardized Test Composite Scores 28 x 33 J Soone P 207 G 54 28 33 Q Q

Statistics
Probability1 28 Births and Deaths The following information about the number of births and the number of deaths in thousands for cer tain years is taken from the 2012 World Almanac and Book of Facts Report the death rate as a percentage of the birth rate and comment on its trend over time What is causing the trend Year 2006 2007 2008 2009 2010 Births 4266 4316 4248 4131 4007 Deaths 2426 2424 2473 2437 2452

Statistics
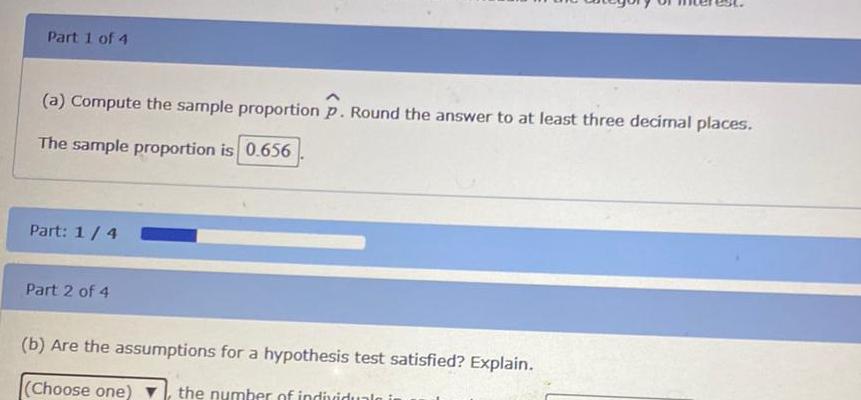
Probabilitya Compute the sample proportion p Round the answer to at least three decimal places The sample proportion is 0 656 Part 2 of 4 b Are the assumptions for a hypothesis test satisfied Explain Yes Part 3 of 4 Part 3 4 c It is desired to test H p 0 8 versus H p 0 8 Compute the test statistic Round the answer to at least two decimal places The test statistic is 2 82 Part 4 of 4 the number of individuals in each category is greater than d Compute the P value Round the answer to at least four decimal places P value 10 Do you reject Ho at the 0 05 level
Statistics
ProbabilityPart 1 of 4 a Compute the sample proportion P Round the answer to at least three decimal places The sample proportion is 0 656 Part 1 4 Part 2 of 4 b Are the assumptions for a hypothesis test satisfied Explain Choose one the number of individuals in

Statistics
ProbabilityA direct mail appeal for contribu alumni and supporters provide the direct mail brochures to a si contributions from 71 people D significance Step 1 of 3 State the null and a

Statistics
ProbabilityII The following two way table shows students who went on a school trip to either York or London Boys Girls Total London 35 67 York 40 Total 54 1 Fill in the two way table 2 Calculate the probability that a student chosen at random went to London 3 Calculate the probability that a girl chosen at random went to York 4 Calculate the probability that a student who went to York was a boy 5 Calculate the probability that a student chosen at random was a boy who went to London solad 6 Calculate the probability that a student chosen at random was a girl who went to London

Statistics
Probability31 Finding Odds in Roulette A roulett and the others are numbered 1 throu outcome is an odd number a What is your probability of winn

Statistics
ProbabilityThe National Academy of Science chairperson of a prestigious unive percentage has increased or decr mathematics research journals a perc chairperson s claim that the Step 1 of 3 State the null and a

Statistics
ProbabilityFind the equation of the line with Slope 6 and passing through 8 56 Write your equation in the form y mx b 11

Statistics
ProbabilityBefore every flight the pilot must verify that the total weight of the load is less than the maximum allowable load for the aircraft The aircraft can carry 37 passengers and a flight has fuel and baggage that allows for a total passenger load of 6 253 lb The pilot sees that the plane is full and all passengers are men The aircraft will be overloaded if the 6 253 lb 37 mean weight of the passengers is greater than 169 lb What is the probability that the aircraft is overloaded Should the pilot take any action to correct for an overloaded aircraft Assume that weights of men are normally distributed with a mean of 179 7 lb and a standard deviation of 36 1 The probability is approximately Round to four decimal places as needed

Statistics
ProbabilityIn a study the sample is chosen by separating all cars by size and selecting 10 of each size grouping What is the sampling method Systematic Convenience Simple random Stratified Cluster

Statistics
ProbabilityThere s a roughly linear relationship between the length of someone s femur the long leg bone in your thigh and their expected height Within a certain population this relationship can be expressed using the formula h 2 41f 54 8 where h represents the expected height in centimeters and f represents the length of the femur in centimeters What could the number 2 41 represent in the equation The change in expected height for every one additional centimeter of femur length The change in expected femur length for every one additional centimeter of height The expected height for someone with a femur length of 2 41 centimeters The expected height for someone with a femur length of 54 8 centimeters

Statistics
Probabilitynducted a survey on school start times with two samples of 40 randomly selected students to represent the entire 600 member student population The results are shown below SAMPLE 1 SAMPLE 2 7 45 AM START TIME OVER 300 STUDENTS WANT TO START AFTER 8 00 AM 12 14 8 30 AM START TIME 8 30 AM START TIME MOST POPULAR WITH STUDENTS 18 19 9 00 AM START TIME 10 1 Read each headline and explain if the statement is supported by the data HEADLINE A HEADLINE B HEADLINE C 7 SMALL PERCENTAGE OF STUDENTS WANT TO START AT 7 45 AM HEADLINE D LESS THAN 100 STUDENTS WANT START AT 9 00 A

Statistics
Probabilityided to three significant digits Include the percent sign QUESTION 9 a An unknown virus with probability of 1 2 of catching it each time you step out the door has started spreading through the neighbourhood You have decided to go out three times in a week then what is the probability that you didn t catch the virus at ta end of the week Convert to percent then round to 3 significant figures DO NOT INPUT THE SYMBOL b You are in a room with 5 other people What is the probability that at least one other person has the same birthday month as y Convert to percent then round to 3 significant figures DO NOT INPUT THE SYMBOL c If you pick up a deck of cards and start drawing 4 cards What is the probability of drawing 4 jacks Assume no replacement Convert to percent then round to 3 significant fin

Statistics
ProbabilityThe Freshman 15 refers to the belief that college students gain 15 lb or 6 8 kg during their freshman year Listed in the accompanying table are weights kg of randomly selected male college freshmen The weights were measured in September and later in April Use the listed paired sample data and assume that the samples are simple random samples and that the differences have a distribution that is approximately normal GEREED the null hypothesis There September April 59 57 72 68 65 60 64 49 64 55 59 59 69 71 61 68 50 68 Use a 0 01 significance level to test the claim that for the population of freshman male college students the weights in September are less than the weights in the following April Identify the P value P value Round to three decimal places as needed What is the conclusion based on the hypothesis test Since the P value is the significance level sufficient evidence to support the claim that for the population of freshman male college students the weights in September are less than the weights

Statistics
ProbabilityWe want to obtain a sample to estimate a population mean Based on previous evidence researchers believe the population standard deviation is approximately o 70 2 We would like to be 99 confident that the esimate is within 5 of the true population mean How large of a sample size is required

Statistics
ProbabilityFor a confidence level of 98 with a sample size of 18 find the critical t value

Statistics
Probabilityn 13 3 Homework K Mark Jakob lives in Tulsa Oklahoma and California Madison Wisconsin and Ch Chicago costs 490 Berkeley to Madiso Tulsa

Statistics
ProbabilityB Ba 6 DETAILS Bb webassign net web Student Assignment Responses submit dep 316138 SMITHNM13 13 3 027 Bb ily wants to have four children Enter the probabilities as fractions the sample space Let B represent a boy and G represent a girl To G Enter your answers as a comma separated list


Statistics
ProbabilityIf necessary consult a list of formulas a A pizza parlor has a choice of 11 toppings for its pizzas From these 11 toppings how many different 8 topping pizzas are possible b From a collection of 50 store customers 2 are to be chosen to receive a special gift How many groups of 2 customers are possible

Statistics
ProbabilityMr James is about to give one of his students a piece of candy for asking a good question in class He s going to choose the piece of candy at random out of a bag he brings to class The following pieces of candy are in the bag 15 apple gumballs 4 grape gumballs and 4 apple suckers But there are no grape suckers What is the probability that the piece of candy Mr James chooses is grape or is a sucker Do not round intermediate computations and round your answer to the nearest hundredth If necessary consult a list of formulas

Statistics
ProbabilityFor each experiment determine whether events A and B are independent or dependent Experiment A deck contains 11 cards numbered 1 through 11 A card is randomly selected and reinserted into the deck The deck is shuffled Then another random selection is made Felipe randomly selects a sock from a drawer containing black socks and brown socks and puts it on Then another random selection is made from the remaining socks A family has two children A number cube with sides labeled 1 through 6 is rolled twice A litter of puppies consists of black puppies and white puppies A puppy is randomly selected and removed from the litter Then another random selection is made from the remaining puppies Events Event A The first selection is a 3 Event B The second selection is a 5 Event A The first selection is black Event B The second selection is brown Event A The older child has red hair Event B Both children have red hair Event A The first roll is a 5 Event B The second roll is a 1 Event A The first selection is a white puppy Event B The second selection is a black puppy Independent Dependent X

Statistics
ProbabilityA bag contains nine balls labeled 1 through 9 One ball will be randomly picked What is the probability of picking a multiple of 3 Write your answer as a fraction 0 88

Statistics
Probability4 The two way table gives some information about how 100 children travelled to school one day Boy Girl Total 1 point Walk 15 Boy Girl Total 37 87 5 Car Suppose a child is chosen at random What is the probability as a percentage that the child is a boy who took a car to school If necessary round to the nearest tenth 54 50 4 25 Walk 15 8 37 The two way table gives some information about how 100 children travelled to school one day Other 14 16 Car 8 Total 54 100 Other 14 16 Total 54 100 Suppose a child who took an other transportation is chosen at random What is the probability as a percentage that the child who took other transportation is a girl necessary round to the nearest tenth

Statistics
Probability2 3 points The two way table gives some information about how 100 children travelled to school one day Boy Girl Total m Walk 15 37 Boy Girl Total Car Walk 15 8 37 In the above two way table calculate the following values type only numbers 1 Number of girls who walked to school type your answer 2 Total of girls surveyed type your answer 3 Total number of students with other transportation type your answer 1 point The two way table gives some information about how 100 children travelled to school one day Other 14 16 Car 8 Total 54 100 Other 14 16 Total 54 100 Suppose a child is chosen at random What is the probability as a percentage that the child walked to school If necessary round to the neare 100 2 7

Statistics
Probability84 1 97 7 Question 2 20 points The heights of adult women are normally distributed with a mean of 62 5 inches and a standard deviation of 2 5 inches Determine

Statistics
ProbabilityQuestion 5 20 points Using a Standard Normal Distribution what z score has 80 of the distribution s area to the right O 0 842 O 0 020 0 842 O1 200 Submit Quiz 0 of 5 questions saved 80 Z scores

Statistics
ProbabilityO 4 4 8 8 Question 4 20 points Consider the data set Data Points x 14 2 2 11 8 What is the standard deviation of the data set 0 4 3 4 8 O 5 4

Statistics
ProbabilityCommunity college instructors salaries compensation The national mean is 5 survey a simple random sample of 33 c Test the instructors claim at the 0 005 Step 1 of 3 State the null and alternat

Statistics
ProbabilityQuestion 5 The objective of this question is to give practice with writing a function with several arguments and creating local objects a Write a function called z prop which calculates the z statistic given the following values arguments x the number of successes n the number of trials p0 the hypothesized population proportion Hint As a reminder the z statistic is given by the formula 2 p Po Po 1 Po where p denotes the sample proportion How is p related to the input arguments b Suppose that 60 of residents in the city of Pawnee Indiana prefer waffles over pancakes Out of a sample of 13 Pawnee residents 10 of them prefer waffles Use your z prop function from a to calculate the z statistic for this sample Hint The input argument p0 is a proportion not a percentage c Interpret the value of the z statistic from b in the context of the data Hint This is a Stats 10 12 13 question d For the same population of Pawnee residents another sample is observed Out of a sample of 39 Pawnee residents 30 of them prefer waffles Use your z prop function from a to calculate the 2 statistic for this How Wh b stiatio abangad12

Statistics
Probability5 According to a survey in 1993 52 of all media organizations had been served with subpoenas seeking unpublished photographs reporters notes or testimony from journalists Assume that 80 of these subpoenas were issued to newspaper companies even though only 50 of all news organizations were newspaper companies a Find the probability that a randomly selected news organization was served such a subpoena in 1993 and was a newspaper company b Find the probability that a randomly selected news organization was served such a subpoena in 1993 and was not a newspaper company Solution

Statistics
Probability6 Two dice one red one green are cast and the uppermost numbers are observed Test the given events for independence in each case a E The red die comes up 6 F The sum is odd b E The sum is 10 F The green die comes up odd

Statistics
Probability7 Your television advertising campaign seems to have been a flop According to a survey only 5 out of 500 people who saw the ad purchased your product but 100 people purchased the product without seeing the ad at all Supply hypothetical additional data would show that your ad campaign was in fact highly successful Justify your claim by calculating the relevant probabilities Solution

Statistics
Probability3 Your friend Joaqu n is telling everyone that the conditional probability P A B never be smaller than P AB Is he right If he is explain why if not give an example to prove him wrong Solution
Statistics
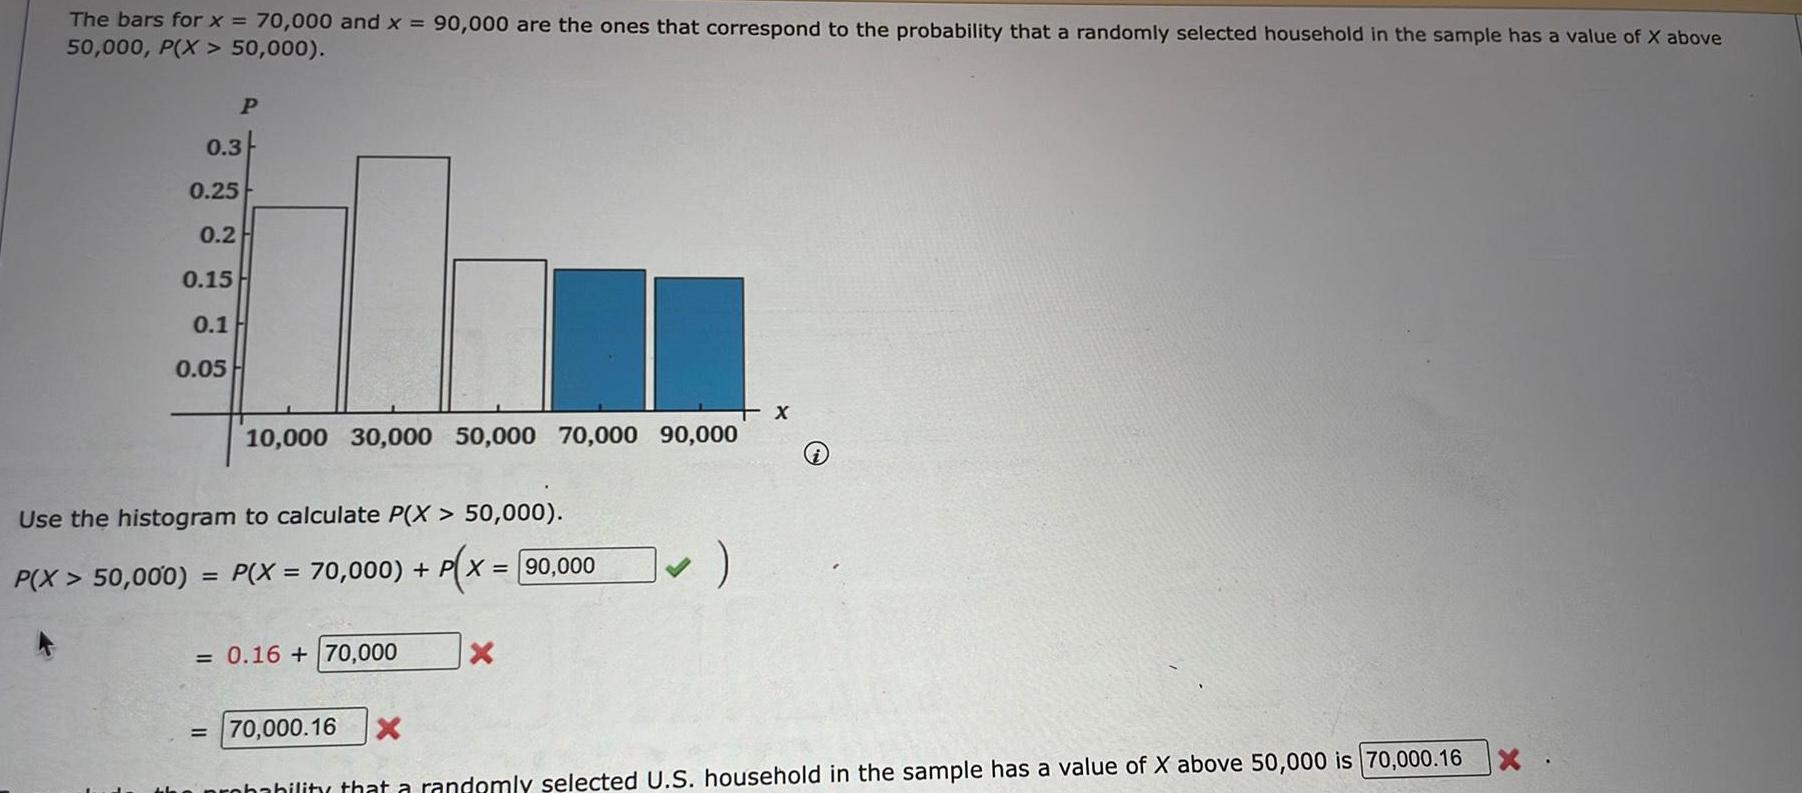
ProbabilityThe bars for x 70 000 and x 90 000 are the ones that correspond to the probability that a randomly selected household in the sample has a value of X above 50 000 P X 50 000 P 0 3 0 25 0 2 0 15 0 1 0 05 10 000 30 000 50 000 70 000 90 000 Use the histogram to calculate P X 50 000 P X 70 000 P X 90 000 P X 50 000 P X 70 000 P 0 16 70 000 x Tx i 70 000 16 X probability that a randomly selected U S household in the sample has a value of X above 50 000 is 70 000 16 X

Statistics
ProbabilityA children s clothing company sells han The company regularly tests the length or shorter than 28 inches the machine 29 15 Inches with a standard deviation hypothesis test on the accuracy of the Step 1 of 3 State the null and alterna

Statistics
Probabilityp q v rand p q vr Construct the truth table PT T T T q r PAq vr PA q v r T T F T F 11 T F F T F T F F F F TFT FTF Choose the correct answer below The statements are equivalent The statements are not equivalent equi

Statistics
ProbabilityUse the fact that p q is equivalent to p V q to write an equivalent form of the given statement If Janette buys a new bicycle then she sells her old bicycle Which statement is equivalent to the given sentence OA Janette buys a new bicycle or she sells her old bicycle B Janette does not buy a new bicycle or she does not sell her old bicycle C Janette does not buy a new bicycle and she sells her old bicycle O D Janette does not buy a new bicycle or she sells her old bicycle

Statistics
ProbabilityClick the icon to view the cash payment information Requirement Prepare a cash payments budget for April May and June and for the quarter If a box is not used in the table leave the box empty do not enter a zero The Berkner Company Cash Payments Budget For the Months of April through June April May Cash payments for direct materials 45 of current month purchases 55 of last month s purchases June CI Quarter quarter of the upcoming year

Statistics
ProbabilityA 2018 Beliefs and Values survey by Gallup used a random sample of 1024 American adults to examine American s attitudes about the morality of alcohol and marijuana use Respondents were asked Regardless of whether or not you think that it should be legal for each one please tell me whether you personally believe that in general it is morally acceptable or morally wrong Here are some findings displayed in the published report Drinking Alcohol Acceptable Wrong 78 19 15 23 U S adults Gender Men 84 70 Women 73 59 Who or what are the individuals in this study What type of study is it no answer required here How many variables are included in this summary 5 How many variables in this summary are quantitative 2 Smoking Marijuana Acceptable Wrong 65 31 Which of these is NOT a correct interpretation of the findings Overall respondents believed 3 pts 26 36 For both drinking alcohol and smoking marijuana men in the study were more likely than women to believe that the behavior was morally acceptable Overall a greater proportion of respondents believed that drinking alcohol is morally acceptable than believed smoking marijuana to be morally acceptable Overall respondents believed that drinking alcohol was more morally acceptable than smoking marijuana

Statistics
ProbabilityEach year the National College Athletic Association NCAA provides data on college sports injuries When an injury occurs the NCAA adds an entry to their database The database does not track which player experienced the injury This figure summarizes all injuries experienced by women s collegiate volleyball CV players from 2005 to 2009 It shows what percent of all injuries were of each type Injury types that made up less than 2 of all injuries were grouped together as All other Percent 30 20 10 0 25 3 Sprain 23 2 4 4 Muscle tear 3 6 1447 Injury type Bruising Concussion 2 Fracture 9 4 1 Who or what are the individuals in this study Select Tendinopathy 32 1 All other 2 What can we appropriately conclude from this NCAA data set Select 3 True or false 4 4 of all women s collegiate volleyball players experienced a concussion during that period

Statistics
ProbabilityA pizza delivery chain advertises that test and see if the mean delivery tim amount of time it takes for each of th that the population distribution is ap

Statistics
ProbabilityA population of values has an unknown distribution with 23 1 and o 78 2 You intend to draw a random sample of size n 223 What is the mean of the distribution of sample means Hz 147 x Please enter an exact answer What is the standard deviation of the distribution of sample means 0 3 58 x Please report your answer accurate to 2 decimal places

Statistics
Probabilityleading magazine like Barron s reported at one time that the average number of weeks an individual is unemployed is 24 weeks Assume that for the population of all unemployed individuals the length of unemployment is normally distributed where the population mean length of unemployment is 24 weeks and that the population standard deviation is 6 weeks Suppose you would like to select a random sample of 38 unemployed individuals for a follow up study Find the probability that a single randomly selected value is less than 25 P X 25 Find the probability that a sample of size n 38 is randomly selected with a mean less than 25 P M 25 Enter your answers as numbers accurate to 4 decimal places

Statistics
ProbabilityConsider the following set of test scores for a history class 100 45 60 60 50 50 45 95 60 55 40 The value of the mean for this data set would be digite sua resposta Input only a number 1 ponto Consider the following set of test scores for a history class 100 45 60 60 50 50 45 95 60 55 40 1 1 Would it be better for the teacher to consider the mean or the median to interpret the overall results of the test The median because it is a passing score and shows most students passed the test The mean because it coincides with the mode and shows that most students passed the test The median because it better reflects that most students did not pass and the teacher should revisit the material The mean because it is higher and the teacher wants to feel good about the students

Statistics
ProbabilityAnnual high temperatures in a certain location have been tracked for several years Let X represent the year and Y the high temperature Based on the data shown below calculate the correlation coefficient to three decimal places between X and Y Use your calculator r x 1 2 3 4 5 6 y 15 55 13 6 15 15 10 6 13 15 10 2