Probability Questions and Answers

Statistics
ProbabilityWarehouse Grocery Shop ping Therese manages a grocery warehouse that encourages volume shop ping on the part of its customers Therese has discovered that on any given weekday 70 of the customer sales amount to more than 100 That is any given sale on such a day has a probability of 0 70 of being for more than 100 Actu ally the conditional probabilities throughout the day would change slightly depending on earlier sales but this effect would be negligible for the first several sales of the day so we can treat them as independent Find the probability of each event Give answers to three decimal places 63 The first two sales on Wednesday are both for more than 100 049 64 The first three sales on Wednesday are all for more than 100 343 65 None of the first three sales on Wednesday is for more than 100 0 66 Exactly one of the first three sales on Wednesday is for more than 100 1

Statistics
ProbabilityPet Selection A no kill shelter has seven puppies including four huskies two terriers and one retriever If Rebecka and Aaron in that order each select one puppy at random with replace ment they may both select the same one find the probability of each event 37 Both select a husky 38 Rebecka selects a retriever Aaron selects a terrier 39 Rebecka selects a terrier Aaron selects a retriever 40 Both select a retriever Pet Selection Two puppies are selected as earlier but this tine without replacement Rebecka and Auron cannot bork select the same puppy Find the probability of each even 41 Both select a husky 42 Aaron selects a terrier given that Rebecka selects a husky 43 Aaron selects a retriever given that Rebecka selects a

Statistics
ProbabilityExperiment A hat contains slips of paper with the names of boys and girls in a class A name is randomly selected and returned to the hat The slips of paper are mixed Then another random selection is made A bag contains green marbles and orange marbles A marble is randomly selected from the bag and set aside Then another random selection is made from the remaining marbles A deck contains 12 cards labeled 1 through 12 A card is randomly selected and returned to the deck The deck is shuffled Then another random selection is made A family has two children A number cube with sides labeled 1 through 6 is rolled twice Events Independent Dependent Event A The first selection is a boy Event B The second selection is a girl Event A The first selection is a green marble Event B The second selection is an orange marble Event A The first selection is a 2 Event B The second selection is a 7 Event A The older child is a girl Event B Both children are girls Event A The first roll is a 4 Event B The second roll is a 5

Statistics
ProbabilityBased on past experience a bank believes that 9 of the people who receive loans will not make their payments on time The bank has recently approved 200 loans a Write about and check each of the conditions needed in the context of this situation to use the sampling distribution for the proportion of people who will not make their payments on time Central Limit Theorem Conditions What are the mean and standard deviation of this model b Mean c Standard deviation accurate to 4 decimal places d What is the probability that 10 or more of these clients will not make timeli

Statistics
ProbabilityUnited Airlines flights from Boston to Dallas are on time 70 of the time Suppose 9 flights are randomly selected and the number of on time flights is recorded Round answers to 4 decimal places a The probability that exactly 5 flights are on time is b The probability that at most 5 flights are on time is c The probability that at least 8 flights are on time is

Statistics
ProbabilityA home pregnancy test was given to people who might be pregnant Then to check its accuracy each person was given a blood test to see if they really were pregnant The following table shows the home pregnancy test results for people who were and were not actually pregnant Pregnant Not Pregnant Total Positive Home Test 69 5 74 Negative Home Test 7 Round your answers to 4 decimal places a What is the probability of getting a postive home test 58 65 Total 76 63 139 b What is the probability of getting a postive home test and not being pregnant c What is the probability of getting a negative home test given the person is pregnant

Statistics
ProbabilityIn a study the data you collect is Age in years This data is O Quantitative O Qualitative Question Help

Statistics
Probabilityselected location in Calil 27 Probabilities in Olympic Olympic curling the so shown here consists o centric circles on the ic of 6 inches 2 feet 4 feet If a team member lands a
Statistics
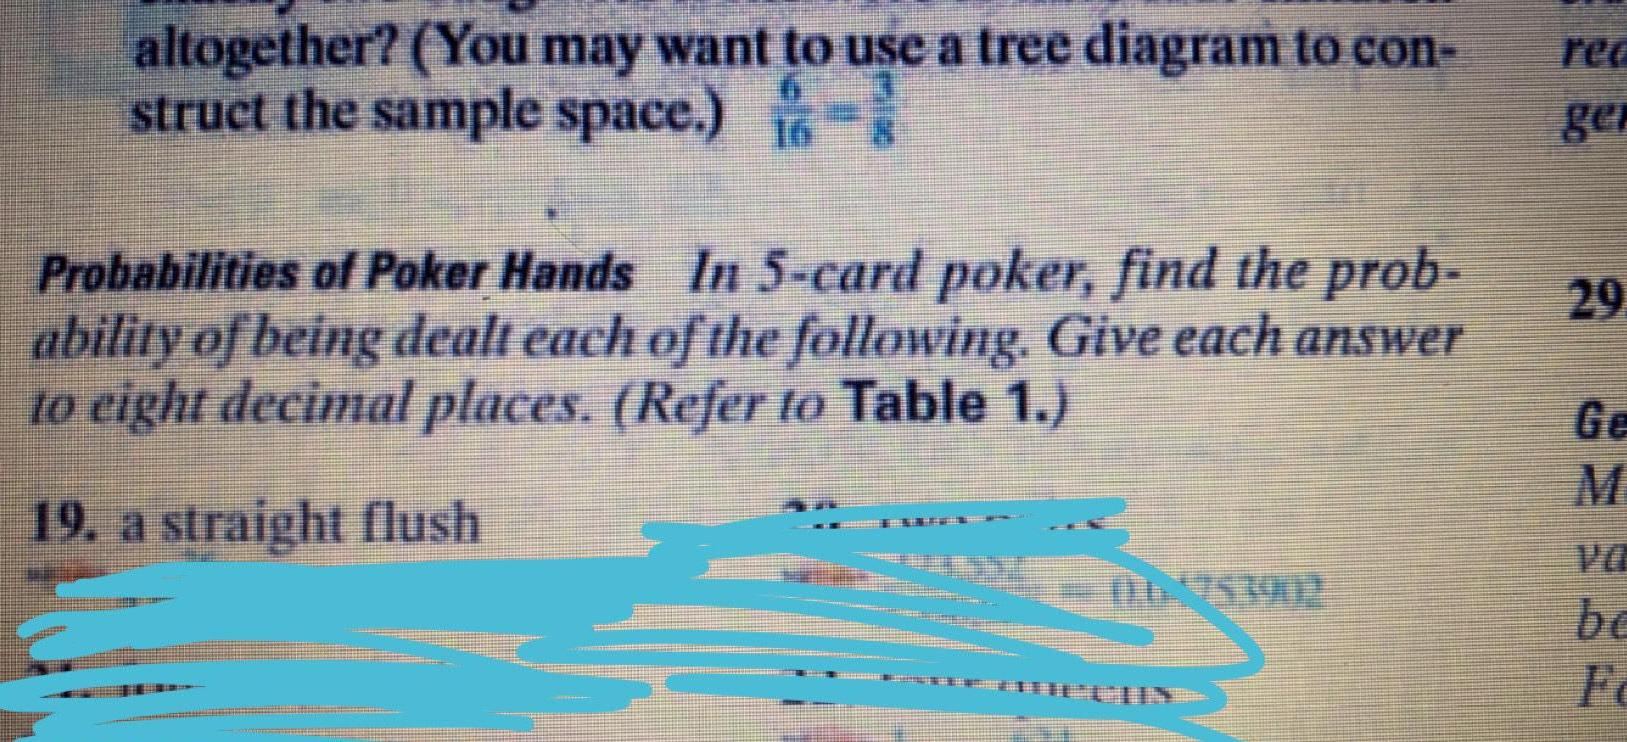
Probabilityaltogether You may want to use a tree diagram to con struct the sample space Probabilities of Poker Hands In 5 card poker find the prob ability of being dealt each of the following Give each answer to eight decimal places Refer to Table 1 19 a straight flush ger 29 Ge be

Statistics
ProbabilityThe number of televisions per household in a small town 0 1 2 3 4 24 121 230 313 4 Use the frequency distribution shown above to complete the following A B Televisions Households 12 Construct a probability distribution Show work for one probability value Graph the probability distribution using a histogram and describe its shape

Statistics
Probability9 In how many ways can a seven card hand be dealt that contains exactly three kings and two queens
Statistics
ProbabilityYou are taking a quiz that has 9 multiple choice questions If each question has 4 possible answers how many different ways are there to answer the test There are different ways to answer the test

Statistics
ProbabilityNominal GDP from a table Real GDP from a table and using GDP deflator GDP expenditure approach Other NIPA accounts NDP NI PI and DPI know how to adjust prices for inflation using a price index

Statistics
ProbabilityGress Domestic Product GDP Net Exports Xn Final Goods and Services why only include thes

Statistics
ProbabilityThe data given to the right includes data from 36 candies and 6 of them are red The company that makes the candy claims that 31 of its candies are red Use the sample data to construct a 90 confidence interval estimate of the percentage of red candies What do you conclude about the claim of 31 Construct a 90 confidence interval estimate of the population percentage of candies that are red p Type an integer or decimal rounded to one decimal place as needed Red 0 869 0 836 0 813 0 907 0 738 0 928 Weights g of a S Brown 0 889 0 828 0 992 0 929 0 796 Blue 0 908 0 897 0 795 0 983 0 797 0 973 0 719 0 855 0 805 0 795
Statistics
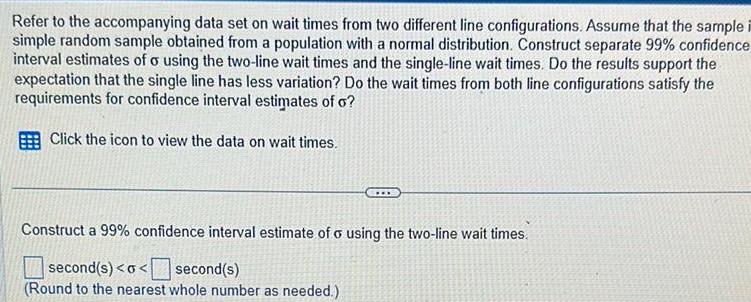
ProbabilityRefer to the accompanying data set on wait times from two different line configurations Assume that the sample i simple random sample obtained from a population with a normal distribution Construct separate 99 confidence interval estimates of o using the two line wait times and the single line wait times Do the results support the expectation that the single line has less variation Do the wait times from both line configurations satisfy the requirements for confidence interval estimates of o Click the icon to view the data on wait times Construct a 99 confidence interval estimate of o using the two line wait times second s o second s Round to the nearest whole number as needed

Statistics
Probability3 5 points The line of best fit on a scatterplot passes through 9 8 and has a y intercept of 16 a What is the slope of the line b Write the equation of the line lue of x

Statistics
ProbabilityAccording to the American Time Use Survey Americans sleep an average of 7 79 hours each day with a standard deviation of 2 45 hours Let be the average of a random sample of Americans What sample size will give the standard deviation of equal to 0 31 hours Round the solution up to the nearest whole number if necessary n IL

Statistics
ProbabilityLet x be a normally distributed continuous random variable with a mean of 214 and a standard deviation of 30 Determine the value of a such that the area to the right of x is 0 9306 Round the solution to two decimal places if necessary 8

Statistics
ProbabilityResearchers asked students at various stages in their educational career whether they support the building of a mall in Elk Grove Middle School High School College Yes 12 15 8 No 14 15 0 Undecided 3 17 8 10 You can leave your answers as fractions You also don t have to reduce the fractions Ex 12 a If one student is selected find the probability that the student is in college b If one student is selected find the probability that the student is in middle school and the student answered No c If one student is selected find the probability that the student is in high school or the student is Undecided d If one student is selected find the probability that the student did not answer No

Statistics
ProbabilityA coin is tossed four times Construct a sample space for this experiment and answer the following questions Hint There should be 16 outcomes 6 You can leave your answers as fractions You also don t have to reduce the fractions ex 8 a What is the probability that there are exactly two heads b What is the probability that there are at least three heads c What is the probability that there are at most two heads d What is the probability that the first and last tosses are the same
Statistics
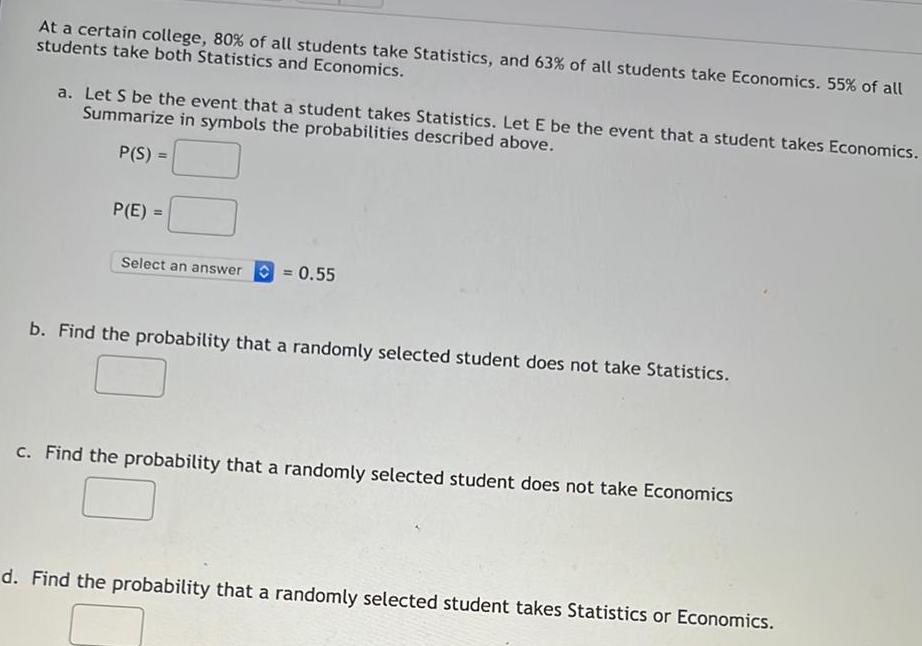
ProbabilityAt a certain college 80 of all students take Statistics and 63 of all students take Economics 55 of all students take both Statistics and Economics a Let S be the event that a student takes Statistics Let E be the event that a student takes Economics Summarize in symbols the probabilities described above P S P E Select an answer 0 55 b Find the probability that a randomly selected student does not take Statistics c Find the probability that a randomly selected student does not take Economics d Find the probability that a randomly selected student takes Statistics or Economics

Statistics
ProbabilityAn urn contains 10 red marbles 10 white marbles and 8 blue marbles marbles A child randomly selects three without replacement from the urn Round to four decimal places a Find the probability all three marbles are the same color b Find the probability that none of the three marbles are white

Statistics
ProbabilityGiving a test to a group of students the grades and gender are summarized below Round your answers to 4 decimal places Grades and Gender A B C Male 14 16 20 Female 17 18 Total 31 34 5 25 Total 50 40 90 If one student is chosen at random a Find the probability that the student was female b Find the probability that the student was female AND got a C c Find the probability that the student was male OR got a B d If one student is chosen at random find the probability that the student got an B GIVEN they are female
Statistics
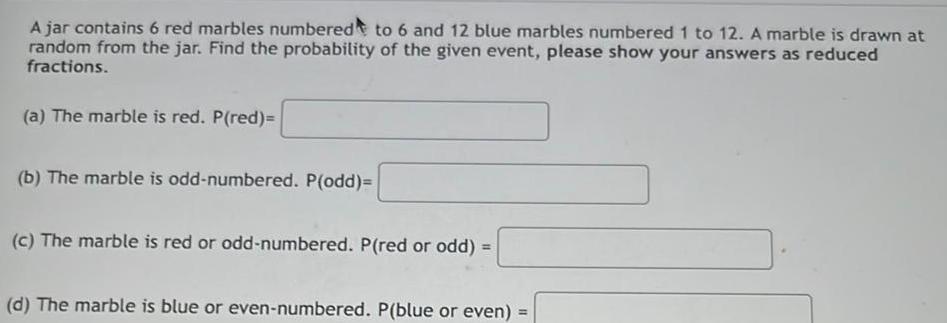
ProbabilityA jar contains 6 red marbles numbered to 6 and 12 blue marbles numbered 1 to 12 A marble is drawn at random from the jar Find the probability of the given event please show your answers as reduced fractions a The marble is red P red b The marble is odd numbered P odd c The marble is red or odd numbered P red or odd d The marble is blue or even numbered P blue or even

Statistics
ProbabilityA bag of M M s has 7 red 4 green 8 blue and 3 yellow M M s What is the probability of randomly picking a a yellow Leave answer as a reduced fraction b a blue or green c an orange

Statistics
ProbabilityExperiment A litter of puppies consists of black puppies and white puppies A puppy is randomly selected and removed from the litter Then another random selection is made from the remaining puppies A family has two children A hat contains slips of paper with the names of boys and girls in a class A name is randomly selected and returned to the hat Then another random selection is made A box contains pens Some pens have ink and some do not A teacher randomly selects a pen and sets it aside Then another random selection is made from the remaining pens At the beginning of each of two football games a coin is tossed and the winner of the coin toss is determined Events Event A The first selection is a black puppy Event B The second selection is a white puppy Event A The older child has brown eyes Event B Both children have brown eyes Event A The first selection is a boy Event B The second selection is a girl Event A The first selection is a pen with ink Event B The second selection is a pen with no ink Event A In the first game the home team wins the coin toss Event B In the second game the visiting team wins the coin toss Independent Dependent O

Statistics
Probabilityments viewer classes c2225e YouTube D Menus Fayette Co Google Docs C C opic 11 12 Prob Stats Exam Part 2 AA2 LMS graded ing calculator to find the equation of the line of best fit for the 1998 1999 2000 2001 2002 2003 2004 2005 2 1396 1413 1287 1312 1328 1340 1371 1391 d
Statistics
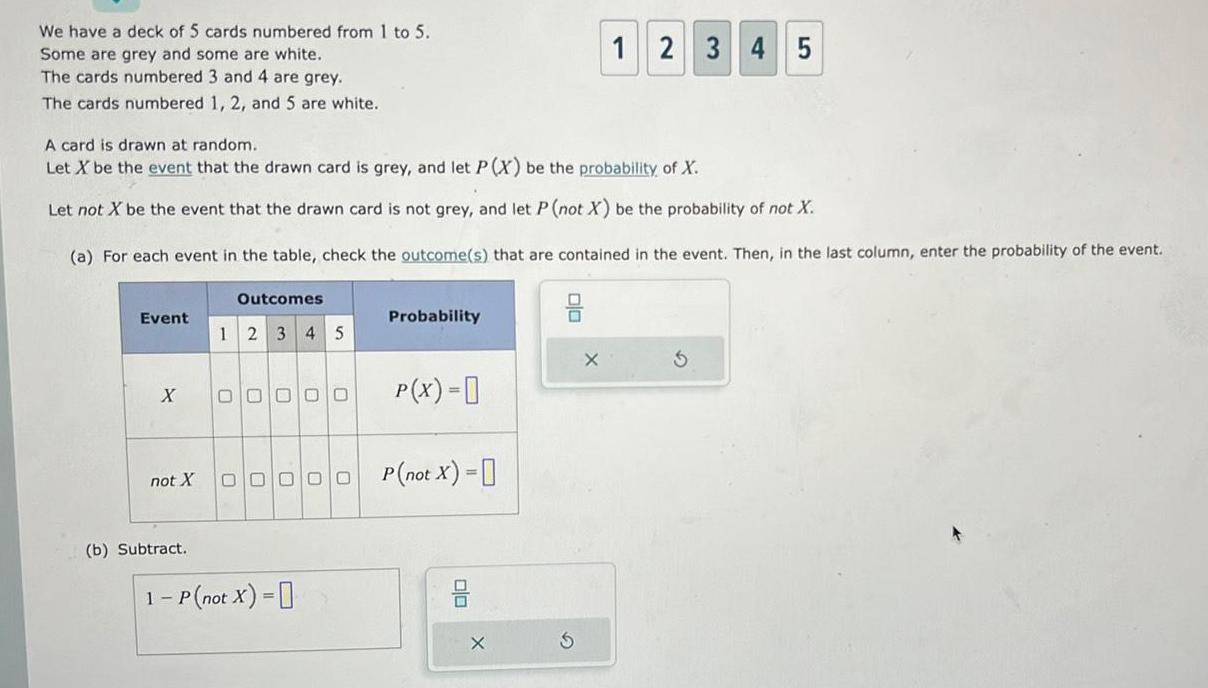
ProbabilityWe have a deck of 5 cards numbered from 1 to 5 Some are grey and some are white The cards numbered 3 and 4 are grey The cards numbered 1 2 and 5 are white A card is drawn at random Let X be the event that the drawn card is grey and let P X be the probability of X Let not X be the event that the drawn card is not grey and let P not X be the probability of not X a For each event in the table check the outcome s that are contained in the event Then in the last column enter the probability of the event Event X Outcomes 1 2 3 4 5 b Subtract 00000 not X 00000 1 P not X Probability P X 0 P not X X S 1 2 3 4 5 X

Statistics
Probabilityk 6 1 6 6 Use a calculator or computer software to generate a normal quantile plot for the data in the accompanying table Then determine whether the data come from a normally distributed population Click the icon to view the data set Generate a normal quantile plot for the data Choose the correct graph below OA 3 00 200 1 004 0 004 1 00 2 00 3 00 Home Q a G 0100 200 300 400 500 OB 3 00 2 00 1 00 0 00 1 00 2004 300 100 200 300 400 500 x Value Q Q G OC 3 00 200 1 00 000 1 00 200 3 00 0 100 200 300 400 500 359 oota Q Q

Statistics
ProbabilityW History X Bookmarks Profiles 5 1 HW Blackboard L com Student PlayerHomework as

Statistics
Probabilitywork 6 1 6 6 Find the indicated z score The graph depicts the standard normal distribution with mean 0 and standard deviation 1 The indicated 2 score is Inlaces as needed EXT 0 100

Statistics
ProbabilityIn a survey of 1023 people 743 people said they voted in a recent presidential election Voting records show that 70 of eligible voters actually did vote Given that 70 of eligible voters actually did vote a find the probability that among 1023 randomly selected voters at least 748 actually did vote b What do the results from part a suggest a P X 748 Round to four decimal places as needed

Statistics
ProbabilityAn airliner carries 100 passengers and has doors with a height of 76 in Heights of men are normally distributed with a mean of 69 0 in and a standard deviation of 2 8 in Complete parts a through d a If a male passenger is randomly selected find the probability that he can fit through the doorway without bending The probability is Round to four decimal places as needed

Statistics
ProbabilityThe value given below is discrete Use the continuity correction and describe the region of the normal distribution that corresponds to the indicated probability Probability of fewer than 8 passengers who do not show up for a flight Choose the correct answer below OA The area to the left of 8 5 OB The area to the right of 8 5 OC The area between 7 5 and 8 5 OD The area to the left of 7 5 OE The area to the right of 7 5 KITE

Statistics
Probabilitywork 6 1 6 6 The waiting times between a subway departure schedule and the arrival of a passenger are uniformly distributed between 0 and 8 minutes Find the probability that a randomly selected waiting time greater than 4 25 minutes KIS Find the probability that a randomly selected passenger has a waiting time greater than 4 25 minutes Simplify your answer Round to three decimal places as needed 21

Statistics
Probabilitywork 6 1 6 6 Engineers want to design seats in commercial aircraft so that they are wide enough to fit 99 of all adults Accommodating 100 of adults would require very wide seats that would be much too Assume adults have hip widths that are normally distributed with a mean of 14 7 in and a standard deviation of 1 1 in Find P99 That is find the hip width for adults that separates the smallest 99 largest 1 What is the maximum hip width that is required to satisfy the requirement of fitting 99 of adults in Round to one decimal place as needed GIIS

Statistics
ProbabilityFind the indicated critical value 2009 Click to view page 1 of the table Click to view page 2 of the table 20 09 Round to two decimal places as needed

Statistics
ProbabilityOn a particular day a fitness studio had 184 customers For each an employee recorded whether the customer was new and what class the customer took The data are summarized in the table below New Yoga Dance Boxing Pilates 34 11 33 24 Not new 23 36 5 18 Suppose a customer from that particular day is chosen at random Answer each part Do not round intermediate computations and round your answers to the nearest hundredth If necessary consult a list of formulas a What is the probability that the customer took a dance class given that the customer was new 0 b What is the probability that the customer took a boxing class X

Statistics
ProbabilityDr Griffin is a veterinarian who sees only dogs and cats In each appointment she may or may not give the animal a vaccine The two way frequency table summarizes Dr Griffin s 50 appointments last week Vaccine No vaccine Dog 12 13 Let vaccine be the event that a randomly chosen appointment from the table included a vaccine Let dog be the event that a randomly chosen appointment from the table involved a dog Find the following probabilities Write your answers as decimals If necessary consult a list of formulas a P vaccine 0 Cat 18 7 b P dog and vaccine c P dog vaccine

Statistics
ProbabilityIn a valid probability distribution each probability must be between 0 and 1 inclusive and the probabilities must add up to 1 If a probability distribution is 10 10 2 X what is the value of x

Statistics
ProbabilityA ja Wilson shoots 58 of FG attempts during the 2020 WNBA season She will attempt 15 shots in her next game Find the probability she makes at least 8 shots

Statistics
ProbabilityThe gender and year of each of the 218 students in a high school band were recorded The data are summarized in the table below Male Female Freshman Sophomore Junior Senior 32 16 23 41 26 26 33 Suppose a student from the high school band is chosen at random Answer each part Do not round intermediate computations and round your answers to the nearest hundredth If necessary consult a list of formulas a What is the probability that the student is female given that the student is a senior 0 b What is the probability that the student is male X

Statistics
ProbabilityA fair die is rolled 6 times What is the probability of having no 1 and no 3 among the rolls Round your answer to three decimal places If necessary consult a list of formulas 0 X 5

Statistics
ProbabilityA local high school has both male and female students Each student either plays a sport or doesn t The two way table summarizes a random sample of 70 students Male Female Sport 19 16 No sport 28 7 Let male be the event that a randomly chosen student from the table is male Let no sport be the event that a randomly chosen student from the table does not play a sport Find the following probabilities Write your answers as decimals If necessary consult a list of formulas a P no sport 0 b P male and no sport c P male no sport

Statistics
ProbabilityA box has 13 candies in it 4 are caramel 5 are peppermint and 4 are taffy Each candy falls into only one of these categories Chau wants to select two candies to eat for dessert The first candy will be selected at random and then the second candy will be selected at random from the remaining candies What is the probability that the two candies selected are taffy Do not round your intermediate computations Round your final answer to three decimal places If necessary consult a list of formulas Aa

Statistics
ProbabilityAbdul is playing a game of chance in which he tosses a dart into a rotating dartboard with 8 equal sized slices numbered 1 through 8 The dart lands on a numbered slice at random This game is this Abdul tosses the dart once He wins 1 if the dart lands in slice 1 3 if the dart lands in slice 2 S5 if the dart lands in slice 3 S8 if the dart lands in slice 4 and 10 if the dart lands in slice 5 He loses 9 if the dart lands in slices 6 7 or 8 If necessary consult a list of formulas a Find the expected value of playing the game dollars b What can Abdul expect in the long run after playing the game many times O Abdul can expect to gain money He can expect to win dollars per toss O Abdul can expect to lose money He can expect to lose dollars per toss O Abdul can expect to break even neither gain nor lose money

Statistics
ProbabilityOf the drivers who stop at a gas station 93 purchase gasoline and 5 purchase both gasoline and oil A total of 7 purchase oil Answer the questions below If necessary consult a list of formulas a What is the probability that a driver purchases oil given that he or she purchases gasoline Round your answer to 2 decimal places 0 b What is the probability that a driver purchases gasoline given that he or she purchases oil Round your answer to 2 decimal places X S

Statistics
ProbabilityAt a certain non profit organization 50 of employees are college graduates and 38 of employees have more than ten years of experience If 53 of the organization s employees are either college graduates or have more than ten years of experience or both what is the probability that a randomly selected employee will have more than ten years of experience and be a college graduate Write your answer as a decimal not as a percentage If necessary consult a list of formulas

Statistics
ProbabilityOn a particular day a restaurant that is open for lunch and dinner had 187 customers Each customer came in for one meal An employee recorded at which meal each customer came in and whether the customer ordered dessert The data are summarized in the table below Dessert No dessert Lunch 36 Dinner 34 28 89 Suppose a customer from that day is chosen at random Answer each part Do not round intermediate computations and round your answers to the nearest hundredth 0 If necessary consult a list of formulas a What is the probability that the customer came for dinner and did not order dessert b What is the probability that the customer came for dinner or did not order dessert X