Questions
The best high school and college tutors are just a click away, 24×7! Pick a subject, ask a question, and get a detailed, handwritten solution personalized for you in minutes. We cover Math, Physics, Chemistry & Biology.

College Statistics
Statistics4 Write below what are the values of the mean median mode standard deviation variance skewness and kurtosis of this data Mean 201 5000 Median 202 5000 Mode 145 00 Standard Deviation 31 20813 ms Variance 973 947 Skewness 1512

Anatomy and Physiology
Introduction to PhysiologyWhich of the following is not a characteristic that contributes to erythrocyte gas transport functions Produces energy anaerobically Performs mitosis Few organelles provide room for hemoglobin


College Math - Others
Basic MathA comparison is made between two bus lines to determine if arrival times of their regular buses from Denver to Durango are off schedule by the same amount of time For 51 randomly selected runs bus line A was observed to be off schedule an average time of 53 minutes with standard deviation 17 minutes For 60 randomly selected runs bus line B was observed to be off schedule an average of 60 minutes with standard deviation 15 minutes Do the data indicate a significant difference in average off schedule times Use a 5 level of significance Let bus line A be population 1 and bus line B be population 2 USE SALT a What are we testing in this problem a single proportion a single mean a difference of proportions a paired difference difference of means b What is the level of significance 0 05 State the null and alternate hypotheses in minutes Enter for as needed Ho M1 1 H M 1 c What sampling distribution will you use What assumptions are you making We ll use the standard normal Since the sample sizes are not sufficiently large we need to assume the data are two independent random samples from the relevant populations and that the population distributions are at least mound shaped We ll use the Student s t Since the sample sizes are sufficiently large we only need to assume the data are two independent random samples from the relevant populations We ll use the standard normal Since the sample sizes are sufficiently large we only need to assume the data are two independent random samples from the relevant populations We ll use the Student s t Since the sample sizes are not sufficiently large we need to assume the data are two independent random samples from the relevant populations and that the population distributions are at least mound shaped Use the sample test statistic to compute the corresponding distribution value Test the difference Round your answer

College Statistics
StatisticsSubmit Suppose IQ scores were obtained for 20 randomly selected sets of couples The 20 pairs of measurements yield x 96 51 y 98 15 r 0 840 P value 0 000 and y 2 4 0 99x where x represents the IQ score of the husband Find the best predicted value of y given that the husband has an IQ of 110 Use a significance level of 0 05 Click the icon to view the critical values of the Pearson correlation coefficient r

College Statistics
StatisticsThe accompanying table lists overhead widths cm of seals measured from photographs and the weights kg of the seals Find the a explained variation b unexplained variation and c prediction interval for an overhead width of 9 1 cm using a 99 confidence level There is sufficient evidence to support a claim of a linear correlation so it is reasonable to use the regression equation when making predictions Click the icon to view the seal data a The explained variation is Round to the nearest integer as needed b The unexplained variation is Round to the nearest integer as needed c The 99 prediction interval for an overhead width of 9 1 cm is kg y kg Round to one decimal place as needed S 1747 HIDD Seal Data Overhead Width 7 1 7 3 3826 9 8 938 92 k 8 6 8 3 Submit test Weight 118 156 240 198 197 189 X


College Statistics
StatisticsL The property that defines the golden ratio is L 1 1 5 2 1 L Complete parts a through b below Rearrange the resulting equation from the previous step so that 0 is on the right side L L 1 0 Simplify your answer What is the value of o Simplify your answer Type an exact answer using radicals as needed Substitute the value of for L into the rearranged equation and simplify the left side

College Math - Others
Linear ProgrammingPhysical Activity 1 Using a periodic table fill in the blanks to complete the following nuclear equations Then identify which type of decay particles were produced Hi lite the alpha particle with green beta particles with blue and gamma rays with yellow Kindly use RED INK in answering 1 2 4 12Ke 3 21Pb 5 35 13C H 56 35CL 206Hg 80 He 207T1 ie Ni 6 7 Baie 8 Mg 9 5N H 2C 10 Be H 22 Mg 3C He alpha beta Gamma

College Algebra
Quadratic equationsGraph the function Be sure to label three points on the graph f x x Choose the correct graph below OA B 5 Q 5 www O C Q O D Ay

College Statistics
StatisticsUsing the lengths in chest sizes in and weights lb of bears from a data set the resulting regression equation is Weight 274 0 426 Length 12 1 Chest Size The P value is 0 000 and the adjusted R value is 0 925 If an additional predictor variable of neck size in is included the P value becomes 0 000 and the adjusted R becomes 0 933 Why is it better to use values of adjusted R instead of simply using values of R Choose the correct answer below OA The unadjusted R decreases or remains the same as more variables are included but the adjusted R is adjusted for the number of variables and sample size OB The unadjusted R increaseslor remains the same as more variables are included but the adjusted R is adjusted for the number of variables and sample size OC The unadjusted R can only be calculated for regression equations with P values greater than 0 while the adjusted R can be calculated for regression equations with any manner of P value OD The unadjusted R can only be calculated for regression equations with two or fewer predictor variables while the adjusted R can be calculated for regression equations with any number of predictor variables

College Math - Others
Basic MathConsider independent random samples from two populations that are normal or approximately normal or the case in which both sample sizes are at least 30 Then if o and are unknown but we have reason to believe that o we can pool the standard deviations Using sample sizes n and n the sample test statistic x x has a Student s t distribution where 2 with degrees of freedom d f n n 2 and where the pooled standard deviation s is n 1 s 2 n 1 5 n n 2 Note With statistical software select the pooled variance or equal variance options LAUSE SALT a There are many situations in which we want to compare means from populations having standard deviations that are equal This method applies even if the standard deviations are known to be only approximately equal Consider a report regarding average incidence of fox rabies in two regions For region I n 16 x 4 6875 and s 3 0489 and for region II n 15 x 4 and s 2 1381 The two sample standard deviations are sufficiently close that we can assume Use the method of pooled standard deviation to consider the report testing if there is a difference in population mean average incidence of rabies at the 5 level of significance Round your answer to three decimal places State the null and alternate hypotheses Enter for as needed H i th kh ng H M 12 Use the sample test statistic to find the corresponding t value Test the difference Round your final answer to two decimal places

High School Calculus
Application of derivatives1 In the right angle triangle 4ABC where ZC is 90 ZA 42 and side c 45 cm determine the unknown side a Round your answer to the nearest centimetre a sin42 45 A 30 cm B 32 cm C 29 cm D 31 cm 2 Use right angle trigonometry to determine ZA Round your answer to the nearest degree b 12 C A 36 B 45 C 30 D 37 c 15 B unknown ride a Bound your answer to the nearest tenth of a unit

College Math - Others
Basic MathDetermine whether the subset of Mn n is a subspace of Mn n with the standard operations of matrix addition and scalar multiplication The set of all n x n matrices whose entries sum to one O subspace O not a subspace

College Algebra
Matrices & Determinantsb 3 Let A C d null space and a basis of the row space of A and show that they are perpendicular a 9 where a 0 For what value of d is rank A 1 In this case find a basis of the

College Math - Others
Basic MathIs W a subspace of the vector space If not state why Select all that apply W is the set of all vectors in R2 whose components are rational numbers OW is a subspace of R OW is not a subspace of R2 because it is not closed under addition OW is not a subspace of R2 because it is not closed under scalar multiplication


College Statistics
StatisticsUsing techniques from an earlier section we can find a confidence interval for H Consider a random sample of n matched data pairs A B Let d B A be a random variable representing the difference between the values in a matched data pair Compute the sample mean d of the differences and the sample standard deviation s If d has a normal distribution or is mound shaped or if n 30 then a confidence interval for u is as follows d E d E where E t 5d Jn c confidence level 0 c 1 t critical value for confidence level c and d f n 1 B Percent increase for company A Percent increase for CEO USE SALT 20 12 24 18 6 4 21 37 22 22 24 14 4 19 15 30 a Using the data above find a 95 confidence interval for the mean difference between percentage increase in company revenue and percentage increase in CEO salary Enter your answer in the form lower limit to upper limit Include the word to Round your numerical values to two decimal places Your answer cannot be understood or graded More Information

College Algebra
Quadratic equationsGiven that ray KM bisects LJKL find the two angle measures m JKM m JKL X no answer X no answer K 51 M L

College Math - Others
Basic MathIn this problem assume that the distribution of differences is approximately normal Note For degrees of freedom d f not in the Student s t table use the closest d f that is smaller In some situations this choice of d f may increase the P value by a small amount and therefore produce a slightly more conservative answer In environmental studies sex ratios are of great importance Wolf society packs and ecology have been studied extensively at different locations in the U S and foreign countries Sex ratios for eight study sites in northern Europe are shown below Location of Wolf Pack Males Winter Males Summer Finland Finland Finland Lapland Lapland Russia Russia Russia USE SALT a What is the level of significance 0 05 88 39 79 55 64 50 41 55 69 Will you use a left tailed right tailed or two tailed test Oright tailed two tailed left tailed 42 61 48 55 50 It is hypothesized that in winter loner males not present in summer packs join the pack to increase survival rate Use a 5 level of significance to test the claim that the average percentage of males in a wolf pack is higher in winter Let d winter summer 50 45 State the null and alternate hypotheses Enter for as needed Ho H b What sampling distribution will you use What assumptions are you making We ll use the Student s t We assume that d has an approximately uniform distribution O We ll use the Student s t We assume that d has an approximately normal distribution We ll use the standard normal We assume that d has an approximately uniform distribution We ll use the standard normal We assume that d has an approximately normal distribution What is the t value of the sample test statistic Round your answer to two decimal places

College Statistics
ProbabilityThe property that defines the golden ratio is 1 a Show that if both sides are multiplied by L and rearranged this equation becomes L L 1 0 Confirm that substituting the value of for L satisfies this equa First multiply both sides by L L 1 L 1 L Complete parts a through b below L 1 Multiply both sides by L Simplify your answers Type the terms of your expression in the same order as they appear in the original expression Rearrange the resulting equation from the previous step so that 0 is on the right side 0 Simplify your answer

College Math - Others
Basic MathList the advantages of using paired data to conduct a statistical test Select all that apply Using paired data should theoretically reduce measurement variability and decrease the accuracy of statistical conclusions Using paired data should theoretically reduce measurement variability and increase the accuracy of statistical conclusions Using paired data should theoretically increase measurement variability and decrease the accuracy of statistical conclusions Using paired data often enhances the effect of extraneous or uncontrollable factors being present in our data Using paired data should theoretically increase measurement variability and increase the accuracy of statistical conclusions Using paired data often reduces the effect of extraneous or uncontrollable factors being present in our data
College Algebra
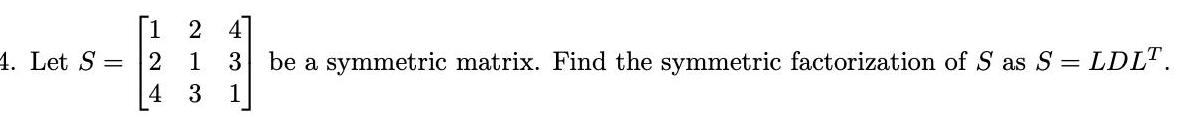
Matrices & Determinants4 Let S 1 2 4 2 1 3 be a symmetric matrix Find the symmetric factorization of S as S LDLT 3 1

College Statistics
StatisticsRefer to the accompanying scatterplot a Examine the pattern of all 10 points and subjectively determine whether there appears to be a strong correlation between x and y b Find the value of the correlation coefficient r and determine whether there is a linear correlation c Remove the point with coordinates 10 9 2 and find the correlation coefficient r and determine whether there is a linear correlation d What do you conclude about the possible effect from a single pair of values Click here to view a table of critical values for the correlation coefficient a Do the data points appear to have a strong linear correlation O Yes O No b What is the value of the correlation coefficient for all 10 data points Simplify your answer Round to three decimal places as needed Is there a linear correlation between x and y Use a 0 01 r OA Yes because the correlation coefficient is in the critical region OB Yes because the correlation coefficient is not in the critical region

College Statistics
StatisticsCalculate the Fixation index in the Subpopulation relative to the lo the information provided 2pq H FST 2pq Pop 1 Pop 2 0 19 0 09 AA 0 81 0 25 Aa 0 18 0 50 popu aa 0 01 0 25

College Math - Others
Basic MathIn this problem assume that the distribution of differences is approximately normal Note For degrees of freedom d f not in the Student s t table use the closest d f that is smaller In some situations this choice of d f may increase the P value by a small amount and therefore produce a slightly more conservative answer Are America s top chief executive officers CEOS really worth all that money One way to answer this question is to look at row B the annual company percentage increase in revenue versus row A the CEO s annual percentage salary increase in that same company Suppose a random sample of companies yielded the following data B Percent increase 22 25 27 18 6 for company A Percent increase for CEO 4 21 37 25 23 22 14 4 19 15 30 LUSE SALT Do these data indicate that the population mean percentage increase in corporate revenue row B is different from the population mean percentage increase in CEO salary Use a 5 level of significance Let d B A a What is the level of significance X You may have forgotten to multiply or divide by 100 State the null and alternate hypotheses in percent Enter for as needed Ho Check which variable s should be in your answer

College Statistics
StatisticsFind an equation for the exponential function f x a b graphed below f x 15 10 5 0 5

College Algebra
Complex numbersUse Synthetic Division to determine the quotient Then use the quotients to write the dividend in factored form and list all the zeros Complete work must be shown for credit 2x 7x 10z 24 4 Quotient Factored Form Zeros X

High School Math - Others
FunctionsGraph a line that contains the point 2 7 and has a slope of 4 7 6 5 4 3 2 N Y 6 5 4 3 2 1 2 5 64 2 3 4 5 6 7 6

High School Calculus
Application of derivativesFind the instantaneous rate of change of the function at the given f x f a x a x value using the form lim x a 2 y 3x2 4x 7 at x
High School Calculus
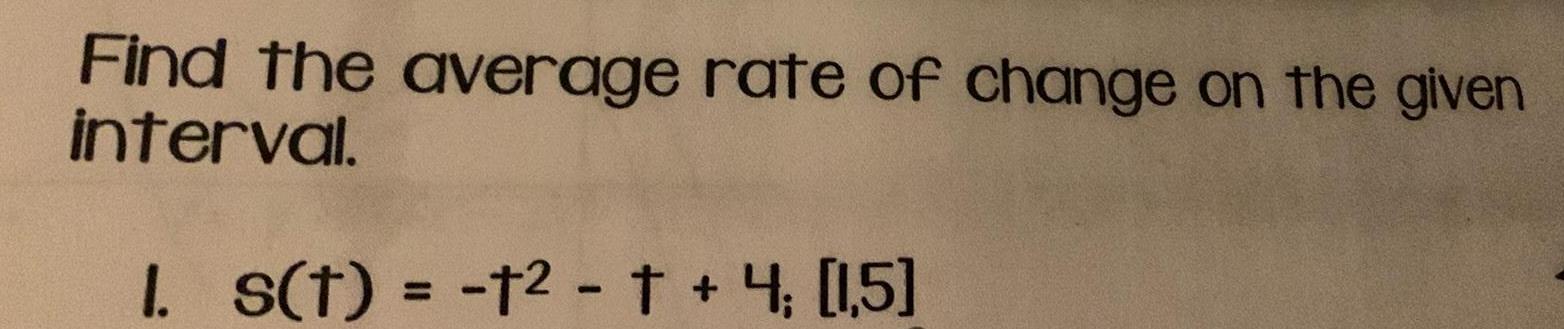
DifferentiationFind the average rate of change on the given interval 1 s t t t 4 15

College Algebra
Permutations and CombinationsGiven the demand equation x 20 40 where p represents the price in dollars and x the number of units determine the elasticity of demand when the price p is equal to 5 P Elasticity of Demand Therefore demand is elastic inelastic O unitary when price is equal to 5 and a small increase in price will result in an increase in total revenue O little to no change in total revenue a decrease in total revenue


College Statistics
StatisticsThe length of one side of a golden rectangle is 4 9 meters Find the length of the other side Notice that the other side could be either longer or shorter than the given side Use the approximation 1 62 for your work If 4 9 is the long side the short side is Round to two decimal places as needed meters If 4 9 is the short side the long side is meters Round to two decimal places as needed

Biology
Human Physiology - Breathing & Exchange of GasesStep 01 Find an article in the popular press that addresses any areas of social determinants of health for American Indian Alaska Native health Create your own outline of what you will talk about these are your private notes of main points questions you have etc Link off of some type of evidence in this article to another resource What does this article tell you Why is it important Does it help you understand the main points the issue etc Do you agree or disagree What s your opinion now Write and post a 1 2 page blog about the article that you found including a short summary evidence and your opinion Make sure you provide a link or source to the article just Respond to other student posts by Friday Feb 23 2024 at 1159pm

Biology
Biotechnology: Principles and ProcessesWhat is the instrument used for cell counting called O Barometer O Countingmeter O Thermometer

Biology
Biotechnology & its ApplicationsO Extension O Annealing O Denaturation O Translation Question 10 How does DNA travel from negative to positive By car From cathode to anode From anode to cathode

College Statistics
StatisticsThe sides of a rectangle are given Compute the ratio of the long side to the short side for the rectangle Is the rectangle a golden rectangle Choose the correct answer below O No O Yes

Biology
Cell: The Unit of LifeWhat is the difference between direct and indirect immunocytochemistry O Indirect immunocytochemistry does not use use antibodies O Indirect immunocytochemistry uses a secondary antibody O Direct immunocytochemistry can tell you directions to the mall O Indirect immunocytochemistry uses a primary antibody that is directly conjugated to a label

Biology
Cell: The Unit of LifeUsed to detect proteins or antigens using a chemistry formula O Used to measure the amount of sugar in the body Used to detect specific proteins or antigens within cells using antibodies O Used to detect any proteins and any antigens within a cell using antibodies

Biology
Cell: The Unit of LifeWhat is live cell imaging O Looking at the cell behavior once they are dead Printing a picture of a cell It is a technique used to visualize and study the behavior of living cells in real time It is a technique used to amplify a DNA segment

High School Calculus
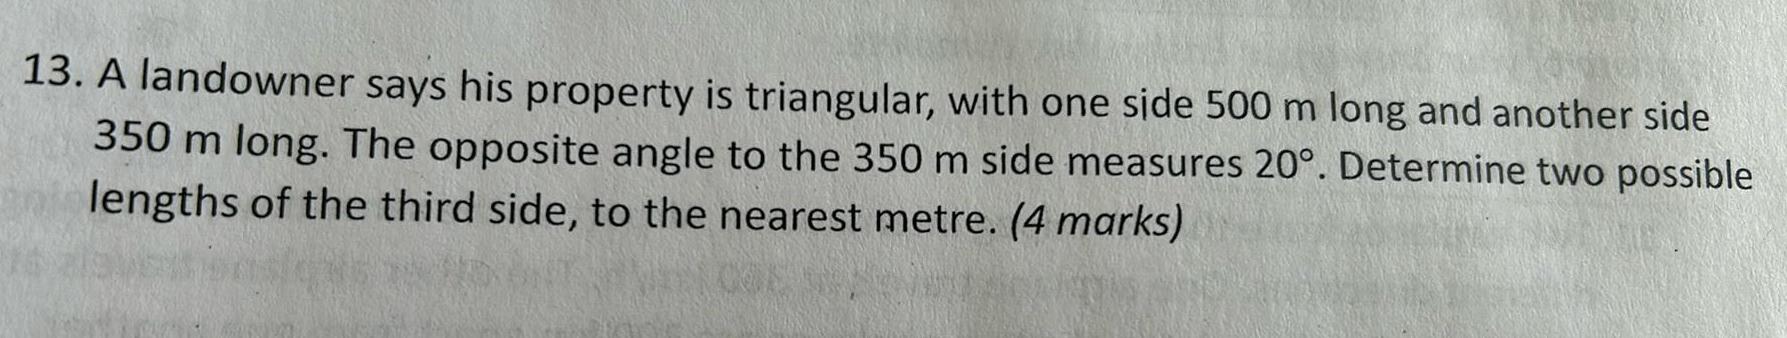
Differentiation13 A landowner says his property is triangular with one side 500 m long and another side 350 m long The opposite angle to the 350 m side measures 20 Determine two possible lengths of the third side to the nearest metre 4 marks

College Algebra
Matrices & Determinantsuppose A B are two m n matrices there are two square matrices C and D so that A BC and B AD Prove that there is an invertible matrix M so that B AM

Biology
Plant Physiology - GeneralPathway Sample Organisms Electron Carrier Used in the Pathway Initial Carbon Compound Net Yield carbon red carriers ATP EMP 4 ED PP 13 3 When we discussed the ELVIS case study we learned that the microbes broke polyurethane down into citrate for entry into central metabol dropping into central metabolism as citrate or catechols etc for toluene degradation impact the overall energy yield for the cell

Biology
Human Physiology - Breathing & Exchange of GasesHow does the removal of CO2 correlate to the reduction of electron carriers

Biology
Biological ClassificationHHMI Biointeractive Winogradsky Columns 2 How do Winogradsky Columns illustrate the diversity microorganisms on Earth and the niches they occupy How do they reflect life on early Earth

Biology
Plant Physiology - RespirationLive Describe the distribution of oxygen and its metabolic roles throughout asky In what region s does Sulfur cycling play a critical role What types of sulfur metabolism is involved Purple Sulfur PSB and Green Sulfur Bacteria GSB both use sulfide to support photosynthesis GSB tolerate higher sulfide levels than PSB How does that tolerance relate to where they congregate in the column Where would you predict to find PSB and

High School Calculus
Limits & Continuity15 What are all values of x for which the function f defined by f x x 32 9x 7 is increasing A x 3 or x 1 B x 1 or x 3 C 3 x 1 D 1 x 1

Biology
Animal KingdomSelect all of the following that apply to the body wall muscles in nematodes arranged in quadrants are molted in pre adult life history stages contract longitudinally only circular muscles lie beneath the hypodermis