Questions
The best high school and college tutors are just a click away, 24×7! Pick a subject, ask a question, and get a detailed, handwritten solution personalized for you in minutes. We cover Math, Physics, Chemistry & Biology.

College Math - Others
Basic Math4 Playing a game with a pair of dice you win 5 if you roll a 7 or an 11 and you pay 2 if you roll anything else Initially you pay nothing to roll the dice What is the expected value of this game Expected Value S

College Math - Others
Mathematical Induction1 3 Playing a game with a pair of dice you win 2 if you roll a 7 or an 11 You pay 5 to roll the dice each time What is the expected value of this game

College Math - Others
Basic MathThere is a game with bottles set up at a carnival There are a total of 15 colored bottles with either the word WIN or the word LOSE printed on the bottom 4 bottles are marked WIN and 11 bottles are marked LOSE The ticket cost for this game is 2 The rule is that the person places a ring around there selected bottle If the bottle has the word WIN on the bottom the player wins 8 What is the expected payoff for a player

High School Algebra
Quadratic equations8 Compare the function g x modeled by the graph and the function f x 2x 21 3 True or false Explain a f x has a greater y intercept b g 1 f 1 c f x increases at a faster rate than g x over interval 0 3

College Statistics
StatisticsStudents estimated the length of one minute without reference to a watch or clock and the times seconds are listed below Assume that a simple random sample ha been selected Use a 0 05 significance level to test the claim that these times are from a population with a mean equal to 60 seconds Does it appear that students ar reasonably good at estimating one minute 70 81 40 67 47 65 8f 66 41 70 97 28 22 59 63 90 65 99 Perform the test assuming that the requirements are met Identify the null and alternative hypotheses Ho H Type integers or decimals Do not round

High School Algebra
Sequences & Series1 Graph both functions to find the solution s to the system 2x 2 f x g x x 2x 3 4 tonify the relative minim 22 3 6543 21 2 66 4 3 2 1 2 44443 2345

College Statistics
StatisticsStudents estimated the length of one minute without reference to a watch or clock and the times seconds are listed below Assume that a simple random sample has been selected Use a 0 10 significance level to test the claim that these times are from a population with a mean equal to 60 seconds Does it appear that students are reasonably good at estimating one minute 68 859 1 865 8880 81 39 66 42 21 59 63 67 47 65 68 98 92 66 222 Perform the test assuming that the requirements are met Identify the null and alternative hypotheses Ho H Type integers or decimals Do not round


High School Algebra
Quadratic equations4 Identify the relative minimum and relative maximum values over the interval 2 2 5 4 3 2 3 feat


High School Algebra
Quadratic equations2 Graph the functions on the same coordinate pian f x x 2 g x x 4 What are the solutions to the equation f x g x 6 5 4 3 654 5 32 3 2 1 2 1 1234 4 5 72374 1 2


High School Algebra
Complex numbers3 Is the function is even odd or neither How do you know 6 The d The and 2

High School Algebra
Sequences & Seriesinterval 10 201 7 The function f x equals the number of feet above sea level a rock climber is at x minutes After 45 minutes the climber reaches his maximum height of 800ft above sea level He stays on the mountain for 2 hours What is the practical domain of f x

High School Math - Others
Basic Math11 Find w to find the measure of the exterior angle 13 Find mZH W 68 6x 1 H 126 F G 5x 17 12 Find x to find the measure of the remote interior angle 46 134 14 Determine the measure of the indicated exterior angle in the diagram 3x 4 15 Match each angle with its corresponding measure given m21 130 and m 7 70 Indicate a match by writing the letter for the angle on the line in front of the corresponding angle measure A mz2 B m23 C m24 D m25 E mZ6 50 60 70 110 120 16 The map of France commonly used in the 1600s was significantly revised as a result of a triangulation survey The diagram shows part of the survey map Use the diagram to find the measure of ZKMJ Note that ZKMJ ZNKM LA ROCHELLE 104 Rochefort 88 48 M N

High School Math - Others
Basic Math4 A polygon has an interior angle sum of 3060 How many sides must the polygon have 3080 5 Two of the angles in a triangle measure 50 and 27 Find the measure of the third angle Solve for the unknown angle measures of the polygon 6 A pentagon has angle measures of 100 105 110 and 115 Find the fifth angle measure 116 7 The measures of 13 angles of a 14 gon add up to 2014 Find the fourteenth angle measure 8 Determine the unknown angle measures for the quadrilateral in the diagram 9 The cross section of a beehive reveals it is made of regular hexagons What is the measure of each angle in the regular hexagon 22

Anatomy and Physiology
Introduction to Physiologyressure in the aorta is greater than pressure in the pulmonary trunk therefore the left ventricle has to generate a greater pressure than the righ entricle in order to eject blood from the heart True False

Anatomy and Physiology
Introduction to PhysiologyWhich artery is commonly used to record blood pressure Obrachial artery O axillary artery O ulnar artery O radial artery

Anatomy and Physiology
CirculationA C E D B he above figure represents an electrocardiogram or ECG Use this figure to answer the following questions a Which ECG component A B C D or E represents the time required for the electrical impulse to travel f the AV node b Does the ECG provide information on valve function YES or NO

High School Geometry
2D GeometryFind the measure of the arc or central angle indicated Assume that lines which appear to be diameters are actual diameters Do not include units in your answer degrees degree symbols etc FR 60

High School Geometry
AreaFind the area of each circle Use 3 14 for the value of pi Round your answer 1 poin to the nearest tenth Do NOT include units in your answer ie ft in km etc FR 2 in

High School Geometry
2D GeometryFind the area of each Round to the nearest tenth Do not include units in your answer ie ft in km etc triangle FR 3 m 5 9 m

Biology
Animal KingdomListen B Match the following pictures to the basic forms of bird wings V High speed wings 1 C Elliptical wings 2 D 3 B Passive soaring wings 4 A Active soaring wings C

High School Geometry
AreaFind the area of each Round to the nearest tenth Do not include units ie ft in km etc square FR 15 8 m 15 8 m 15 8 m 15 8 m

High School Geometry
AreaFind the area of each regular polygon Round your answer to the nearest tenth apothem and picture provided FR 9 6 14

Biology
Animal KingdomSelect which characteristics fit into the categories of Amniotes or early tetrapod ancestors more permeable skin more keratinized skin 1 Amniotes 2 Early tetrapod ancestor drawing air into lungs pushing air from cavities into lungs


Biology
Animal KingdomAOTD What advantage did subdividing the gas bladders into smaller sacs provide for tetrapods Reduced surface area for gas exchange Enhanced ability to breathe underwater Increased buoyancy Increased surface area for gas exchange

College Statistics
ProbabilityYou may need to use the appropriate appendix table or technology to answer this question How large a sample should be selected to provide a 95 confidence interval with a margin of error of 10 Assume that the population standard deviation is 60 Round your answer up to the nearest whole numb X 138

College Math - Others
Basic MathFind a function of the form y A sin kx C or y A cos kx C whose graph matches the functio shown below 8 6 2 1 3 2 1 2 3 Leave your answer in exact form if necessary type pi for y

College Math - Others
Trigonometry5 4 3 1 4 The curve above is the graph of a sinusoidal function It goes through the points 5 0 and 1 0 Find a sinusoidal function that matches the given graph If needed you can enter 3 1416 as pi in your answer otherwise use at least 3 decimal digits f x
College Math - Others
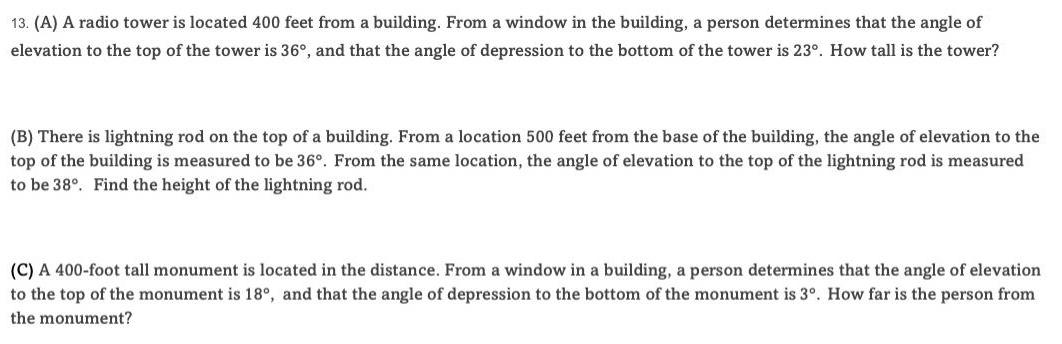
Trigonometric equations13 A A radio tower is located 400 feet from a building From a window in the building a person determines that the angle of elevation to the top of the tower is 36 and that the angle of depression to the bottom of the tower is 23 How tall is the tower B There is lightning rod on the top of a building From a location 500 feet from the base of the building the angle of elevation to the top of the building is measured to be 36 From the same location the angle of elevation to the top of the lightning rod is measured to be 38 Find the height of the lightning rod C A 400 foot tall monument is located in the distance From a window in a building a person determines that the angle of elevation to the top of the monument is 18 and that the angle of depression to the bottom of the monument is 3 How far is the person from the monument


College Math - Others
Basic MathMacmillan Learning A student measured the lead content of a paint sample 5 times The standard deviation of the measure 0 73 of the average Calculate the confidence interval at the 90 confidence level 0 80 confidence interval Incorrect Can this student be 90 confident that the true value is within 0 80 of the measured average no yes

High School Calculus
Application of derivativesLet A x represent the area bounded by the graph the horizontal axis and the vertical lines at t O and t X for the graph below Evaluate A x for x 1 2 3 and 4 5 4 3 2 1 A 1 A 2 A 3 A 4 2 3 5

College Geometry
Coordinate systemFind the circulation and the flux of the field F xi y j around and across the following curves a The circle r t cos t i sin t j 0 t 2 b The ellipse r t cos t i 2 sin t j 0 t 2 a The circulation of F around the circle is Type an exact answer

College Math - Others
Basic Mathlest a claim about a population mean based on a sample Project Use a 0 05 level of significance to identify which automobile tire manufacturer should be awarded the New Jersey State Police tire contract The New Jersey State Police Department is interested in tires for its squad cars These tires must satisfy the specification that the average Mean life of the tire must be at least 80 000 miles and the standard deviation must be at most 250 miles 5 3217 Six different tire makers Tire Tire Tire Tire Tire and Tire sent the automaker several tires to be tested The identities of the tire manufacturers remain anonymous to guarantee a non prejudicial test The tires were placed on the drive wheels of various squad cars and driven until the tires were worn down The following data shows the mileage the tires traveled before they had to be replaced Data price miles Tire 178 99 79 920 80 100 79 800 79 600 Tire 182 95 79 900 80 100 80 200 79 950 79 975 80 000 Tire 186 99 79 950 80 250 79 975 80 300 79 990 80 150 80 225 79 900 Tire 192 99 78 600 79 700 79 650 80 750 Tire 196 95 77 480 80 300 76 480 76 790 78 990 80 061 Tire 204 99 79 125 81 250 78 975 81 200 80 990 81 000 80 225 80 600 As the consultant to the New Jersey State Police determine which tire manufacturer if any gets the contract Write a report type preferred stating your recommendation for the awarding of this lucrative contract Your report must contain the following points I Hypothesis testing Show all steps for each hypothesis test Use single sample hypothesis testing following the format


College Algebra
Quadratic equationsUse the graphs to write the formula for a polynomial function of least degree a f x b g x 5 1 2 3 T 1 5 x f x g x Click on a graph to enlarge it

College Calculus
Definite IntegralsSet up the definite integral required to find the area of the region between the grap of y 19 2 and y 15x 73 over the interval 4 x 2 dx

College Calculus
Definite Integrals1 The graph of y f x is shown 5 3 2 H 1 2 3 2 3 4 5 6 7 8 P 9 The area of the region between the graph of y f x and the x axis over the interw 0 x 4 is 8 Express this area as a definite integral Part 2 o 40 H x 4 X da

College Calculus
Definite IntegralsThe graph of y f x is shown below 51 A 3 2 1 1 2 3 4 2 5 Evaluate 4 S dz So 9 f x dx f x dx 3 5 6 7 8 9 b
College Algebra
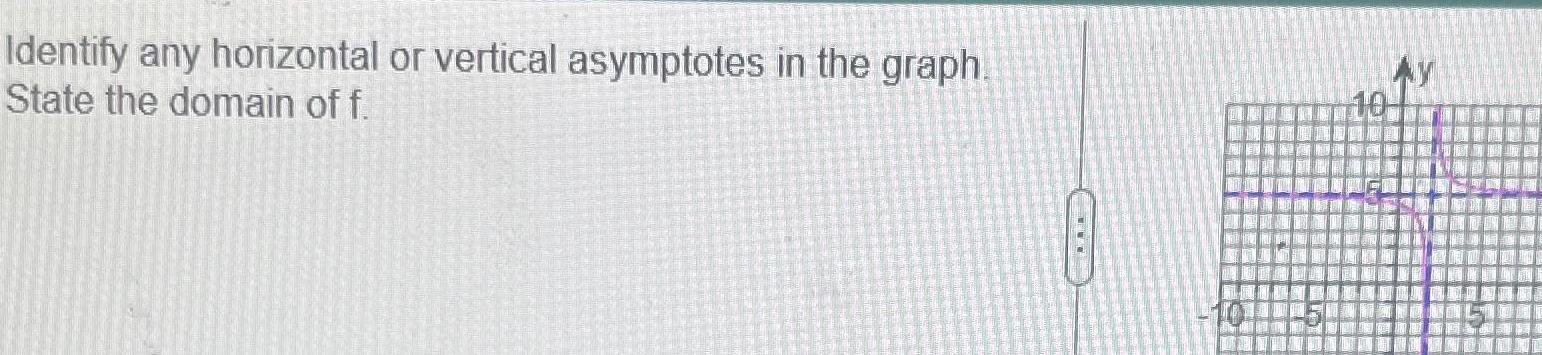
Quadratic equationsIdentify any horizontal or vertical asymptotes in the graph State the domain of f Ay

College Calculus
Definite IntegralsThe area of the region between the graph of y x x 6 and the x axis is


College Calculus
Definite IntegralsEvaluate 5x 6 y ds where C is given in the accompanying figure Sc 5x 6 y ds Type an exact answer using radicals as needed 1 0 0 y x Q 1 1 C y x

College Calculus
Definite IntegralsFind the line integral of f x y z x y z over the straight line segment from 5 3 1 to 4 1 3 x y 2 x y z ds Type an exact answer using radicals as needed

College Calculus
Definite IntegralsEvaluate xy dx x y dy along the curve y x from 3 9 to 1 1 C xy dx x y dy C dx x y dy Type an integer or a simplified fraction

College Calculus
Vector CalculusFind the flow of the velocity field F x y i x y j along each of the following paths from 1 0 to 1 0 in the xy plane a The upper half of the circle x y 1 b The line segment from 1 0 to 1 0 c The line segment from 1 0 to 0 1 followed by the line segment from 0 1 to 1 0 a The flow of the velocity field is Type an exact answer