Limits & Continuity Questions and Answers
Calculus
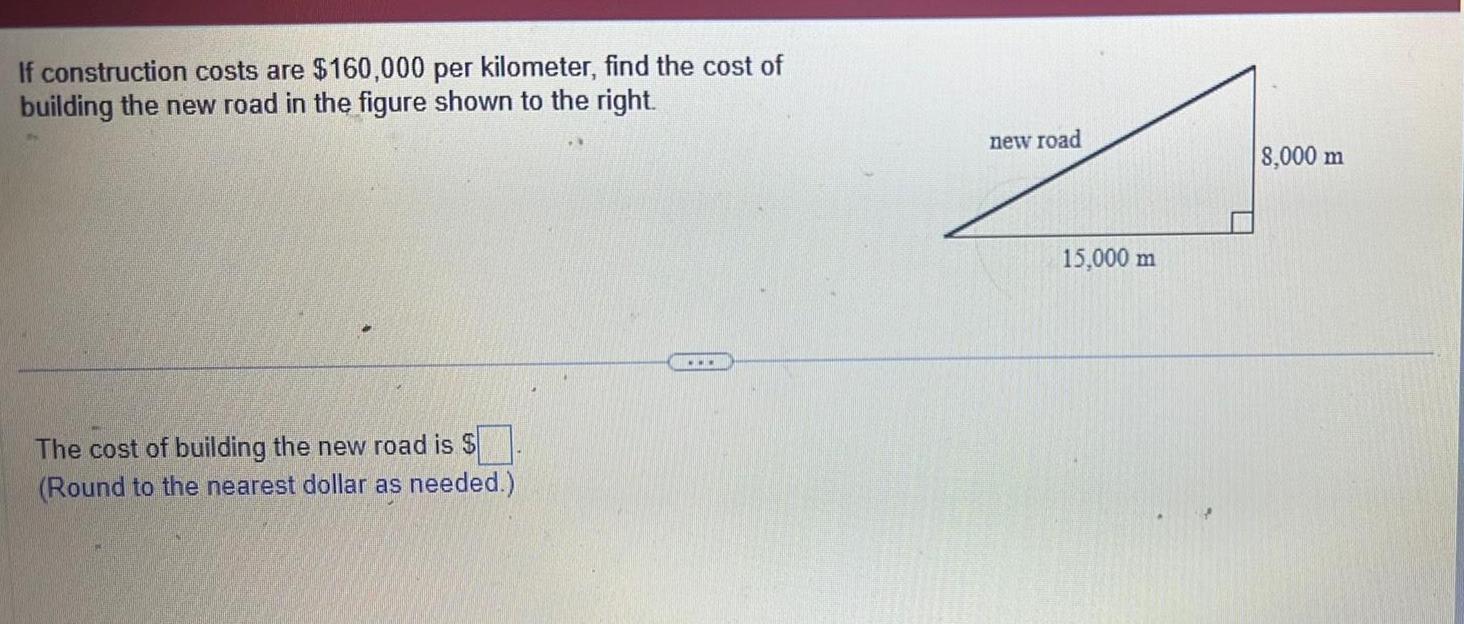
Limits & ContinuityIf construction costs are 160 000 per kilometer find the cost of building the new road in the figure shown to the right The cost of building the new road is Round to the nearest dollar as needed new road 15 000 m 8 000 m


Calculus
Limits & Continuityph the function f x 4x and draw the tangent lines to the graph at points whose x coordinates are 0 and 1 4 40 8 7 6 5 o 9 10 H 42 13 44 45 16 7

Calculus
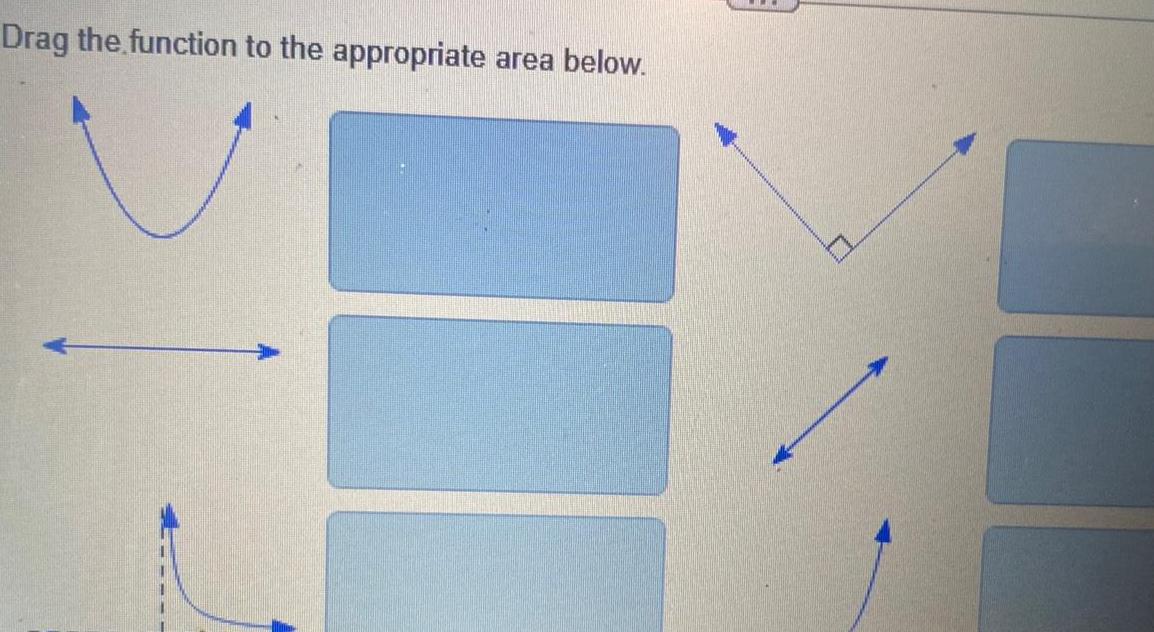
Limits & Continuityy 5 x y x 5 y x 5 y 5x y x 5 2 2 y x 5 y 5x 2 y 5 x y x 5 y x 5 y x 5 y x 5 Drag the function given above into the appropriate area below to ma Ay M Ay 0


Calculus
Limits & Continuity52 Let P x F x G x and Q x F x G x where F and G are the functions whose graphs are shown a Find P 2 b Find Q 7 1 0 G

Calculus
Limits & ContinuityOpen the picture named Number Line 1 and recreate the number line going from 3 on the far left to positive 3 on the far right Place the word mean in the center of your number line Now open the picture named Number Line 2 Notice how the calculation work is being shown for an example of show your work Notice that numbers are being placed at three spots going to the left and three to the right Your answer for each question below should include a drawn number line the numbers that would be on the number line at each point on the line three to the right and three to the left of the mean in center EXAMPLE showing detail work See pic Number Line 2 The mean of some data equals 100 units units of w e with a standard deviation of 6 units same w e Show your calculations for all six numbers on the number line three to the left and three to the right Right 100 6 106 106 6 112 112 6 118 Left 100 6 94 94 6 88 88 6 82 Here is the assignment Show detail work answering the two questions below Then create a number line for each question that represents your answer Hand in your detailed calculation work and the number lines Question 1 The mean of some data equals 98 liters with a standard deviation of 10 liters Show your calculations for all six numbers on the number line three to the left and three to the right of center Right Left Make sure and hand in a number line with your calculated results included on it just like the example 2 on next page Question 2 The mean of some data equals 18 6 pounds with a standard deviation of 1 1 pounds Show your calculations for all six numbers on the number line three to the left and three to the

Calculus
Limits & ContinuityChallenge yourself Domain Range x intercepts y intercept Increasing Interval s Decreasing Interval s LEB as x REB as x f x f x

Calculus
Limits & ContinuityQuestion 8 The figure below shows a function p x and its tangent line at the point B 4 7 3 If the point A on the tangent line is 3 66 3 312 fill in the blanks below to complete the statements about the function p at the point B p A BO

Calculus
Limits & ContinuityWestside Energy charges its electric customers a base rate of 7 00 per month plus 10 per kilowatt hour kWh for the first 300 kWh used and 3 per kWh for all usage over 300 kWh Suppose a customer uses x kWh of electricity in one mont a Express the monthly cost E as a piecewise defined function of x Assume E is measured in dollars if 0 x 300 E x b Graph the function E for 0 x 600 E 40 30 20 10 O E 40 30 20 10 if 300 x 100 200 300 400 500 100 600 X 200 300 400 500 600 E 40 30 20 10 E 70 60 50 40 30 20 10 O 100 X 200 300 400 500 600 100 200 X 300 400 500 600

Calculus
Limits & ContinuitySketch the graph of the function by first making a table of values If an answer is undefined enter UNDEFINED f x x X 0 4 3 2 1 Sketch the graph f x x 17 y 20 20 y

Calculus
Limits & ContinuityTo graph the function f we plot the points x f x To graph f x x 3 we plot the following points x 2x x 0 x 1 x x 3 x x 3 So the point 4 in a coordinate plane is on the graph of f The height of the graph of f above the x axis when x 4 is

Calculus
Limits & ContinuityA graph of a piecewise defined function is given y 5 4 f x if x 2 3 5 4 3 2 1 1 2 2 if x 2 1 if 2 x 2 3 4 5 Find a formula for the function in the indicated form 1 2 3 4 x 5

Calculus
Limits & Continuity3 12 pts Graph the following piecewise defined function Also what are the domain and range of this function f x x if 3 x 1 x if 1 x 4

Calculus
Limits & Continuity4 12 pts A graph of a piecewise defined function is shown Find a formula for its function rule and also describe the domain and range of this function S 3 2 5 12 5 S X

Calculus
Limits & ContinuityA company manufactures and sells shirts The daily profit the company makes depends on how many shirts they sell The profit in dollars when the company sells a shirts can be found using the function f x 10x 40 Find and interpret the given function values and determine an appropriate domain for the function
Calculus
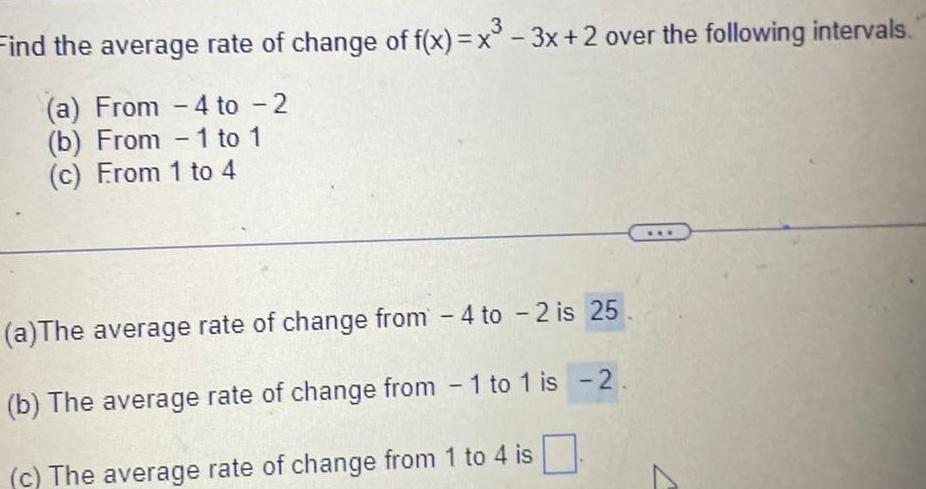
Limits & ContinuityFind the average rate of change of f x x 3x 2 over the following intervals a From 4 to 2 b From 1 to 1 c From 1 to 4 a The average rate of change from 4 to 2 is 25 b The average rate of change from 1 to 1 is 2 c The average rate of change from 1 to 4 is
Calculus
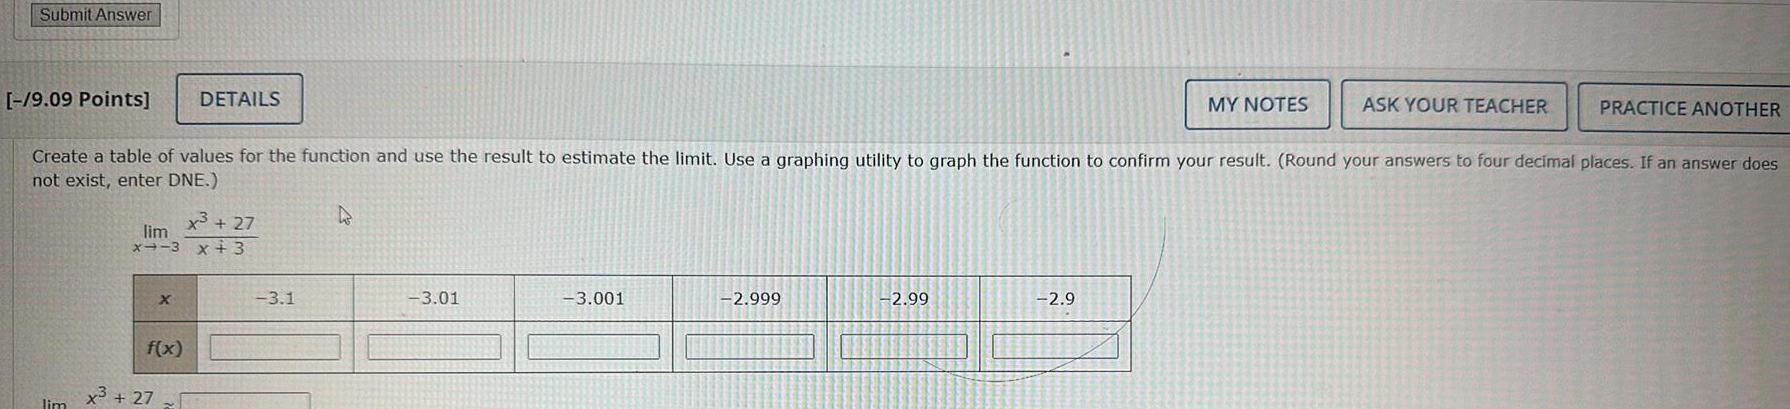
Limits & ContinuitySubmit Answer 9 09 Points Create a table of values for the function and use the result to estimate the limit Use a graphing utility to graph the function to confirm your result Round your answers to four decimal places If an answer does not exist enter DNE lim x 27 lim x 3 x 3 X f x DETAILS x 27 3 1 A 3 01 3 001 2 999 2 99 2 9 MY NOTES ASK YOUR TEACHER PRACTICE ANOTHER
Calculus
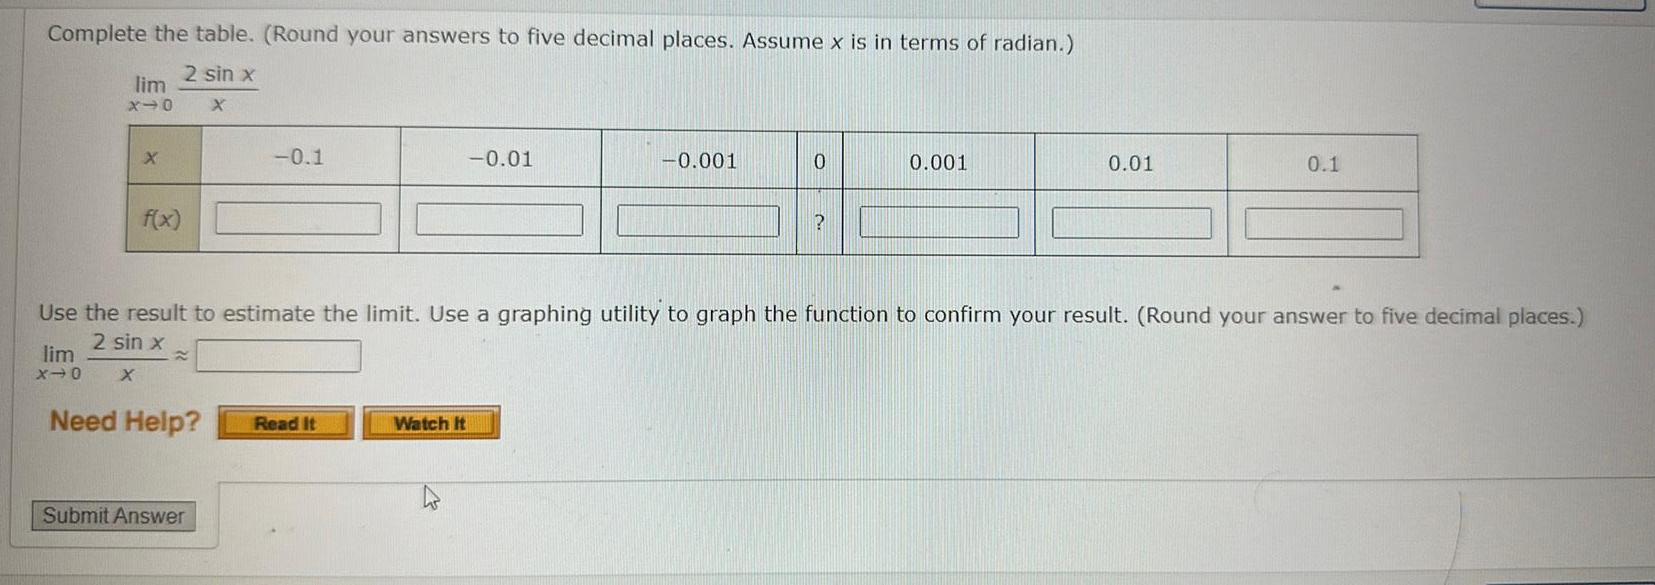
Limits & ContinuityComplete the table Round your answers to five decimal places Assume x is in terms of radian 2 sin x X lim X 0 lim X 0 X f x Need Help 0 1 Submit Answer Read It 0 01 Watch It 0 001 0 Use the result to estimate the limit Use a graphing utility to graph the function to confirm your result Round your answer to five decimal places 2 sin x X 0 001 0 01 0 1
Calculus
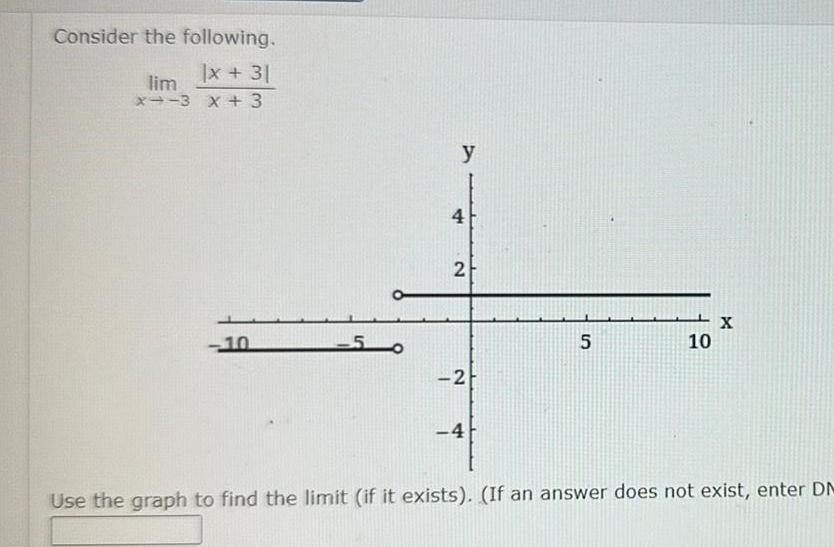
Limits & ContinuityConsider the following x 31 lim x 3 x 3 10 50 y 4 2 2 4 5 10 X Use the graph to find the limit if it exists If an answer does not exist enter DM
Calculus
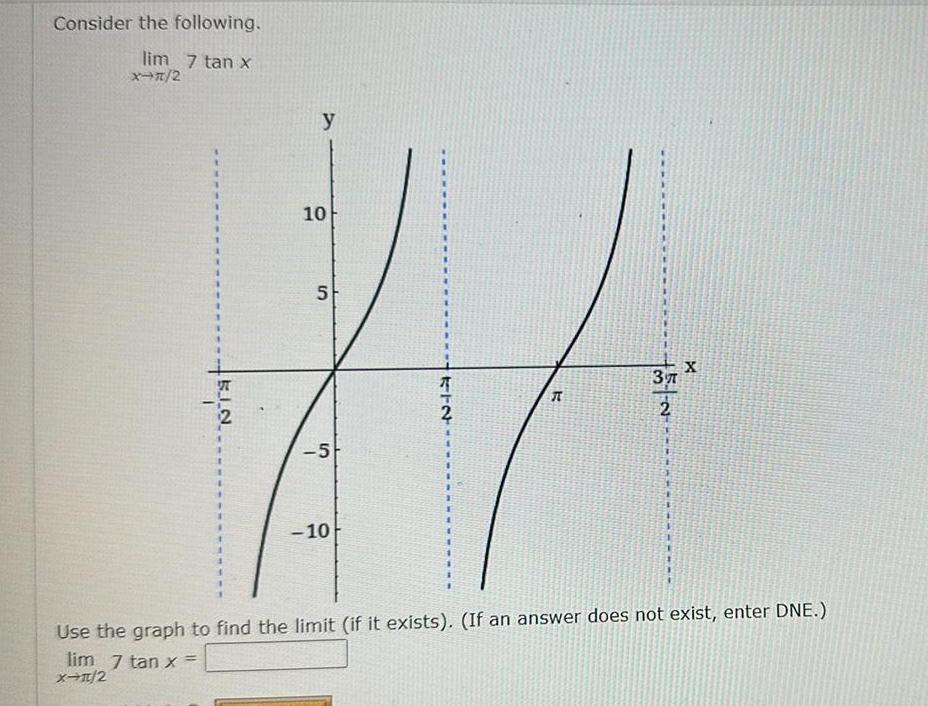
Limits & ContinuityConsider the following lim 7 tan x X 2 27 X 1 2 y 10 5 5 10 712 E 5 37 2 X Use the graph to find the limit if it exists If an answer does not exist enter DNE lim 7 tan x
Calculus
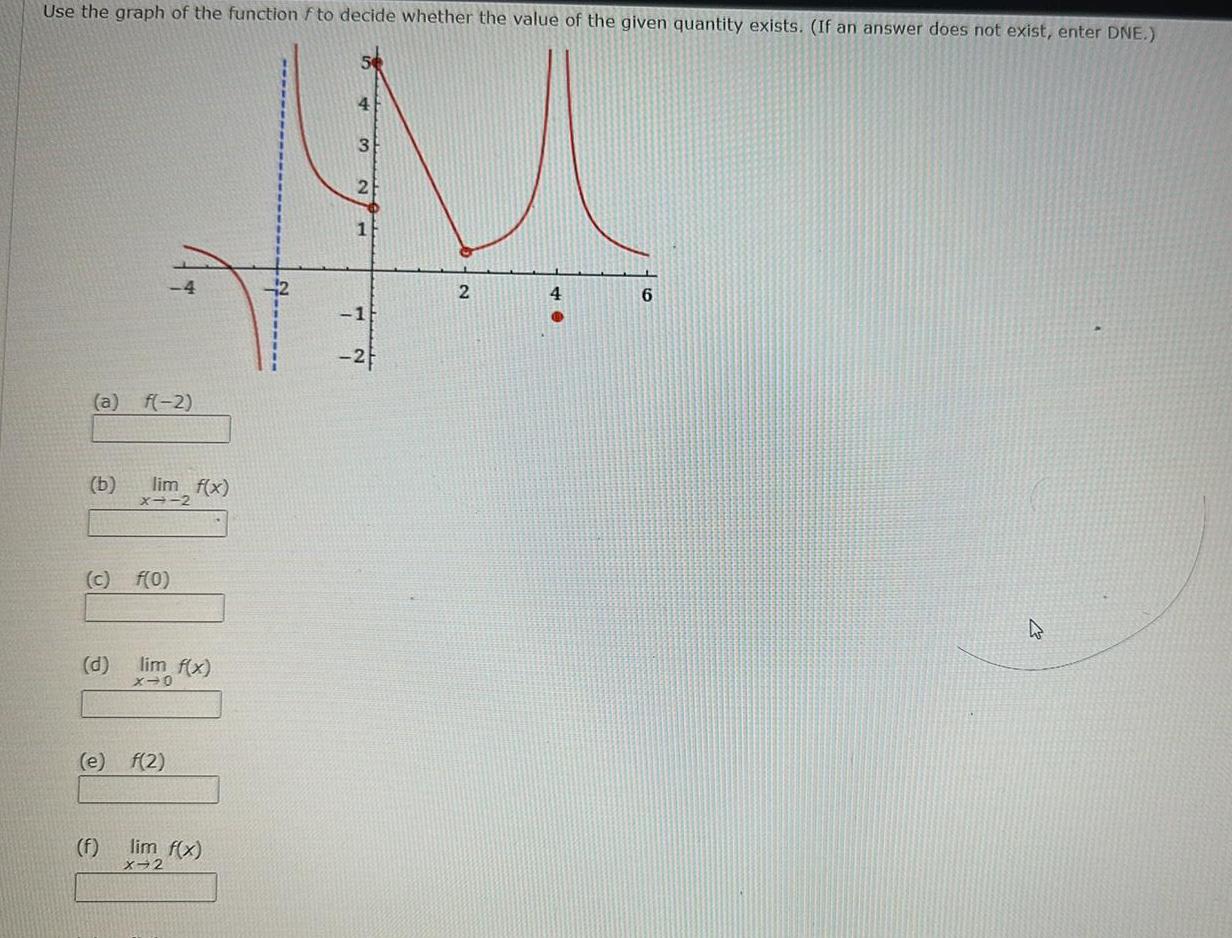
Limits & ContinuityUse the graph of the function f to decide whether the value of the given quantity exists If an answer does not exist enter DNE 4 M 2 1 2 a f 2 b d c f 0 4 lim f x f X 2 e f 2 lim f x X 0 lim f x X 2 1 2 6 2
Calculus
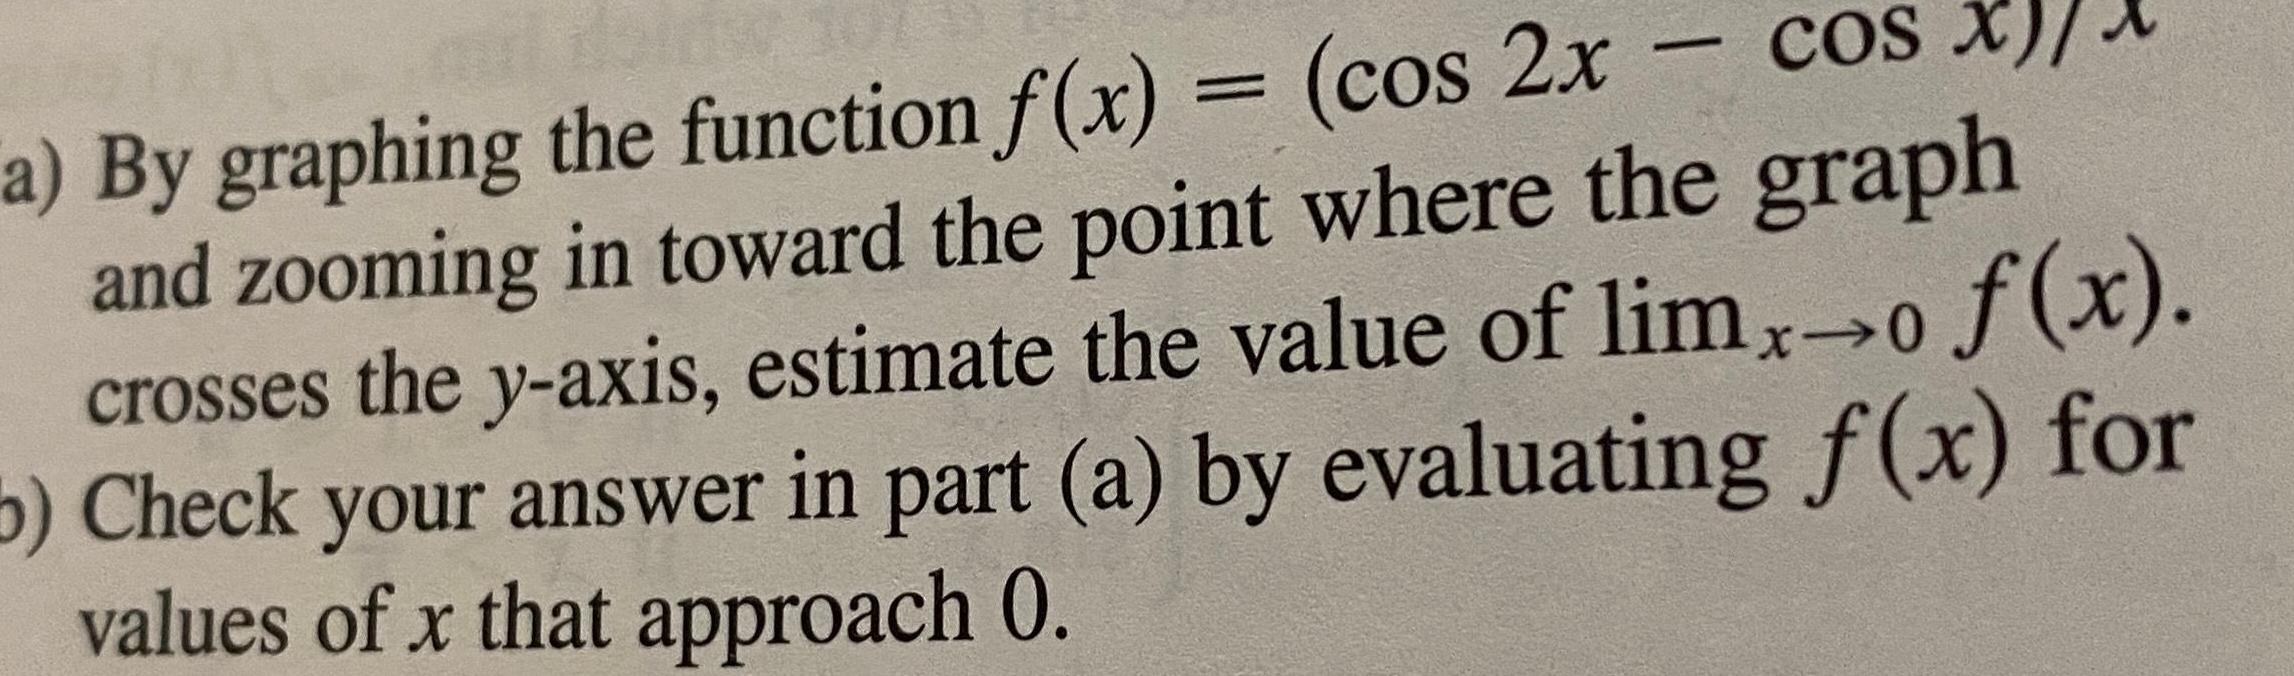
Limits & ContinuityCOS X a By graphing the function f x cos 2x and zooming in toward the point where the graph crosses the y axis estimate the value of limx o f x 5 Check your answer in part a by evaluating f x for values of x that approach 0
Calculus
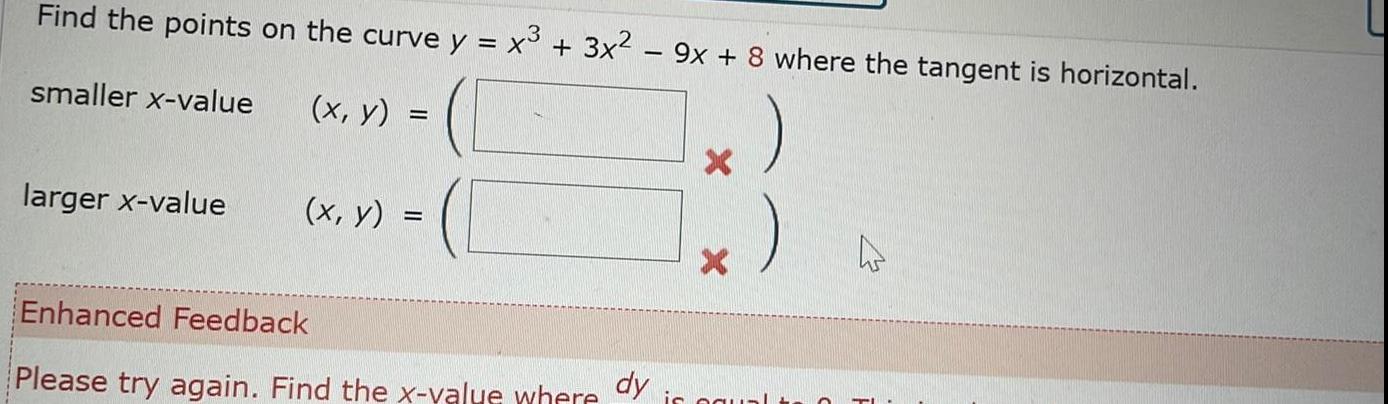
Limits & ContinuityFind the points on the curve y x 3x 9x 8 where the tangent is horizontal smaller x value x y larger x value x y Enhanced Feedback Please try again Find the x value where X dy is equa h
Calculus
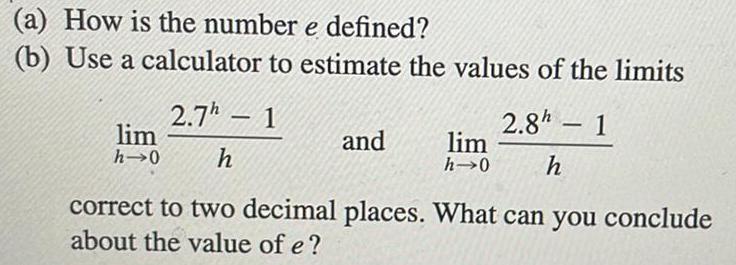
Limits & Continuitya How is the number e defined b Use a calculator to estimate the values of the limits 2 7h 1 lim h 0 h and lim h 0 2 8h 1 h correct to two decimal places What can you conclude about the value of e
Calculus
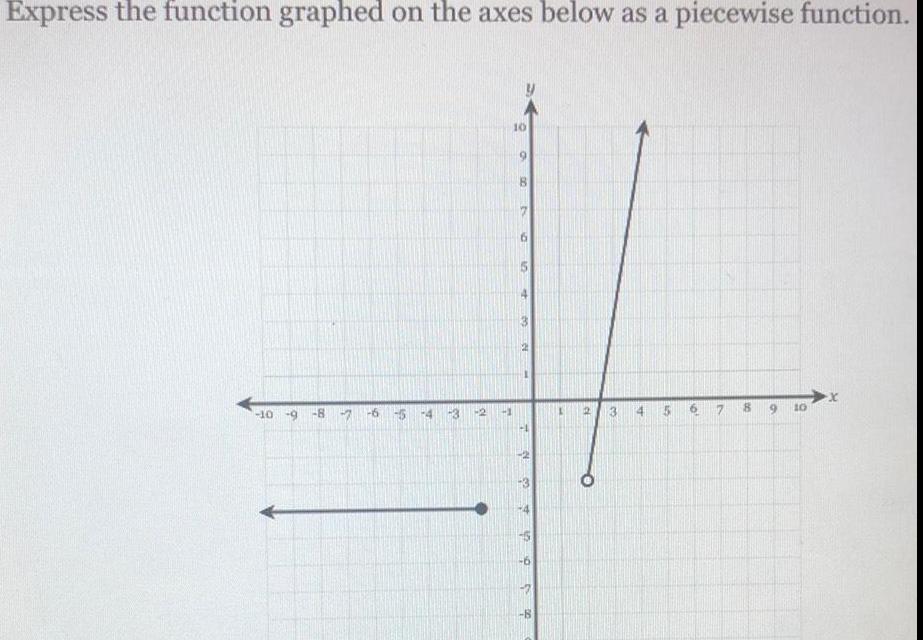
Limits & ContinuityExpress the function graphed on the axes below as a piecewise function 10 9 8 7 6 S T 8 15 4 10 6 00 P 10 t 45 7 35 8 15 O 3 MT 45 vo 7 8 9 10
Calculus
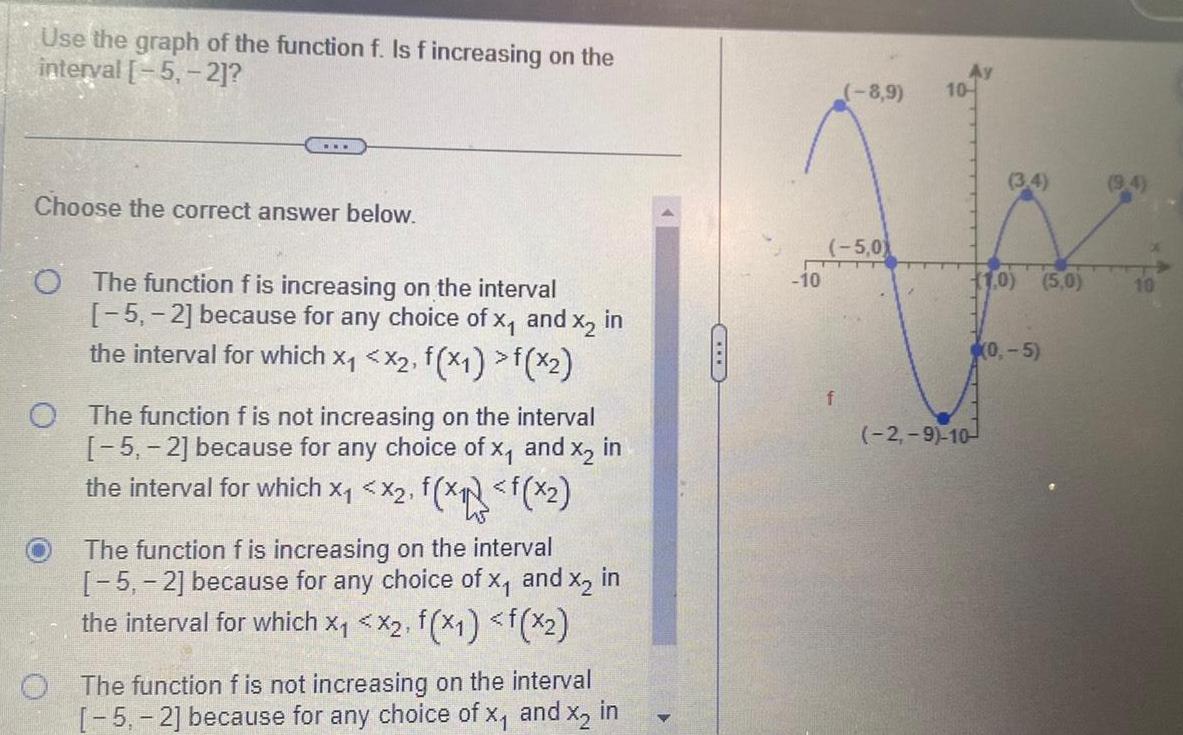
Limits & ContinuityUse the graph of the function f Is f increasing on the interval 5 2 Choose the correct answer below O The function f is increasing on the interval 5 2 because for any choice of X and x in the interval for which x x2 f x1 f x2 O The function f is not increasing on the interval 5 2 because for any choice of x and x2 in the interval for which X X2 f x f x The function f is increasing on the interval 5 2 because for any choice of x and x in the interval for which x x2 f x1 f x2 O The function f is not increasing on the interval 5 2 because for any choice of x and x in CIT 10 8 9 5 0 T f 10 3 4 1 0 2 9 10 0 5 5 0 10
Calculus
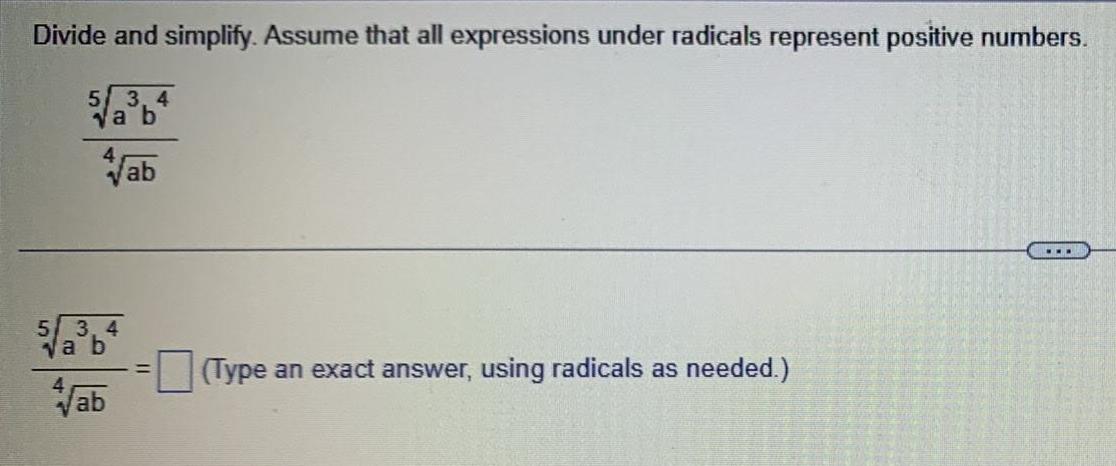
Limits & ContinuityDivide and simplify Assume that all expressions under radicals represent positive numbers 5 3 4 va b Vab 5 3 4 va b Vab Type an exact answer using radicals as needed
Calculus
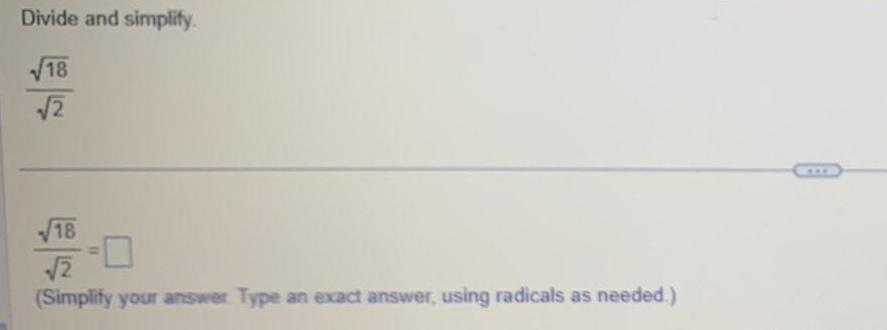
Limits & ContinuityDivide and simplify 18 2 18 2 Simplify your answer Type an exact answer using radicals as needed
Calculus
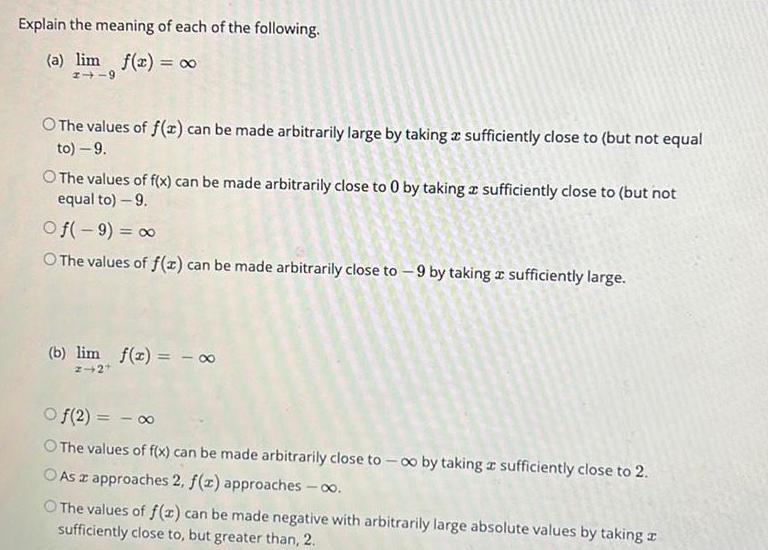
Limits & ContinuityExplain the meaning of each of the following a lim f x 1 9 O The values of f x can be made arbitrarily large by taking a sufficiently close to but not equal to 9 O The values of f x can be made arbitrarily close to 0 by taking a sufficiently close to but not equal to 9 Of 9 O The values of f x can be made arbitrarily close to 9 by taking a sufficiently large b lim f x 2 2 Of 2 O The values of f x can be made arbitrarily close to co by taking a sufficiently close to 2 O As a approaches 2 f z approaches O The values of f x can be made negative with arbitrarily large absolute values by taking sufficiently close to but greater than 2
Calculus
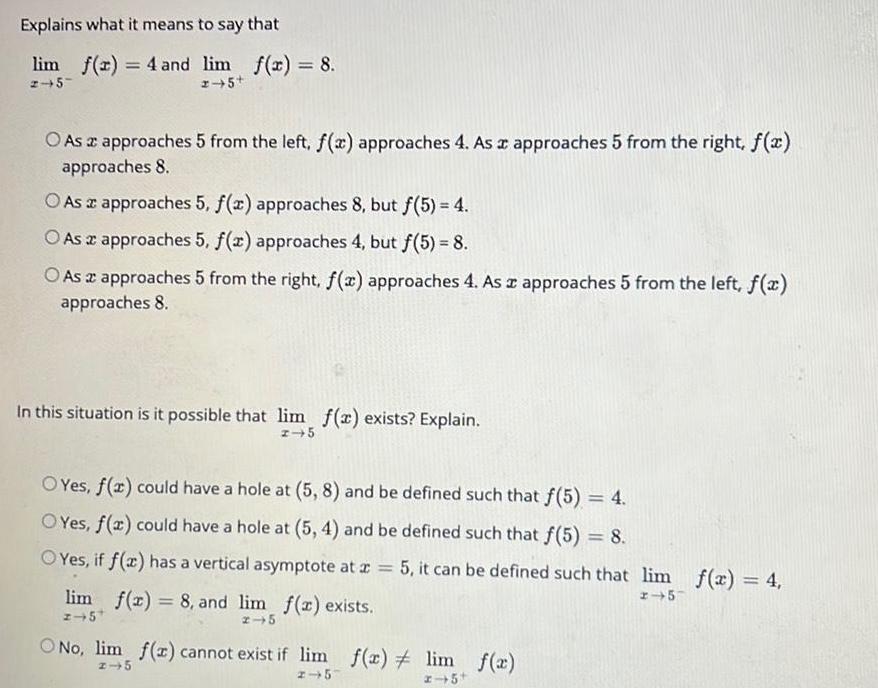
Limits & ContinuityExplains what it means to say that lim f x 4 and lim f x 8 2 5 2 5 O As a approaches 5 from the left f x approaches 4 As a approaches 5 from the right f x approaches 8 O As a approaches 5 f x approaches 8 but f 5 4 O As a approaches 5 f x approaches 4 but f 5 8 O As a approaches 5 from the right f x approaches 4 As a approaches 5 from the left f x approaches 8 In this situation is it possible that lim f x exists Explain z 5 OYes f x could have a hole at 5 8 and be defined such that f 5 4 O Yes f x could have a hole at 5 4 and be defined such that f 5 8 OYes if f x has a vertical asymptote at x 5 it can be defined such that lim f x 4 2 5 lim f x 8 and lim f x exists z 5 2 5 No lim f z cannot exist if lim f x lim f x 2 5 x 5
Calculus
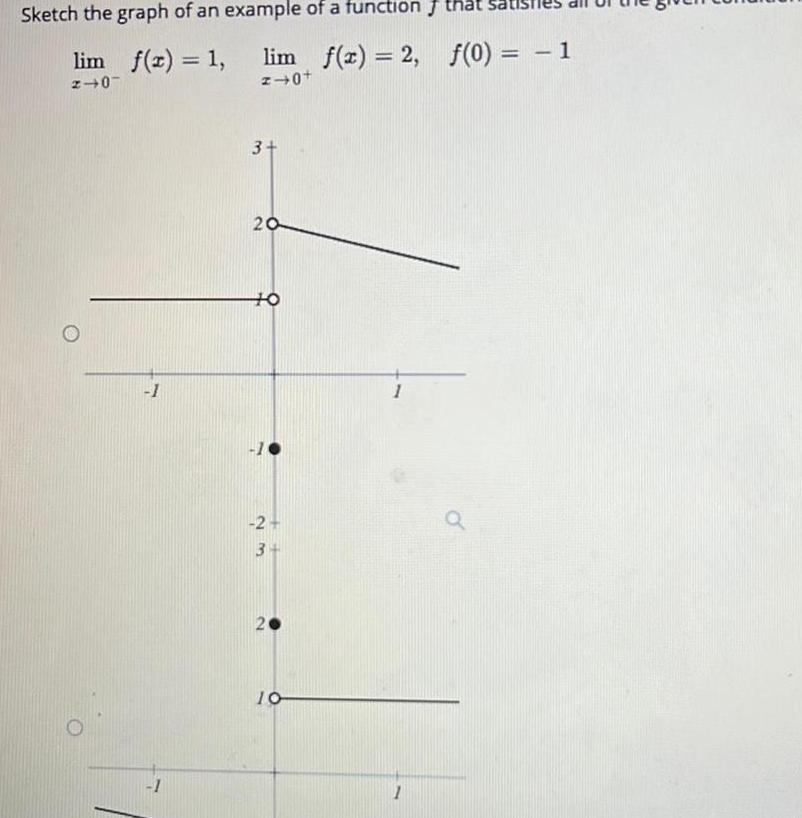
Limits & ContinuitySketch the graph of an example of a function lim f x 1 lim f x 2 2 0 z 0 3 20 TO 2 3 10 1 f 0 1
Calculus
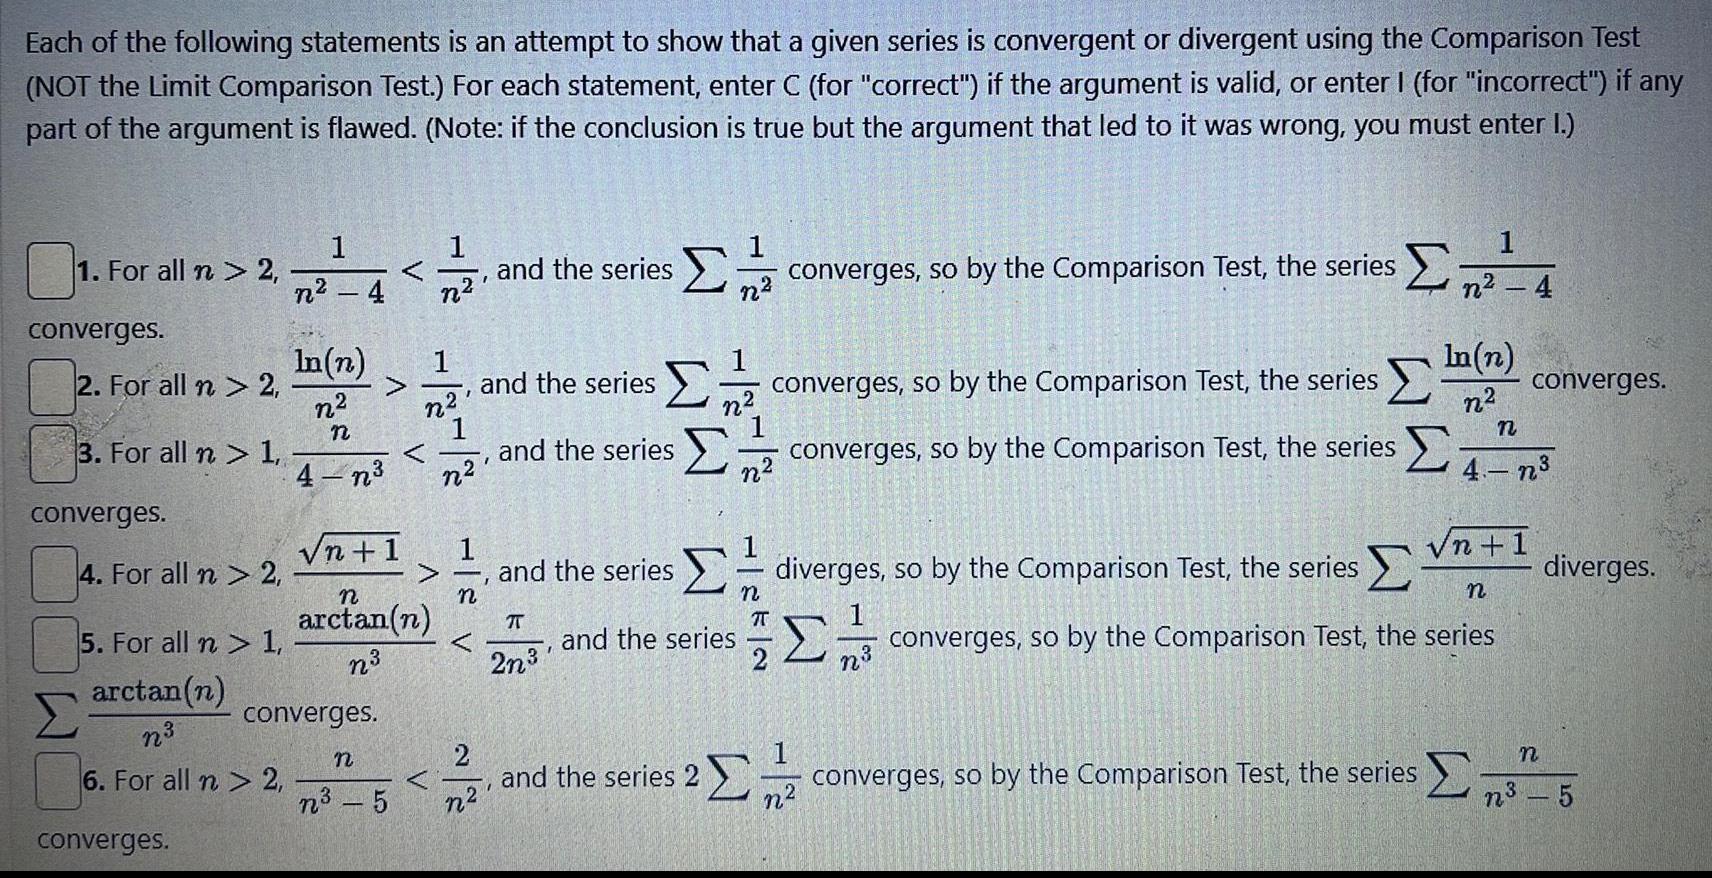
Limits & ContinuityEach of the following statements is an attempt to show that a given series is convergent or divergent using the Comparison Test NOT the Limit Comparison Test For each statement enter C for correct if the argument is valid or enter I for incorrect if any part of the argument is flawed Note if the conclusion is true but the argument that led to it was wrong you must enter I 1 For all n 2 converges 2 For all n 2 3 For all n 1 converges 4 For all n 2 5 For all n 1 arctan n n 6 For all n 2 converges 4 and the series converges so by the Comparison Test the series n In n n n 4 n n 1 converges n arctan n n n n 5 222 1 1 n 1 n 2 n2 and the series I and the series and the series 2n I n and the series and the series 2 n n T 2 converges so by the Comparison Test the series converges so by the Comparison Test the series diverges so by the Comparison Test the series 1 222 In n n n n 4 n n 1 n converges so by the Comparison Test the series converges converges so by the Comparison Test the series diverges n n2 5
Calculus
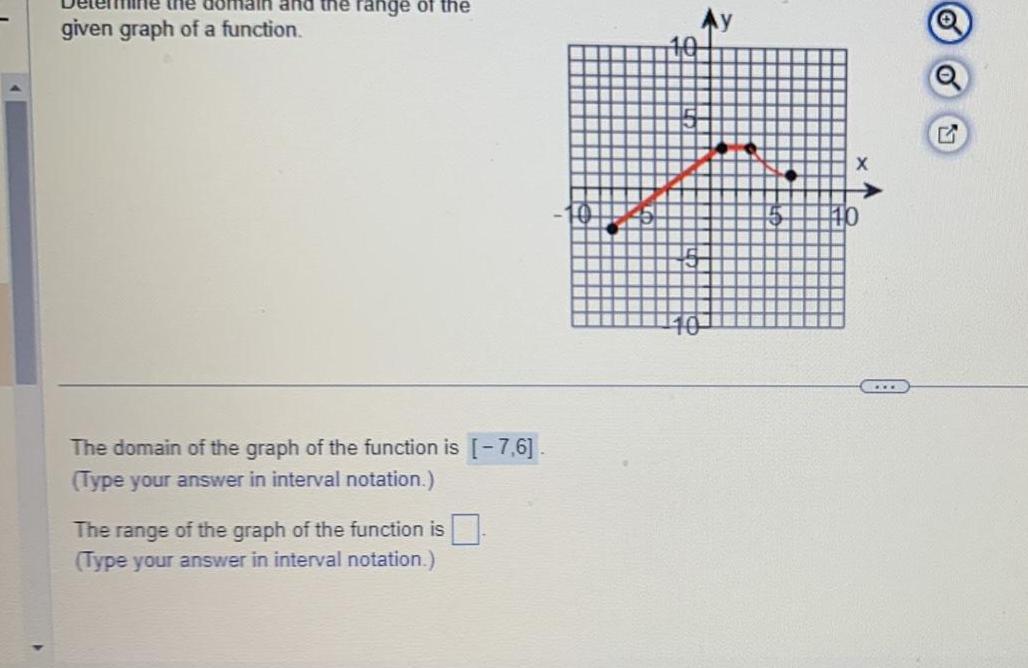
Limits & Continuitythe domain and the range of the given graph of a function The domain of the graph of the function is 7 6 Type your answer in interval notation The range of the graph of the function is Type your answer in interval notation COLS
Calculus
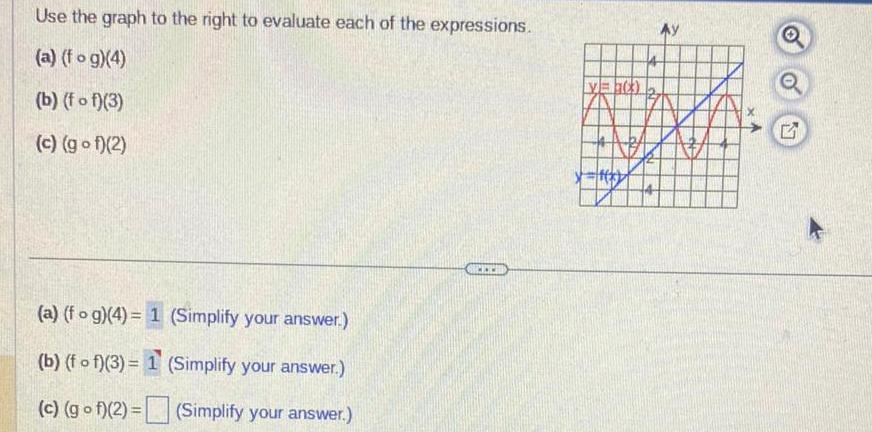
Limits & ContinuityUse the graph to the right to evaluate each of the expressions a fog 4 b fof 3 c gof 2 a fog 4 1 Simplify your answer b fof 3 1 Simplify your answer c gof 2 Simplify your answer 0 y x 47 ST Ay
Calculus
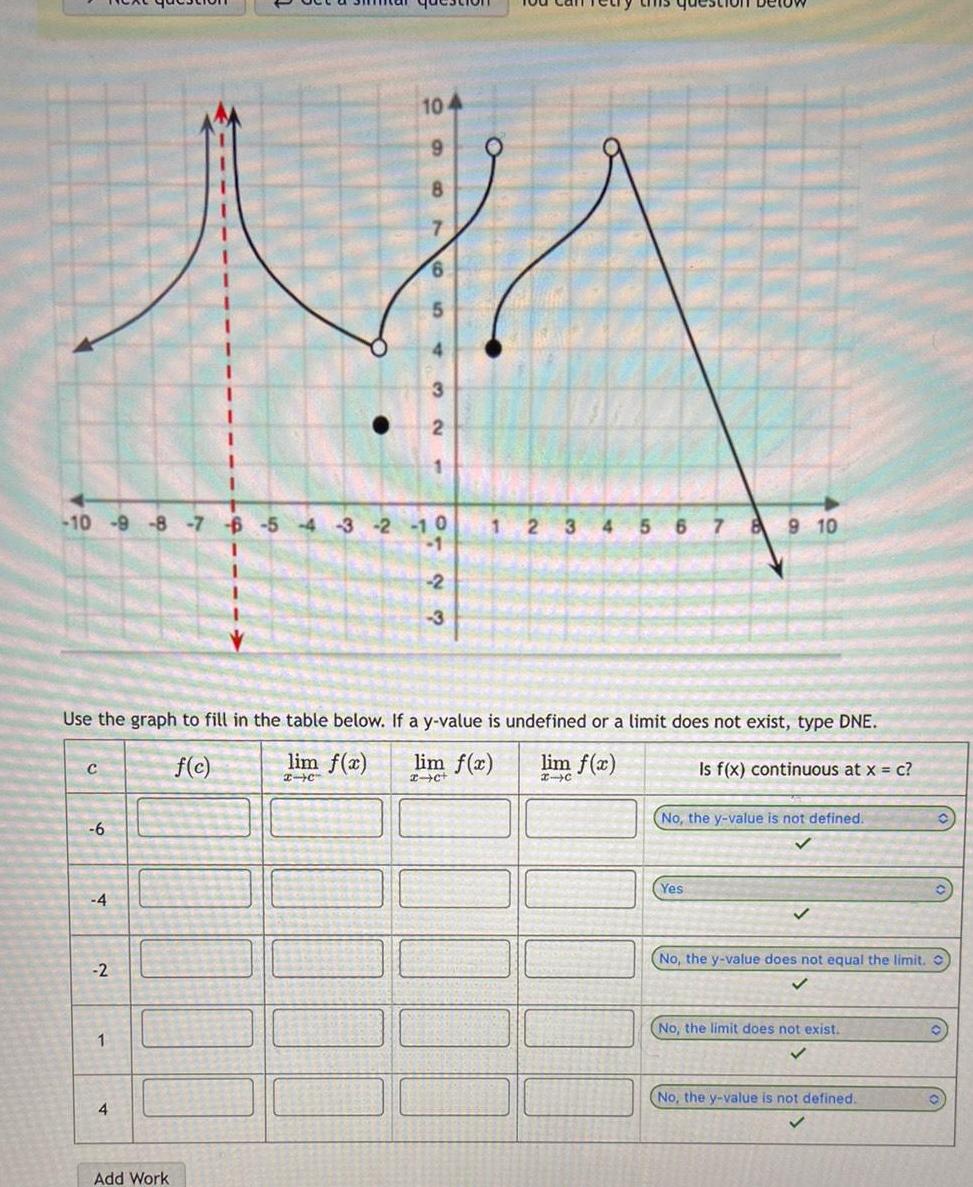
Limits & Continuity10 9 8 NA 6 10 9 8 7 6 5 4 3 2 10 1 2 1 C 6 4 2 Use the graph to fill in the table below If a y value is undefined or a limit does not exist type DNE lim f x lim f x f c lim I C 2 c 1 32 4 Add Work 3 3 4 5 6 7 8 9 10 Yes Is f x continuous at x c No the y value is not defined No the y value does not equal the limit No the limit does not exist No the y value is not defined O
Calculus
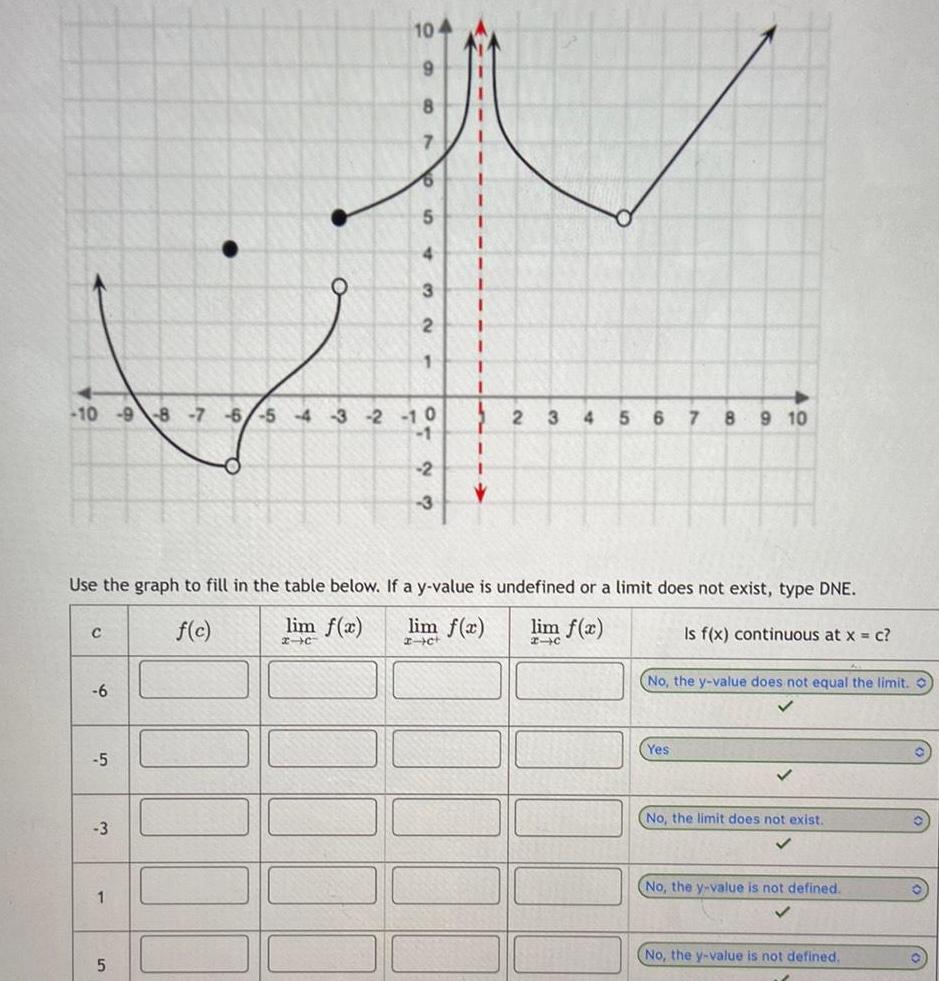
Limits & Continuity10 9 8 7 6 5 4 3 2 C 6 5 3 1 5 5 4 3 2 1 0 Use the graph to fill in the table below If a y value is undefined or a limit does not exist type DNE f c lim f x lim f x lim f x x c x c 2 3 1 2 3 4 5 6 7 8 9 10 Is f x continuous at x c No the y value does not equal the limit O Yes No the limit does not exist No the y value is not defined No the y value is not defined O 0
Calculus
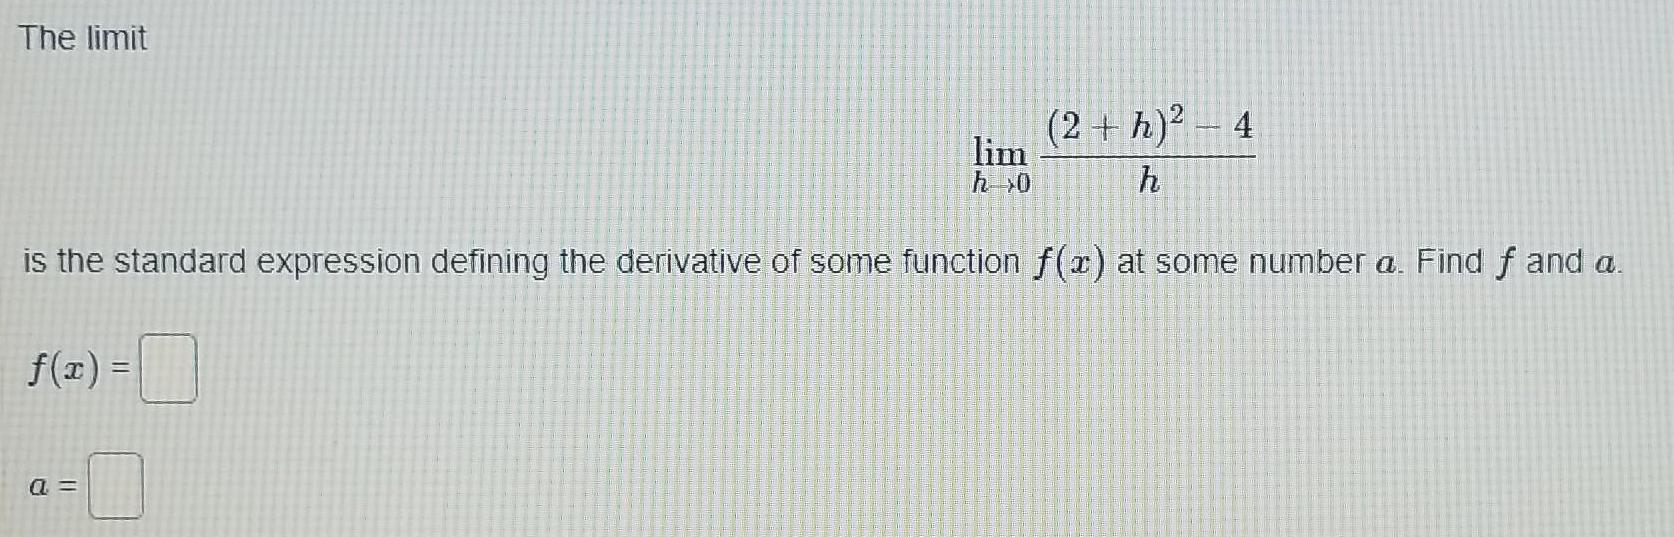
Limits & ContinuityThe limit 2 h 4 h is the standard expression defining the derivative of some function f x at some number a Find f and a f x a lim h 0
Calculus
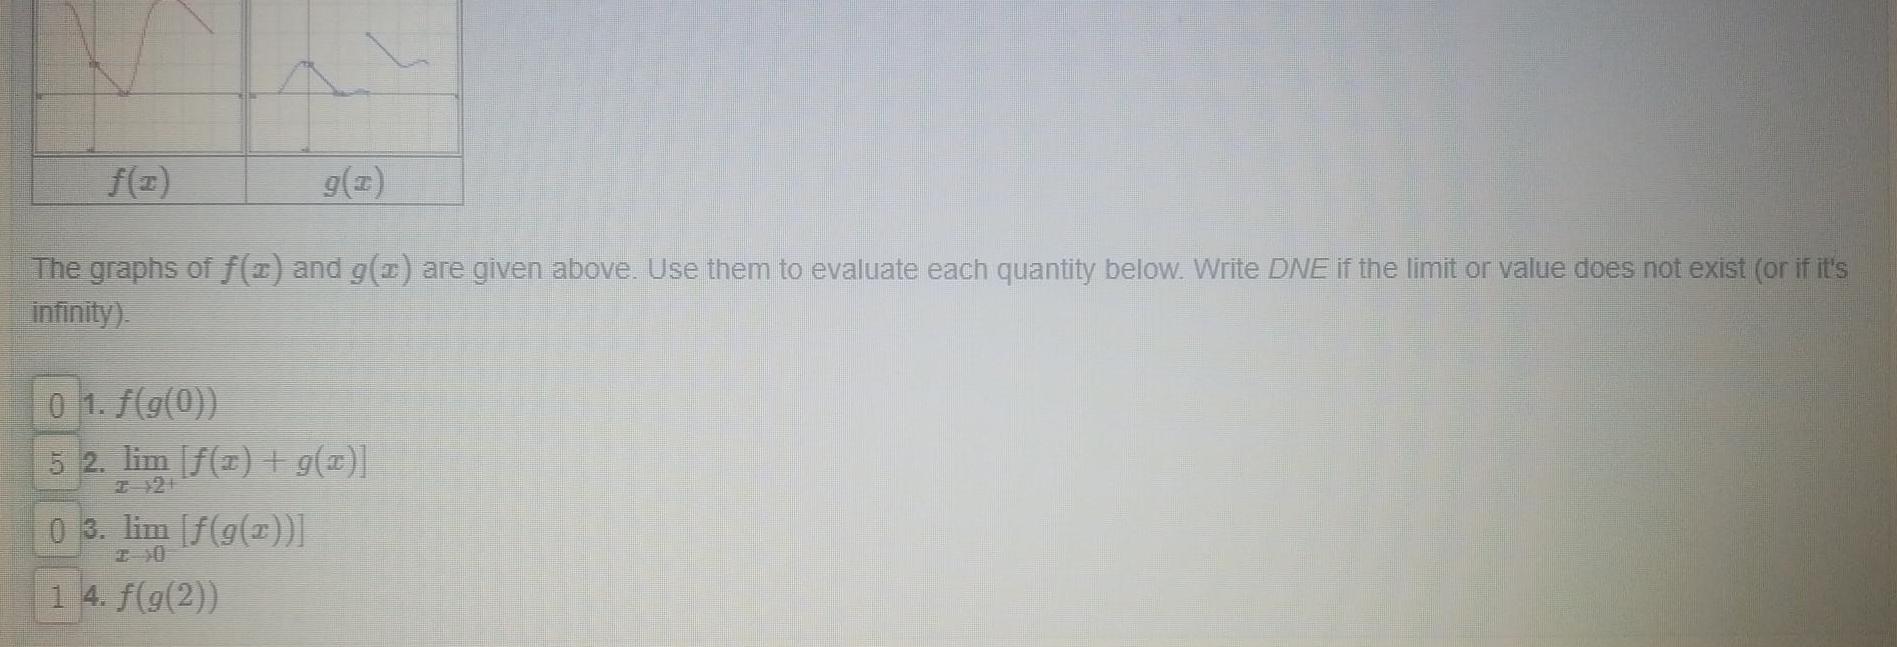
Limits & Continuityf x The graphs of f x and g x are given above Use them to evaluate each quantity below Write DNE if the limit or value does not exist or if it s infinity 01 f g 0 5 2 lim 1 g x 2 21 03 lim f g x 1 4 f g 2
Calculus
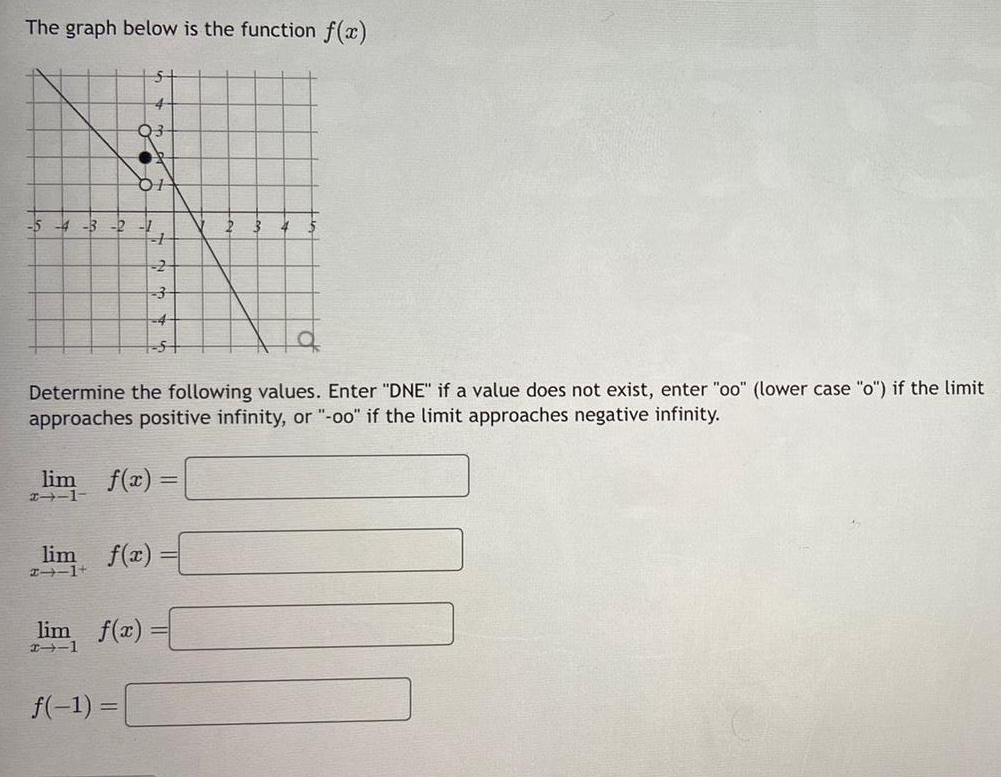
Limits & ContinuityThe graph below is the function f x 03 5 4 3 2 1 01 5 f 1 H lim f x 21 1 2 4 lim f x 111 lim f x Determine the following values Enter DNE if a value does not exist enter oo lower case o if the limit approaches positive infinity or oo if the limit approaches negative infinity 2 3 4

Calculus
Limits & ContinuityThe figure below shows the level curves of a function f x y around a maximum or minimum M The 2 and y axes are along the bottom and left edge of the figure respectively One of the points P and Q has coordinates 1 1 and the other has coordinates 22 2 Suppose b 0 and e 0 Consider the two linear approximations to f given by f x y a b z z1 c y v and a What is the relationship between the values of a and k Give your answer as an equation b What are the coordinates of P yl c Is M a maximum or a minimum minimum d What can you say about the sign of the constants m and n THE 0 and f x y k m z z2 n y

Calculus
Limits & ContinuityFind the critical points for the function and classify each as a local maximum local minimum saddle point or none of these critical points give your points as a comma separated list of x y coordinates classifications 4 give your answers in a comma separated list specifying maximum minim f x y 32xy x y

Calculus
Limits & ContinuityFor f x 3x 4 which of the following domain restrictions will allow f x to be invertible Select Which of the following is f x Select A B C x 4 3 x 4 3 x 4 3 D 1 x 4

Calculus
Limits & ContinuityClick here to begin Submit Answer 20 Points lim X 2 Evaluate the limit if it exists If an answer does not exist enter DNE 8x 4 x 2 Submit Answer DETAILS 20 Points SCALCET9 2 3 015 DETAILS SCALCET9 2 3 029 Evaluate the limit if it exists If an answer does not exist enter DNE

Calculus
Limits & Continuity3 2 4 Ex 1 pp63 64 YA 6 5 2 3 4 y f x 5 6 X 1 2 3 4 5 6 7 8 9 Domain Range Function f 1 f 2 f 3 lim f x lim f x lim f x X 2 10 lim f x X 3

Calculus
Limits & ContinuityInstantaneous velocity Consider the position function t 1612 100t Complete the following table with the appropriate average velocities Then make a conjecture about th value of the instantaneous velocity at t 3 Time interval Average velocity 2 3 2 9 3 2 99 3 2 999 3 2 9999 3