Vector Calculus Questions and Answers
Calculus
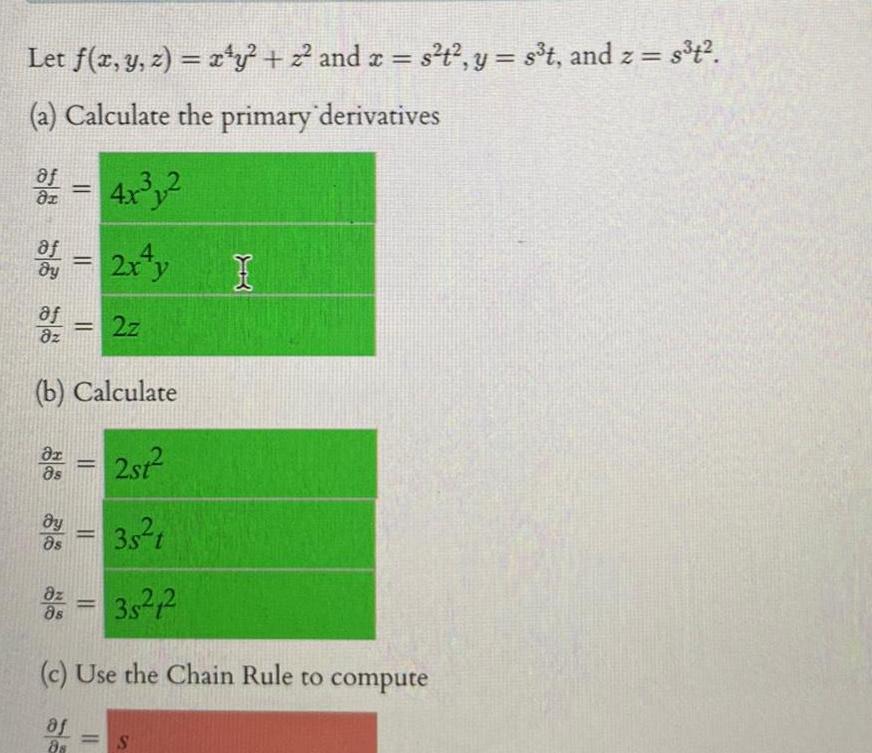
Vector CalculusLet f x y z x y 2 and x s t y s t and z s t a Calculate the primary derivatives 3 4x y 2 dy af 2x y b Calculate dr 2st 2 as y as 2z 3s t 8 35 1 dz 8s c Use the Chain Rule to compute af 88 I S
Calculus
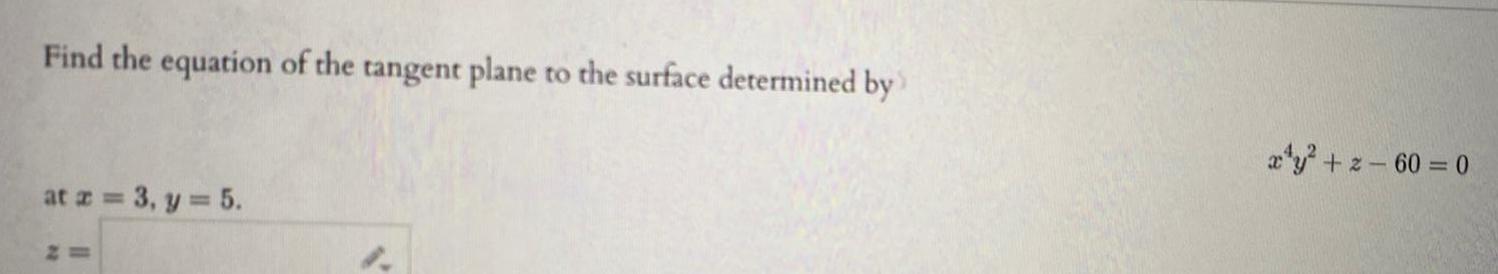
Vector CalculusFind the equation of the tangent plane to the surface determined by at z 3 y 5 1 x y z 60 0
Calculus
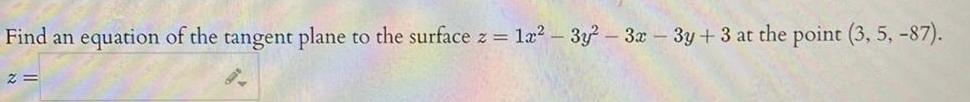
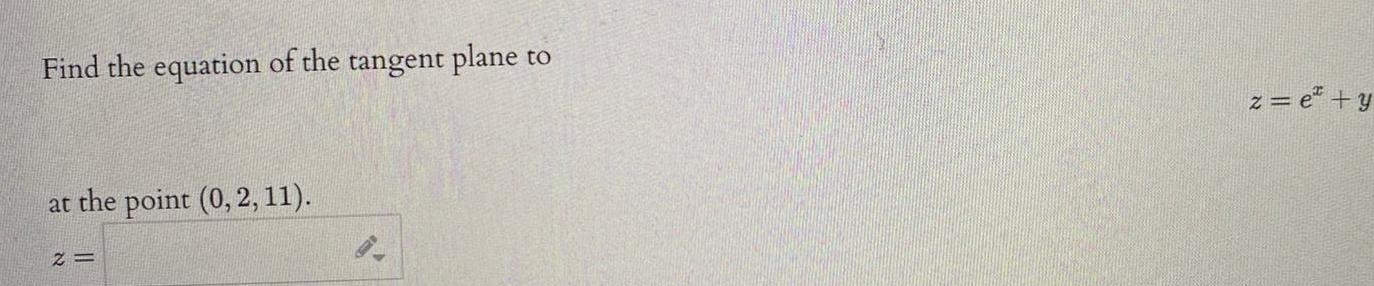
Vector CalculusFind an equation of the tangent plane to the surface z 2 1x 3y 3x 3y 3 at the point 3 5 87
Calculus
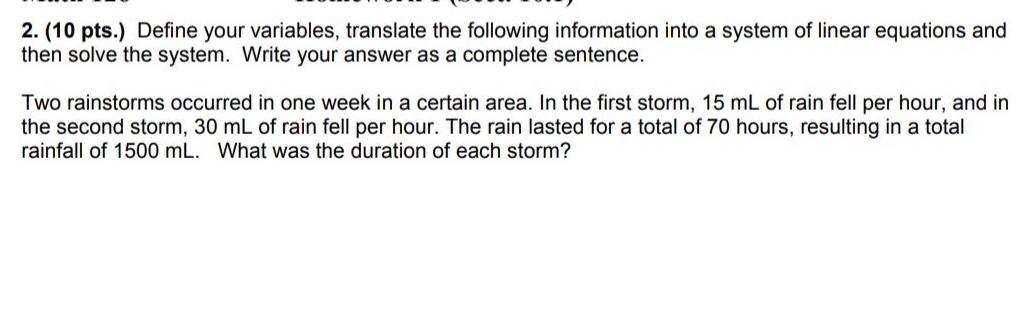
Vector Calculus2 10 pts Define your variables translate the following information into a system of linear equations and then solve the system Write your answer as a complete sentence Two rainstorms occurred in one week in a certain area In the first storm 15 mL of rain fell per hour and in the second storm 30 mL of rain fell per hour The rain lasted for a total of 70 hours resulting in a total rainfall of 1500 mL What was the duration of each storm
Calculus
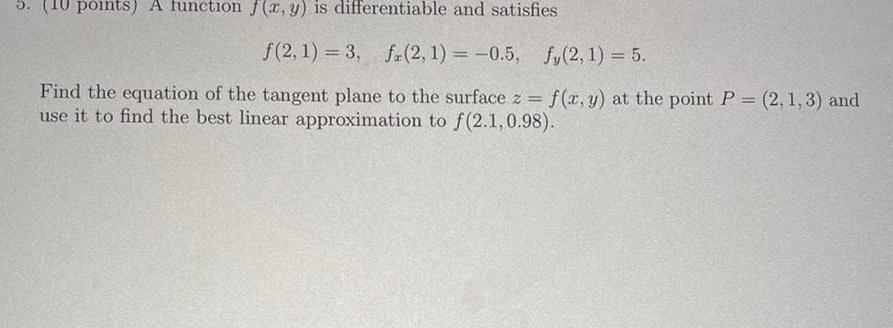
Vector Calculus5 10 points A function f x y is differentiable and satisfies f 2 1 3 fr 2 1 0 5 f 2 1 5 Find the equation of the tangent plane to the surface z f x y at the point P 2 1 3 and use it to find the best linear approximation to f 2 1 0 98
Calculus
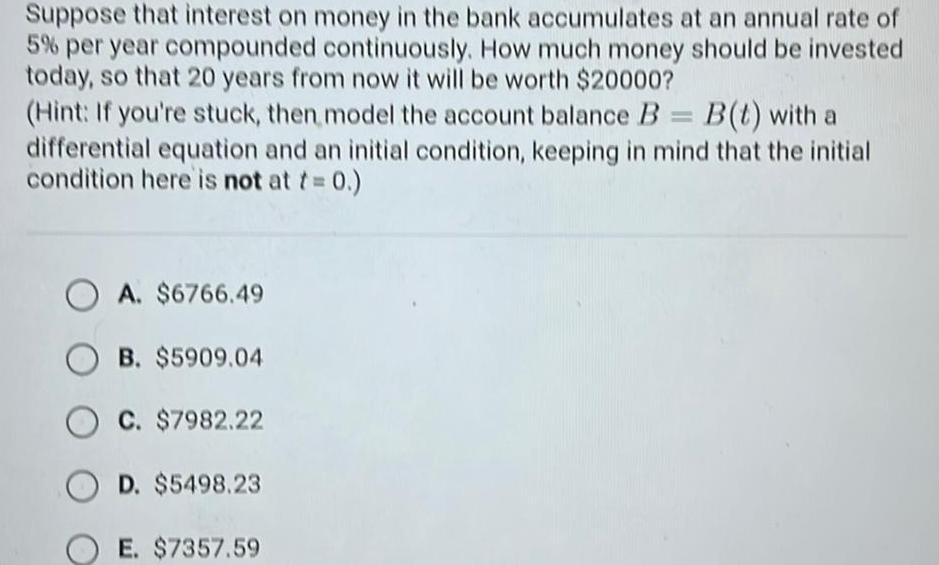
Vector CalculusSuppose that interest on money in the bank accumulates at an annual rate of 5 per year compounded continuously How much money should be invested today so that 20 years from now it will be worth 20000 Hint If you re stuck then model the account balance B B t with a differential equation and an initial condition keeping in mind that the initial condition here is not at t 0 OA 6766 49 OB 5909 04 C 7982 22 OD 5498 23 E 7357 59

Calculus
Vector Calculusa Graph the function f x x 4x 3 b Identify the point a f a at which the function has a tangent line with zero slope c Confirm your answer to part b by making a table of slopes of secant lines to approximate the slope of the tangent line at this point
Calculus
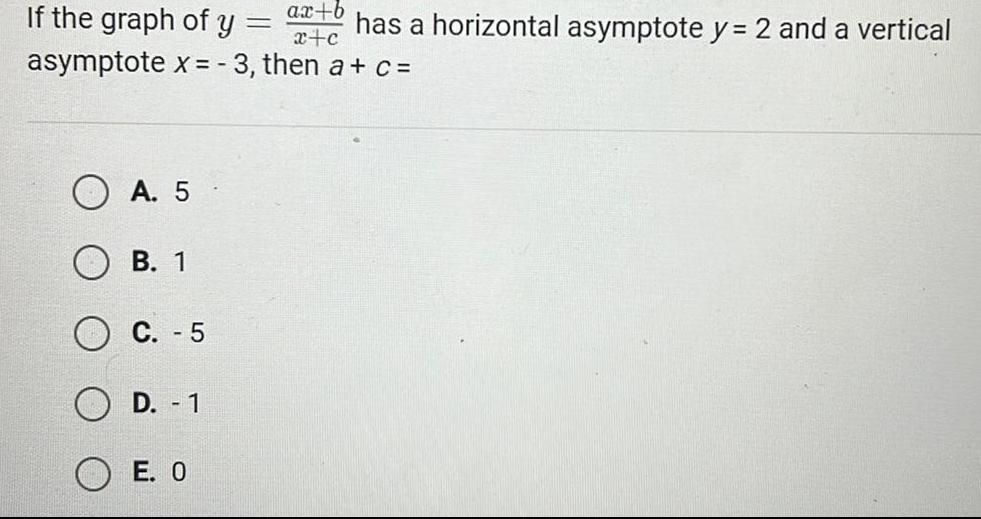
Vector CalculusIf the graph of y A 5 B 1 asymptote x 3 then a c C 5 D 1 E 0 ax b x c has a horizontal asymptote y 2 and a vertical
Calculus
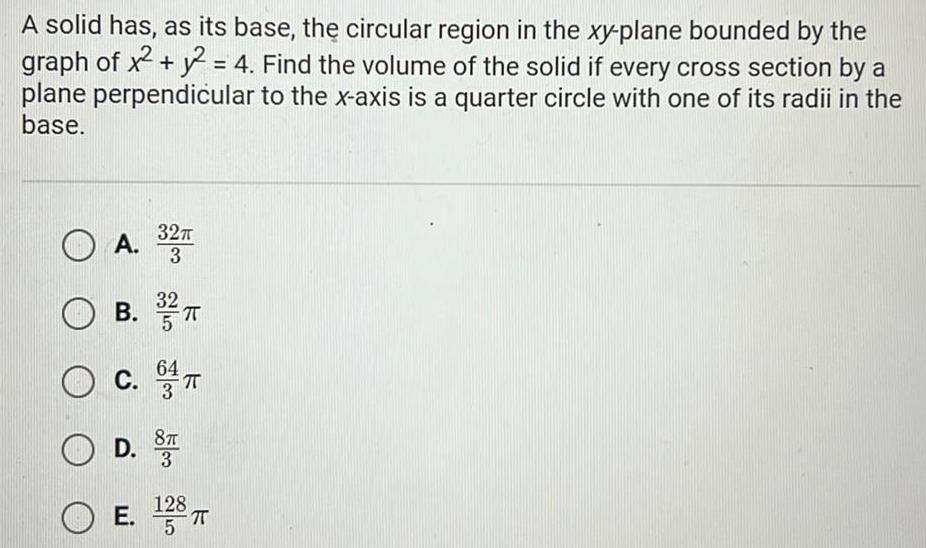
Vector CalculusA solid has as its base the circular region in the xy plane bounded by the graph of x y2 4 Find the volume of the solid if every cross section by a plane perpendicular to the x axis is a quarter circle with one of its radii in the base 32 A 32T OA 32 B 3 TT C 8T OD 3 E 138 T 5 OE
Calculus
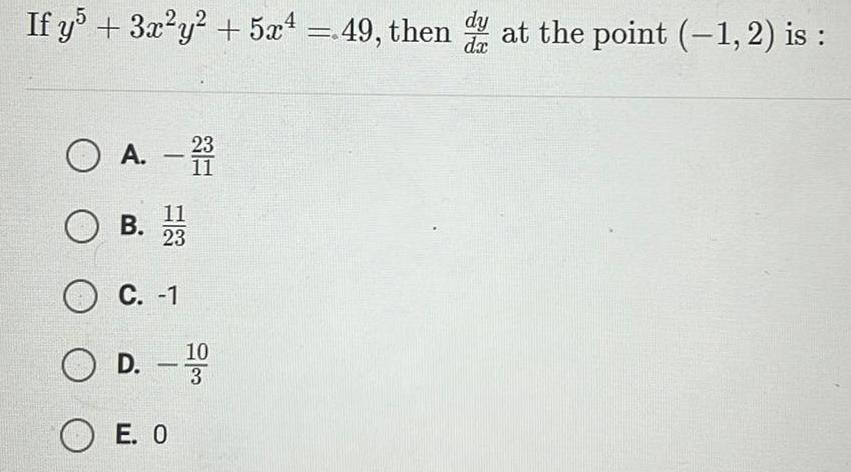
Vector CalculusIf y5 3x y 5x4 49 then dy at the point 1 2 is dx O A OB 11 23 O C 1 11 O D OE O D 100 3
Calculus
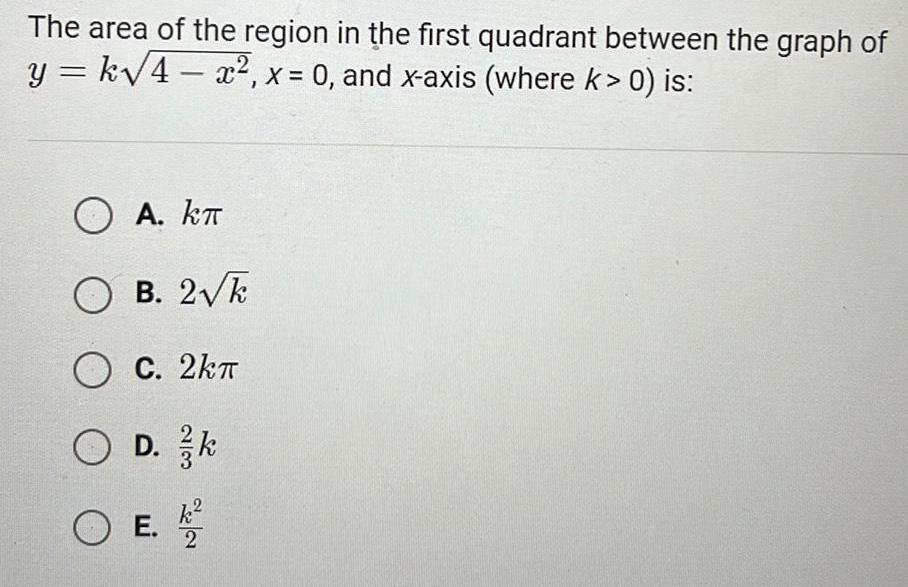
Vector CalculusThe area of the region in the first quadrant between the graph of y k 4x x 0 and x axis where k 0 is OA KT B 2 k OC 2kT D k O D O E 2
Calculus
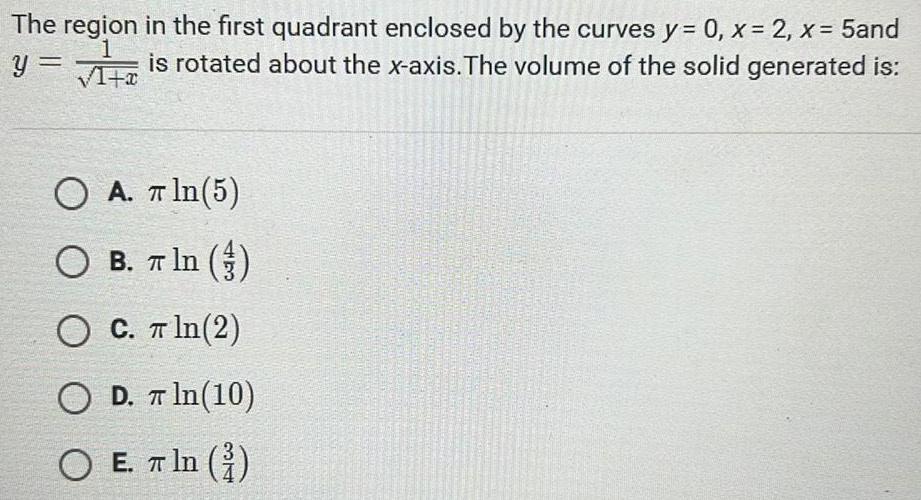
Vector CalculusThe region in the first quadrant enclosed by the curves y 0 x 2 x 5and is rotated about the x axis The volume of the solid generated is 1 y 1 x O A In 5 O B T In O C T ln 2 O D In 10 OE E ln
Calculus
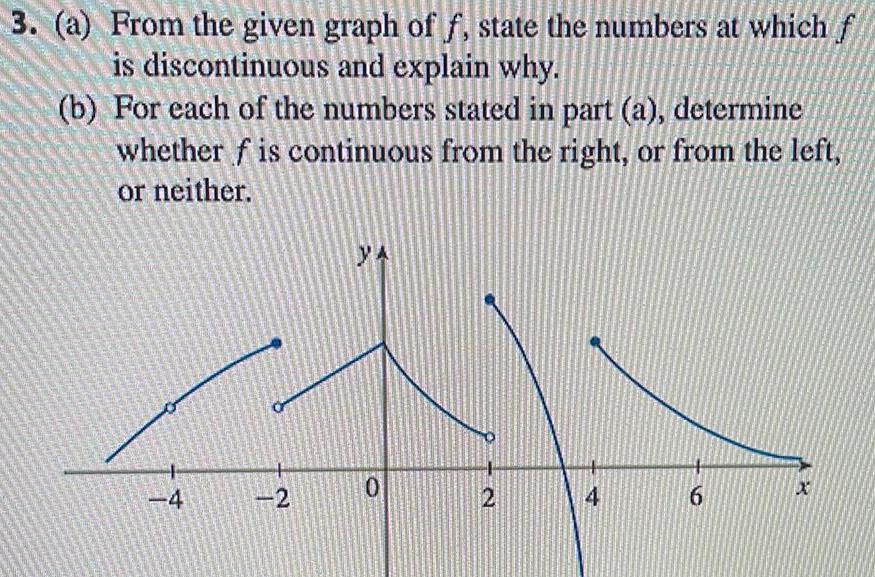
Vector Calculus3 a From the given graph of f state the numbers at which f is discontinuous and explain why b For each of the numbers stated in part a determine whether f is continuous from the right or from the left or neither 4 2 YA 0 2 4 6
Calculus
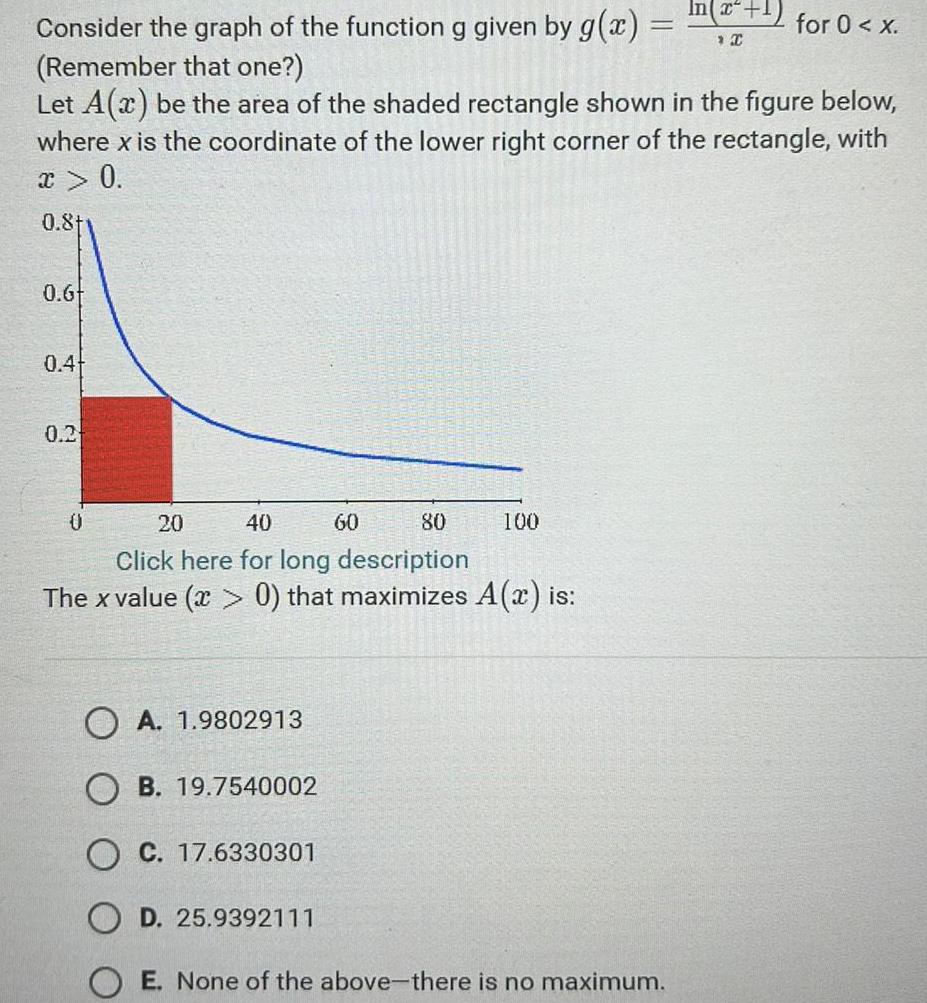
Vector CalculusConsider the graph of the function g given by g x Remember that one Let A x be the area of the shaded rectangle shown in the figure below where x is the coordinate of the lower right corner of the rectangle with x 0 0 81 0 6 0 4 0 2 20 40 80 Click here for long description The x value x 0 that maximizes A x is 0 OA 1 9802913 B 19 7540002 O C 17 6330301 D 25 9392111 60 100 In x 1 C OE None of the above there is no maximum for 0 x
Calculus
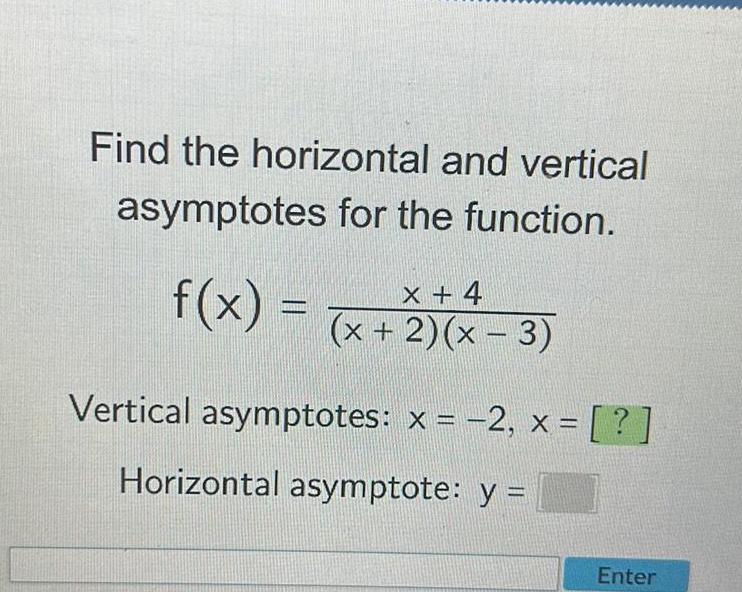
Vector CalculusFind the horizontal and vertical asymptotes for the function f x x 4 x 2 x 3 Vertical asymptotes x 2 x Horizontal asymptote y Enter
Calculus
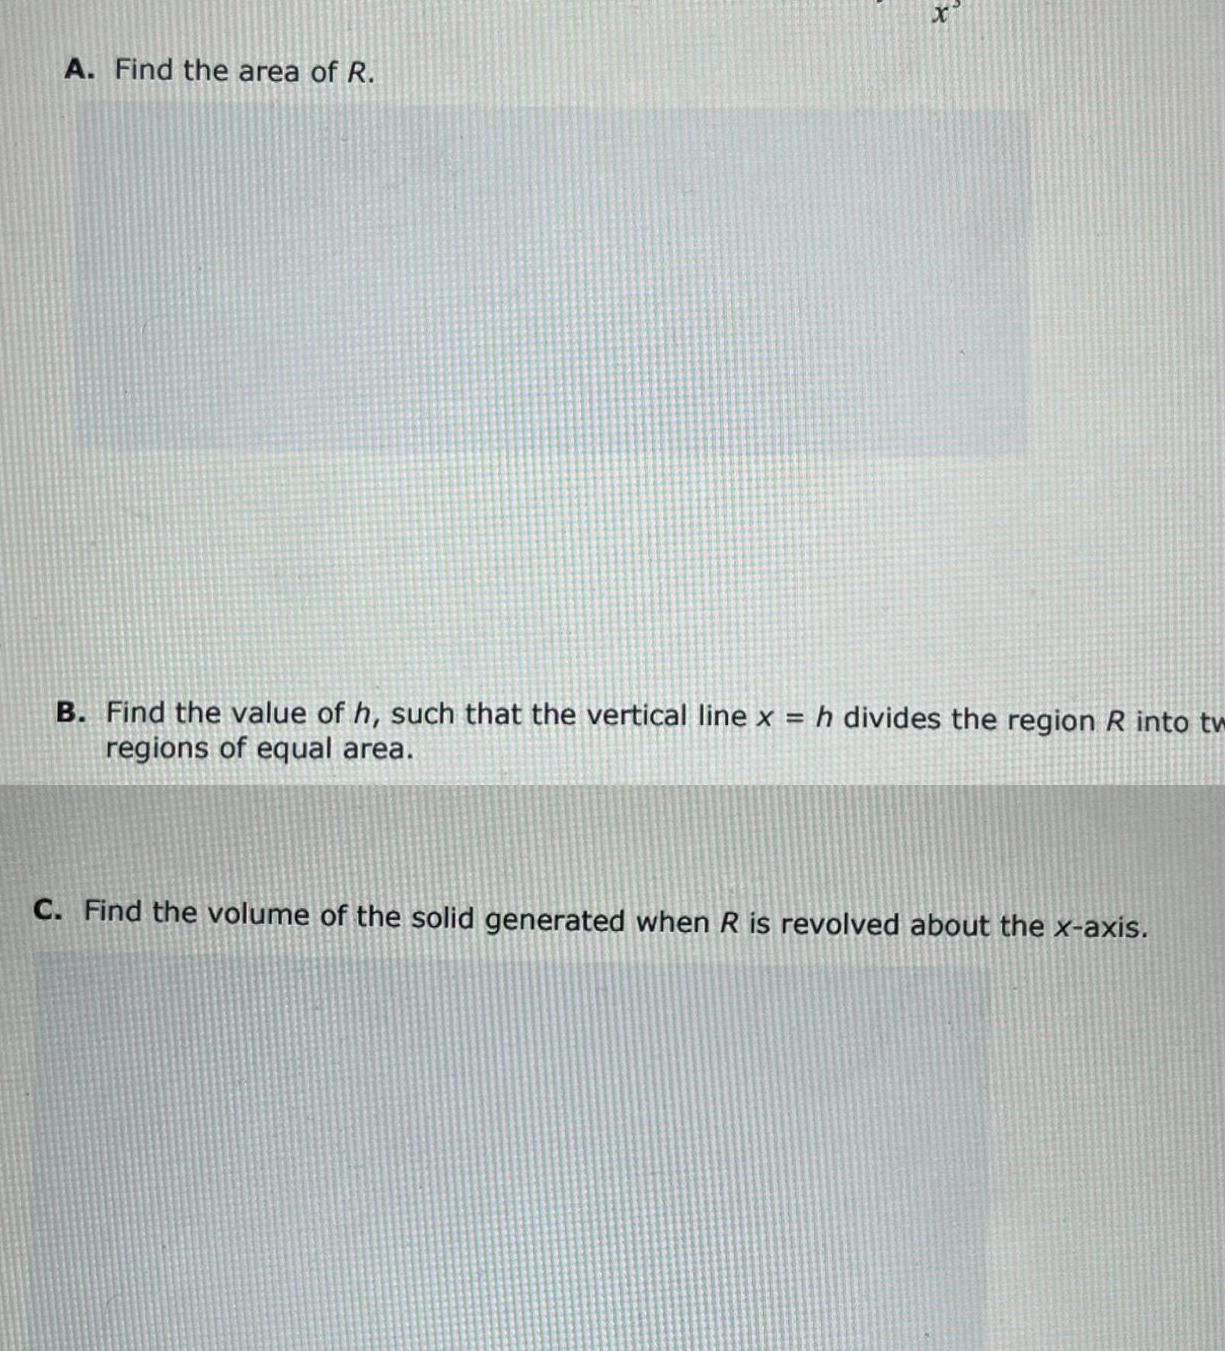
Vector CalculusA Find the area of R x B Find the value of h such that the vertical line x h divides the region R into tw regions of equal area C Find the volume of the solid generated when R is revolved about the x axis
Calculus
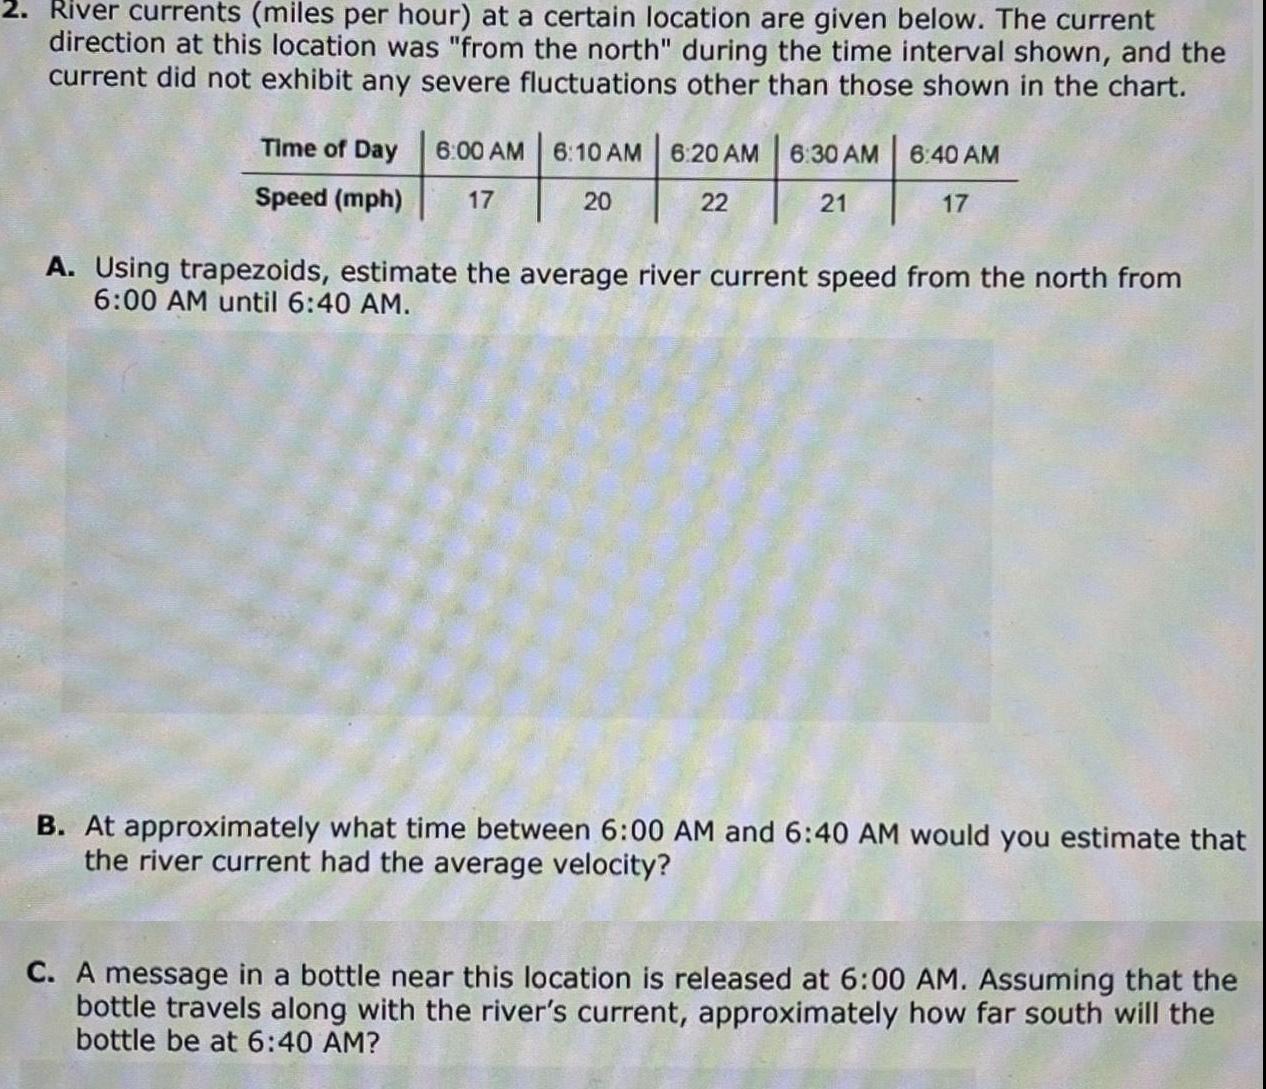
Vector Calculus2 River currents miles per hour at a certain location are given below The current direction at this location was from the north during the time interval shown and the current did not exhibit any severe fluctuations other than those shown in the chart Time of Day 6 00 AM 6 10 AM 6 20 AM Speed mph 17 20 22 6 30 AM 21 6 40 AM 17 A Using trapezoids estimate the average river current speed from the north from 6 00 AM until 6 40 AM B At approximately what time between 6 00 AM and 6 40 AM would you estimate that the river current had the average velocity C A message in a bottle near this location is released at 6 00 AM Assuming that the bottle travels along with the river s current approximately how far south will the bottle be at 6 40 AM
Calculus
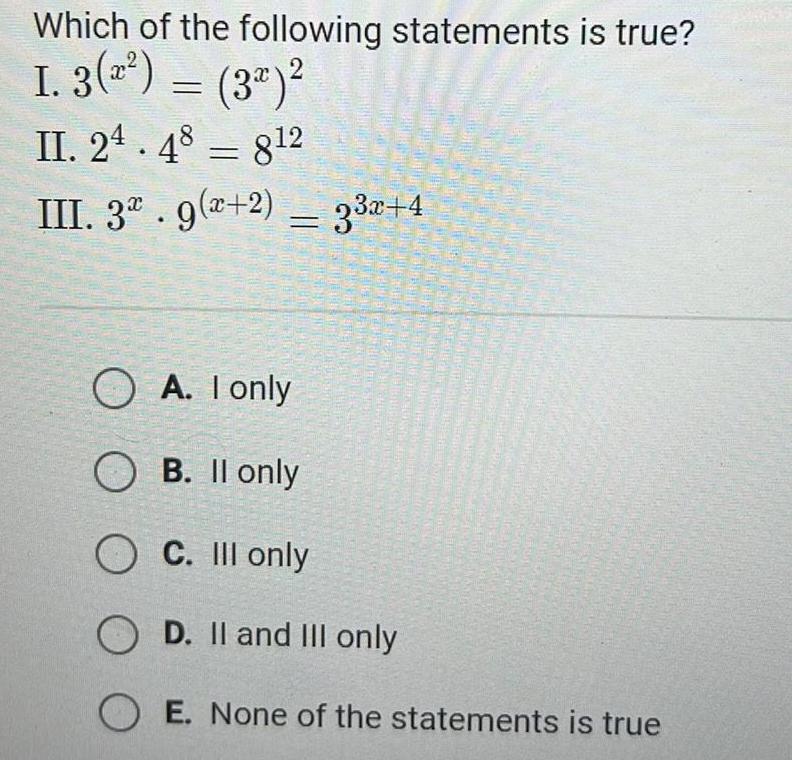
Vector CalculusWhich of the following statements is true I 3 3 II 24 48 812 III 3 9 2 33x 4 OA I only OB II only OC Ill only OD II and III only OE None of the statements is true
Calculus
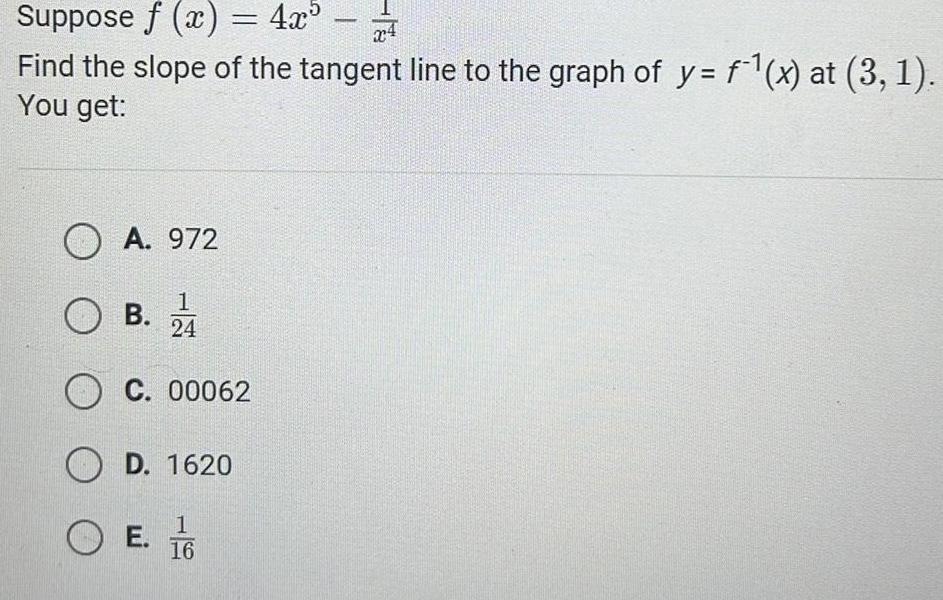
Vector CalculusSuppose x 4x f Find the slope of the tangent line to the graph of y f x at 3 1 You get OA 972 1 OB 24 C 00062 D 1620 E 16 O E
Calculus
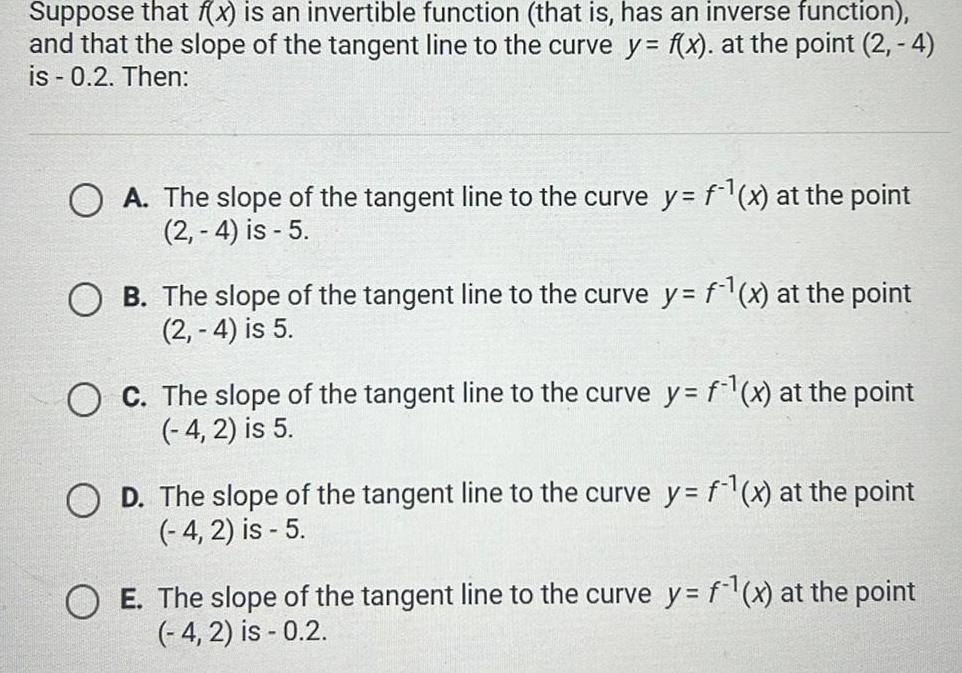
Vector CalculusSuppose that f x is an invertible function that is has an inverse function and that the slope of the tangent line to the curve y f x at the point 2 4 is 0 2 Then OA The slope of the tangent line to the curve y f x at the point 2 4 is 5 OB The slope of the tangent line to the curve y f x at the point 2 4 is 5 O C The slope of the tangent line to the curve y f x at the point 4 2 is 5 OD The slope of the tangent line to the curve y f x at the point 4 2 is 5 O E The slope of the tangent line to the curve y f x at the point 4 2 is 0 2
Calculus
Vector CalculusX F where F ri yj and S is the curved portion of the right circular cone given by 2 y 2 0 0 1 Hide Transcribed Text b Calculate iint S boldsymbol nabla times boldsymbol F cdot d boldsymbol S where F xi yj and S is the cunod portion of the right circular cong given by
Calculus
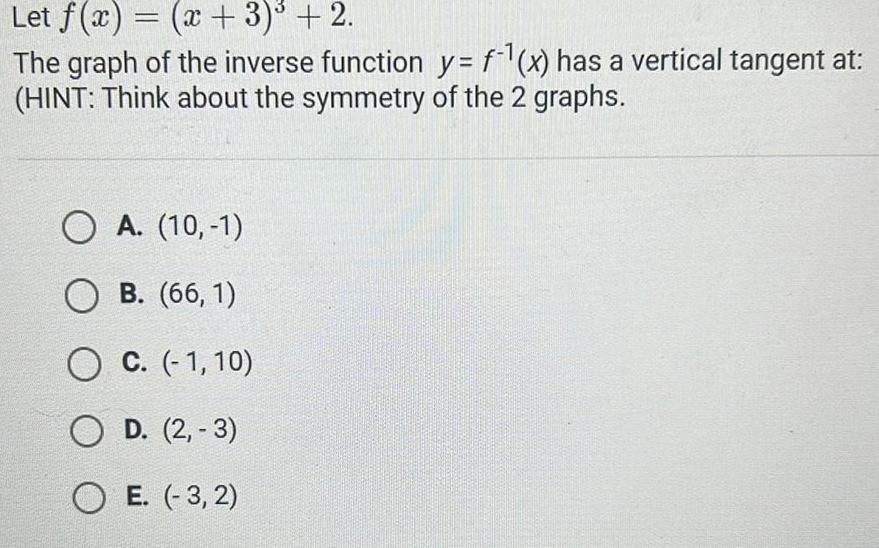
Vector CalculusLet f x x 3 2 The graph of the inverse function y f x has a vertical tangent at HINT Think about the symmetry of the 2 graphs O A 10 1 O B 66 1 O C 1 10 O D 2 3 OE 3 2

Calculus
Vector Calculus8 points EACH part Verify the Divergence Theorem is true for the vector field F x y z xi y j zk and t surface S is the plane 2x 2y z 6 bounded by the coordinate planes in octant 1
Calculus
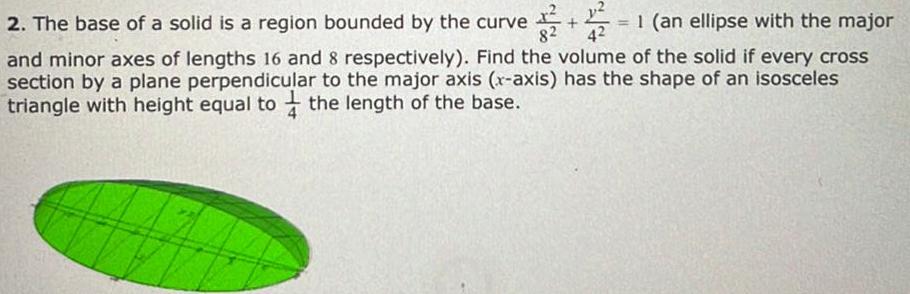
Vector Calculusx 2 The base of a solid is a region bounded by the curve 82 18 1 an ellipse with the major and minor axes of lengths 16 and 8 respectively Find the volume of the solid if every cross section by a plane perpendicular to the major axis x axis has the shape of an isosceles triangle with height equal to the length of the base
Calculus
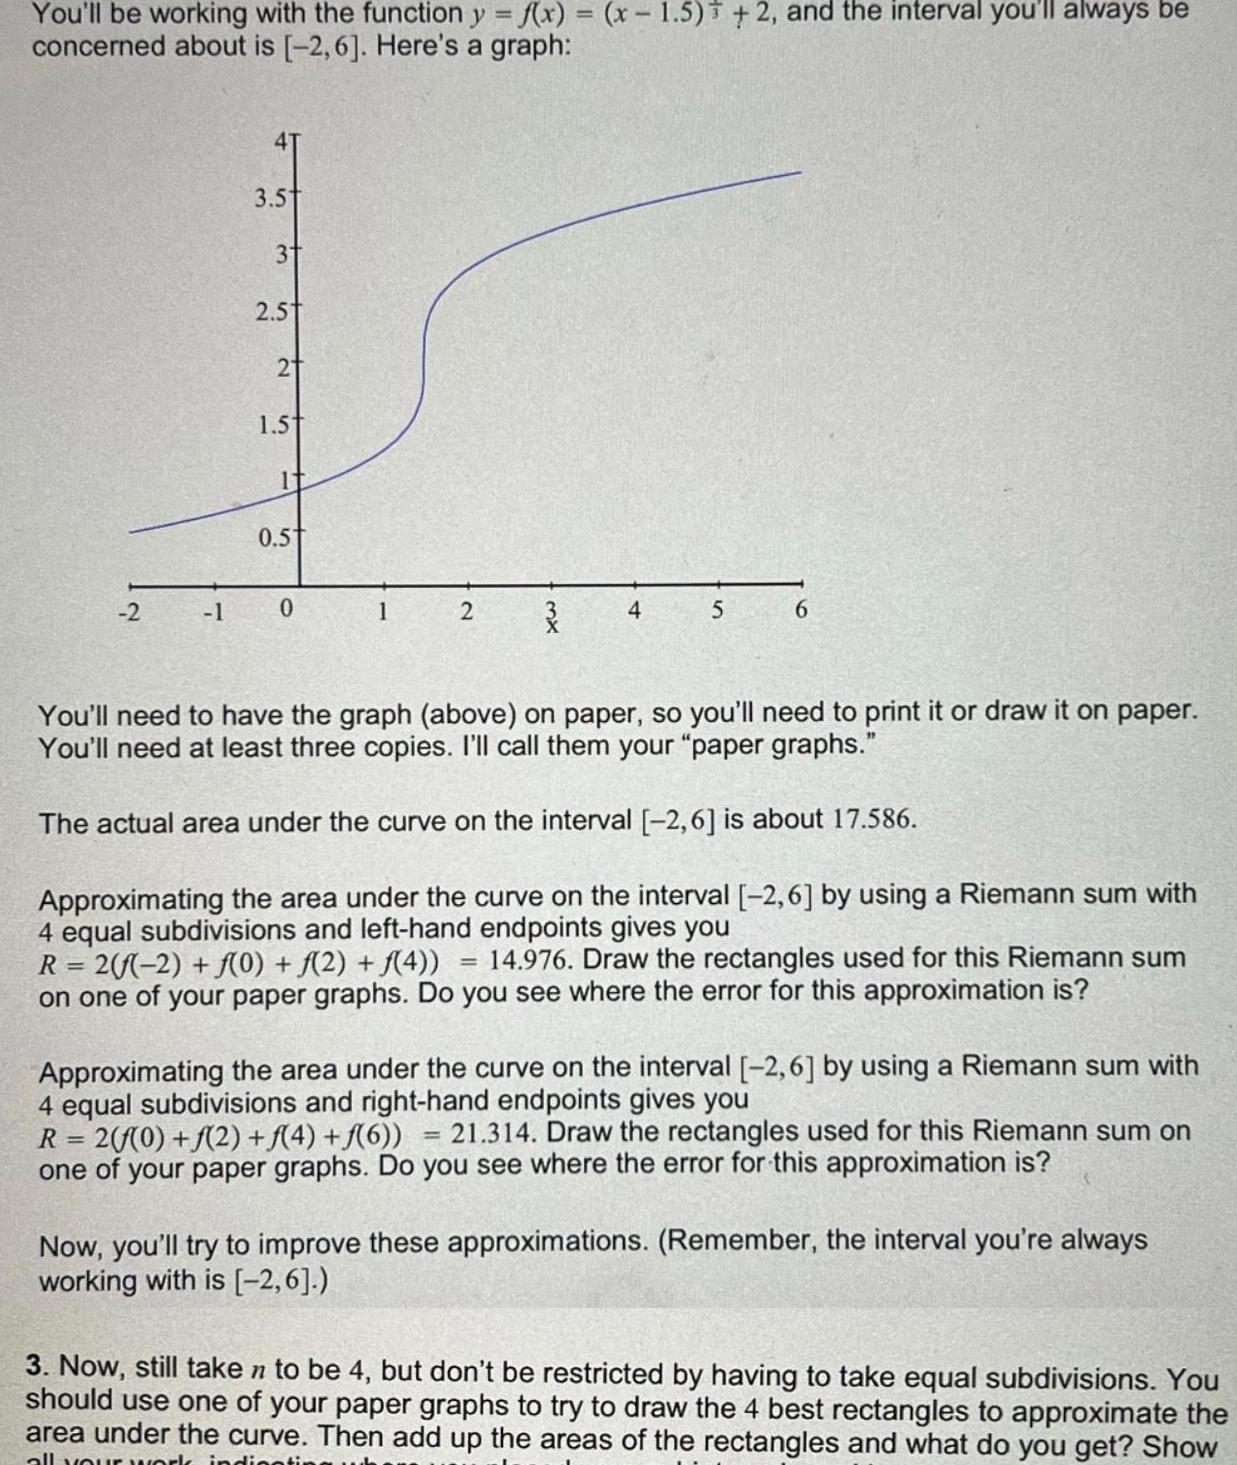
Vector CalculusYou ll be working with the function y f x x 1 5 2 and the interval you ll always be concerned about is 2 6 Here s a graph 2 1 3 5 3 2 5 2 1 5t It 0 5 0 1 2 4 5 6 You ll need to have the graph above on paper so you ll need to print it or draw it on paper You ll need at least three copies I ll call them your paper graphs The actual area under the curve on the interval 2 6 is about 17 586 Approximating the area under the curve on the interval 2 6 by using a Riemann sum with 4 equal subdivisions and left hand endpoints gives you R 2 f 2 f 0 f 2 f 4 14 976 Draw the rectangles used for this Riemann sum on one of your paper graphs Do you see where the error for this approximation is Approximating the area under the curve on the interval 2 6 by using a Riemann sum with 4 equal subdivisions and right hand endpoints gives you R 2 f 0 f 2 f 4 f 6 21 314 Draw the rectangles used for this Riemann sum on one of your paper graphs Do you see where the error for this approximation is Now you ll try to improve these approximations Remember the interval you re always working with is 2 6 3 Now still taken to be 4 but don t be restricted by having to take equal subdivisions You should use one of your paper graphs to try to draw the 4 best rectangles to approximate the area under the curve Then add up the areas of the rectangles and what do you get Show all your work indig
Calculus
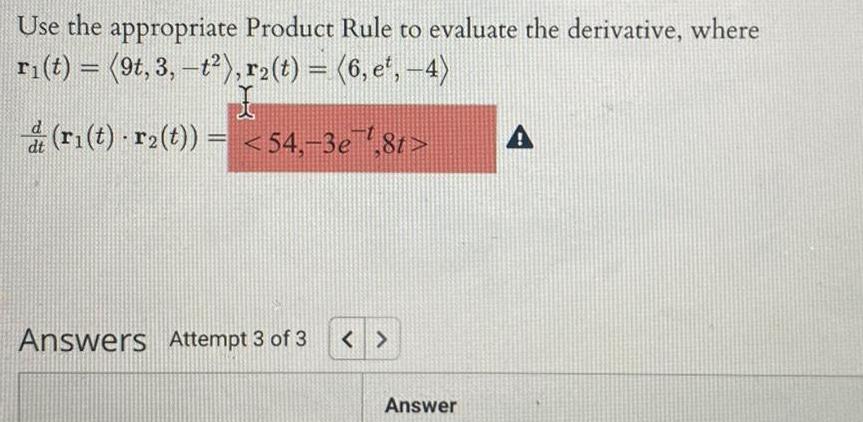
Vector CalculusUse the appropriate Product Rule to evaluate the derivative where ri t 9t 3 t r t 6 e 4 dt r t r t 54 3e 8t Answers Attempt 3 of 3 Answer
Calculus
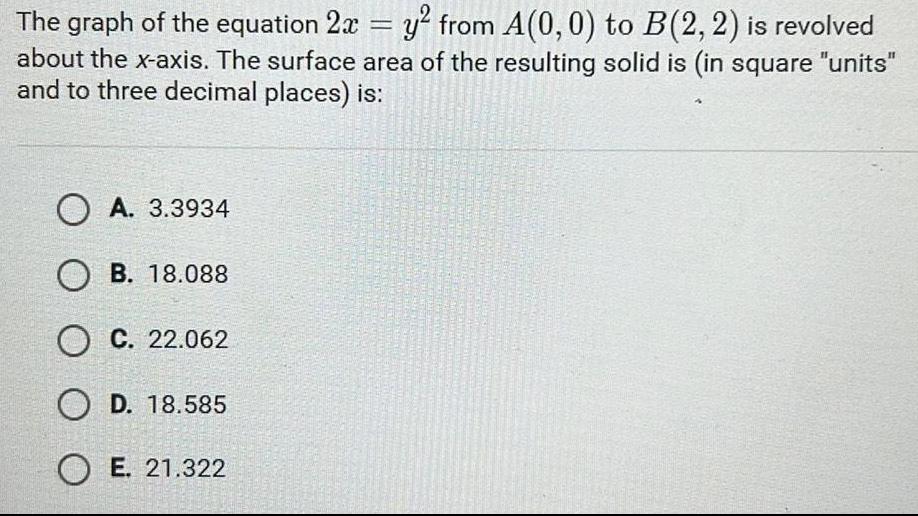
Vector CalculusThe graph of the equation 2x y from A 0 0 to B 2 2 is revolved about the x axis The surface area of the resulting solid is in square units and to three decimal places is A 3 3934 OB 18 088 O C 22 062 O D 18 585 OE 21 322
Calculus
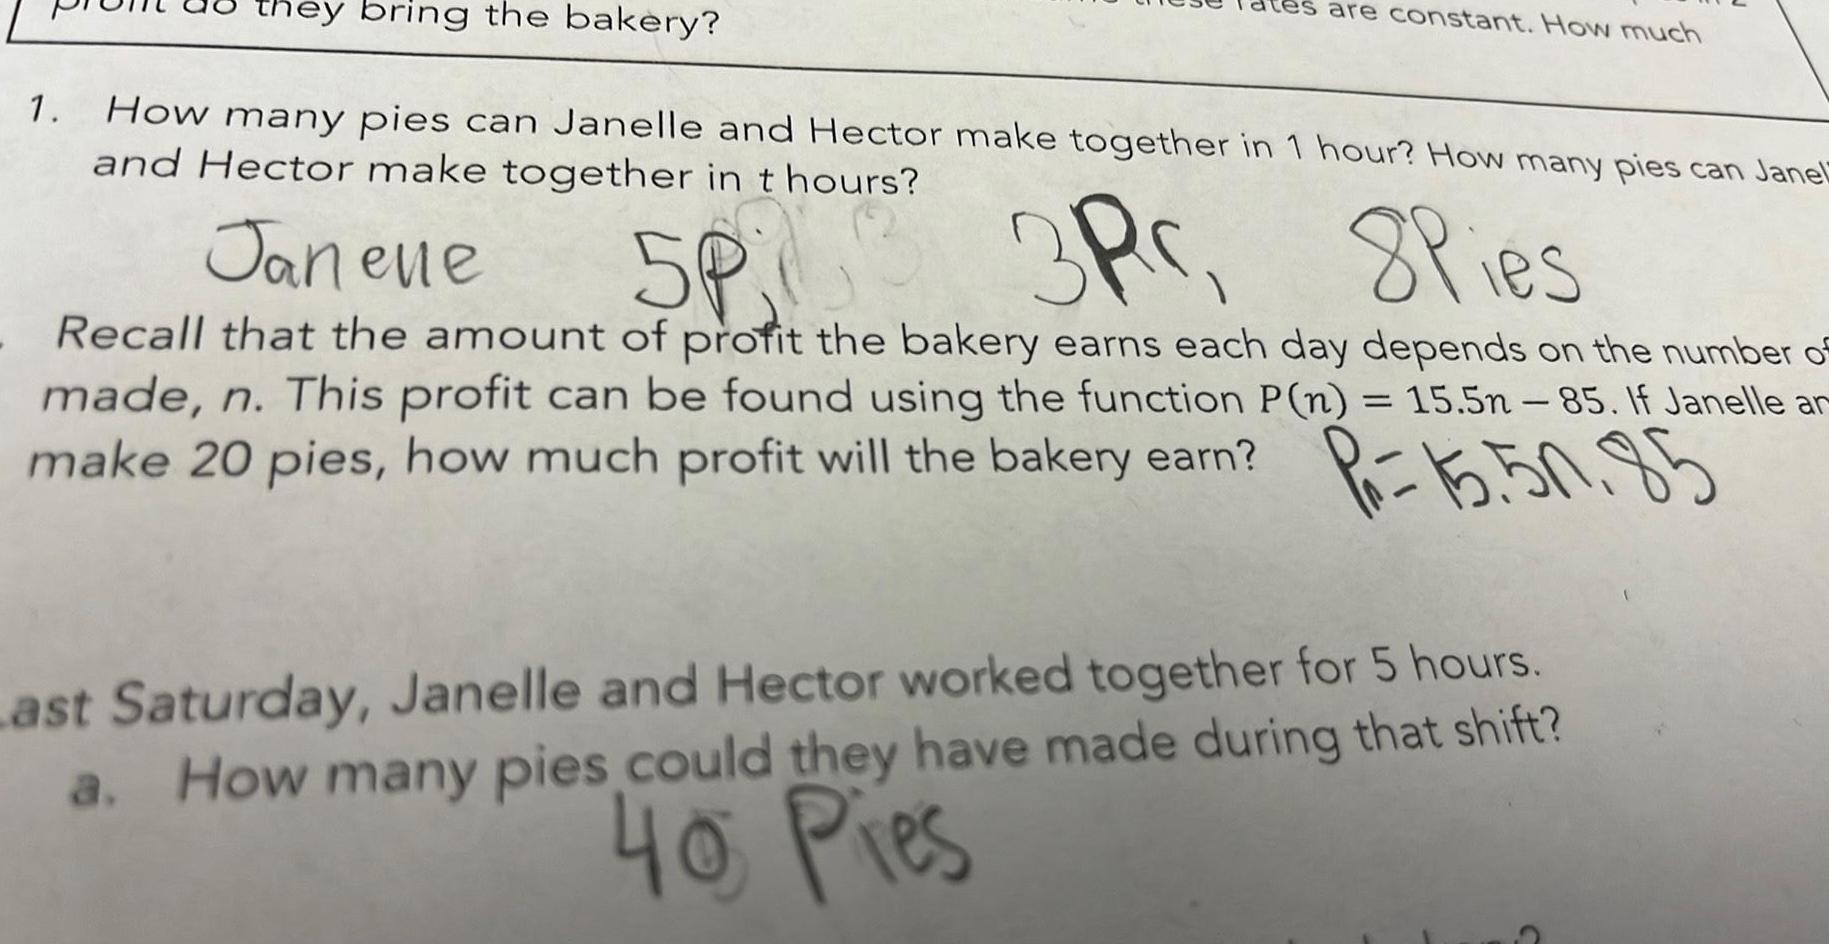
Vector Calculusthey bring the bakery 1 How many pies can Janelle and Hector make together in 1 hour How many pies can Janel and Hector make together in t hours are constant How much Janene 5P 3P 8Pies Recall that the amount of profit the bakery earns each day depends on the number of made n This profit can be found using the function P n 15 5n 85 If Janelle ar make 20 pies how much profit will the bakery earn Pr 15 50 85 Last Saturday Janelle and Hector worked together for 5 hours a How many pies could they have made during that shift 40 Pies

Calculus
Vector CalculusFind the cosine of the angle between the planes 5x 1y 5z 3 and the plane 12 2y 1z 4
Calculus
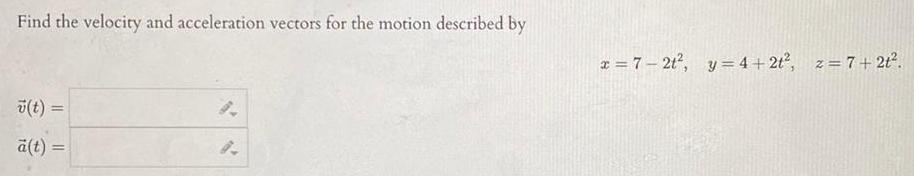
Vector CalculusFind the velocity and acceleration vectors for the motion described by v t a t 9 9 x 7 2t y 4 2t z 7 2t
Calculus
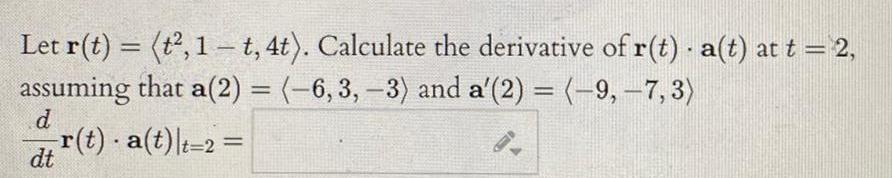
Vector CalculusLet r t t 1 t 4t Calculate the derivative of r t a t at t 2 assuming that a 2 6 3 3 and a 2 9 7 3 d dt r t a t t 2
Calculus
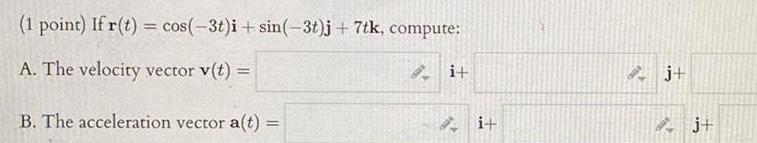
Vector Calculus1 point If r t cos 3t i sin 3t j 7tk compute A The velocity vector v t B The acceleration vector a t i i j Ij

Calculus
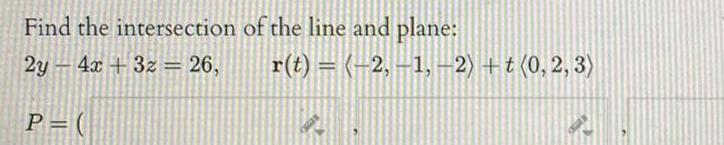
Vector CalculusFind the vector equation for the line of intersection of the planes 4x 3y 5z 0 and 4x 5z 1 0 t 15
Calculus
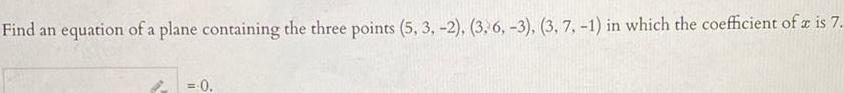
Vector CalculusFind an equation of a plane containing the three points 5 3 2 3 6 3 3 7 1 in which the coefficient of a is 7 0
Calculus
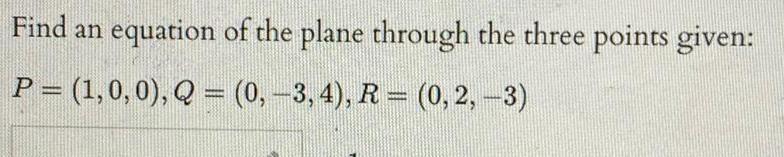
Vector CalculusFind an P 1 0 0 Q 0 3 4 R 0 2 3 equation of the plane through the three points given
Calculus
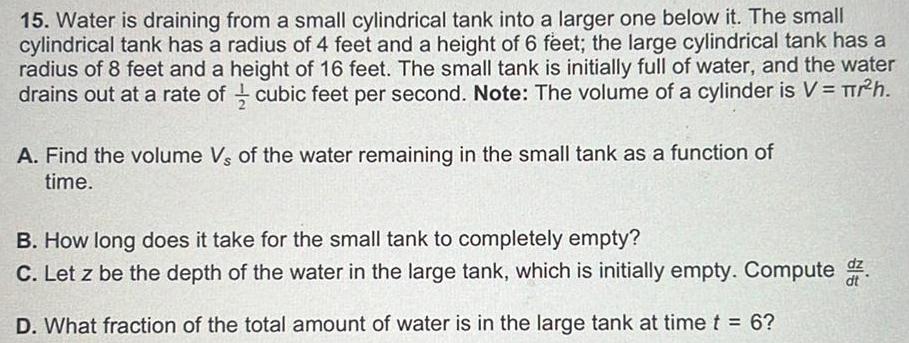
Vector Calculus15 Water is draining from a small cylindrical tank into a larger one below it The small cylindrical tank has a radius of 4 feet and a height of 6 feet the large cylindrical tank has a radius of 8 feet and a height of 16 feet The small tank is initially full of water and the water drains out at a rate of cubic feet per second Note The volume of a cylinder is V r h A Find the volume Vs of the water remaining in the small tank as a function of time B How long does it take for the small tank to completely empty C Let z be the depth of the water in the large tank which is initially empty Compute D What fraction of the total amount of water is in the large tank at time t 6
Calculus
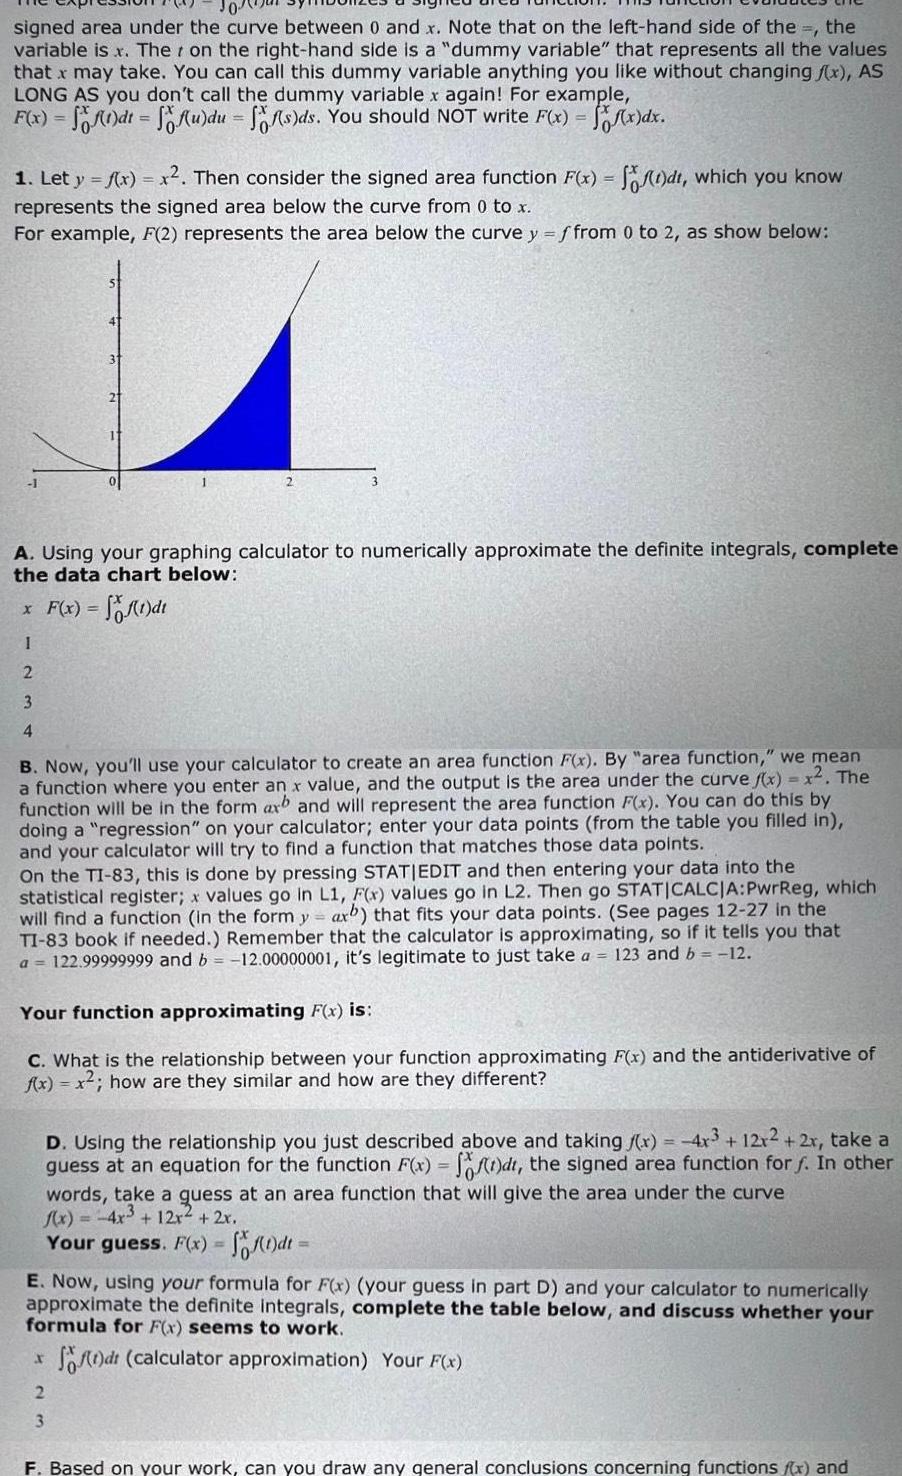
Vector Calculussigned area under the curve between 0 and x Note that on the left hand side of the the variable is x Ther on the right hand side is a dummy variable that represents all the values that x may take You can call this dummy variable anything you like without changing f x AS LONG AS you don t call the dummy variable x again For example F x f 1 dt f u du ff s ds You should NOT write F x f x dx 1 Let y f x x Then consider the signed area function F x f t dt which you know represents the signed area below the curve from 0 to x For example F 2 represents the area below the curve y f from 0 to 2 as show below A Using your graphing calculator to numerically approximate the definite integrals complete the data chart below x F x f 1 dt I 2 3 4 B Now you ll use your calculator to create an area function F x By area function we mean a function where you enter an x value and the output is the area under the curve f x x The function will be in the form axb and will represent the area function F x You can do this by doing a regression on your calculator enter your data points from the table you filled in and your calculator will try to find a function that matches those data points On the TI 83 this done by pressing STATIEDIT and then entering your data into the statistical register x values go in L1 F x values go in L2 Then go STATICALCJA PwrReg which will find a function in the form y ax that fits your data points See pages 12 27 in the TI 83 book if needed Remember that the calculator is approximating so if it tells you that a 122 99999999 and b 12 00000001 it s legitimate to just take a 123 and b 12 Your function approximating F x is C What is the relationship between your function approximating F x and the antiderivative of f x x how are they similar and how are they different D Using the relationship you just described above and taking x 4x3 12x2 2x take a guess at an equation for the function F x f t dt the signed area function for f In other words take a quess at an area function that will give the area under the curve f x 4x 12x 2x Your guess F x f 1 dt E Now using your formula for F x your guess in part D and your calculator to numerically approximate the definite integrals complete the table below and discuss whether your formula for F x seems to work f dt calculator approximation Your F x r 2 3 F Based on your work can you draw any general conclusions concerning functions f x and

Calculus
Vector Calculussomething that is happening in the world over the last month I would like you to find something other than the fire in Maui Create a slides presentation Find 2 current events dig deeper than the first site you find on google o They can be happening in Vegas The US or the World o One slide for each event On you slide you need o A summary of the events IN YOUR OWN WORDS This should be 3 4 sentences o A personal response 3 sentences Why did you choose this event why is the event important how do you feel about this event what action would you take to either solve highlight this event Add a picture s of the event Share will people sitting at your table One two people will share their event s with class
Calculus
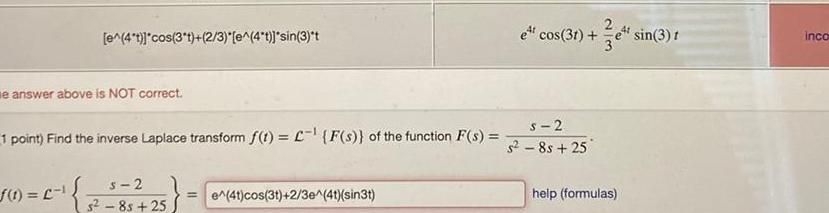
Vector Calculuse 4 t cos 3 t 2 3 e 4 t sin 3 t e answer above is NOT correct 1 point Find the inverse Laplace transform f t F s of the function F s f 1 C 1 s 2 5 85 25 e 4t cos 3t 2 3e 4t sin3t e cos 31 sin 3 t 3 s 2 s 8s 25 help formulas inco
Calculus
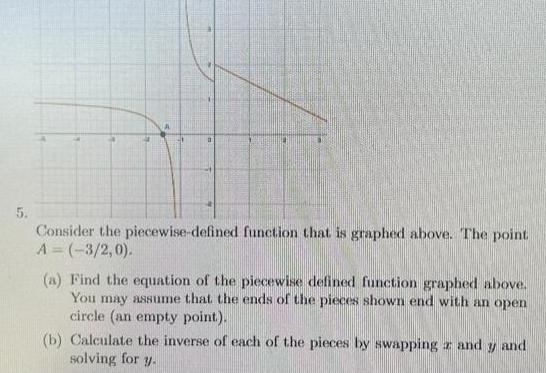
Vector CalculusConsider the piecewise defined function that is graphed above The point A 3 2 0 a Find the equation of the piecewise defined function graphed above You may assume that the ends of the pieces shown end with an open circle an empty point b Calculate the inverse of each of the pieces by swapping z and solving for y and
Calculus
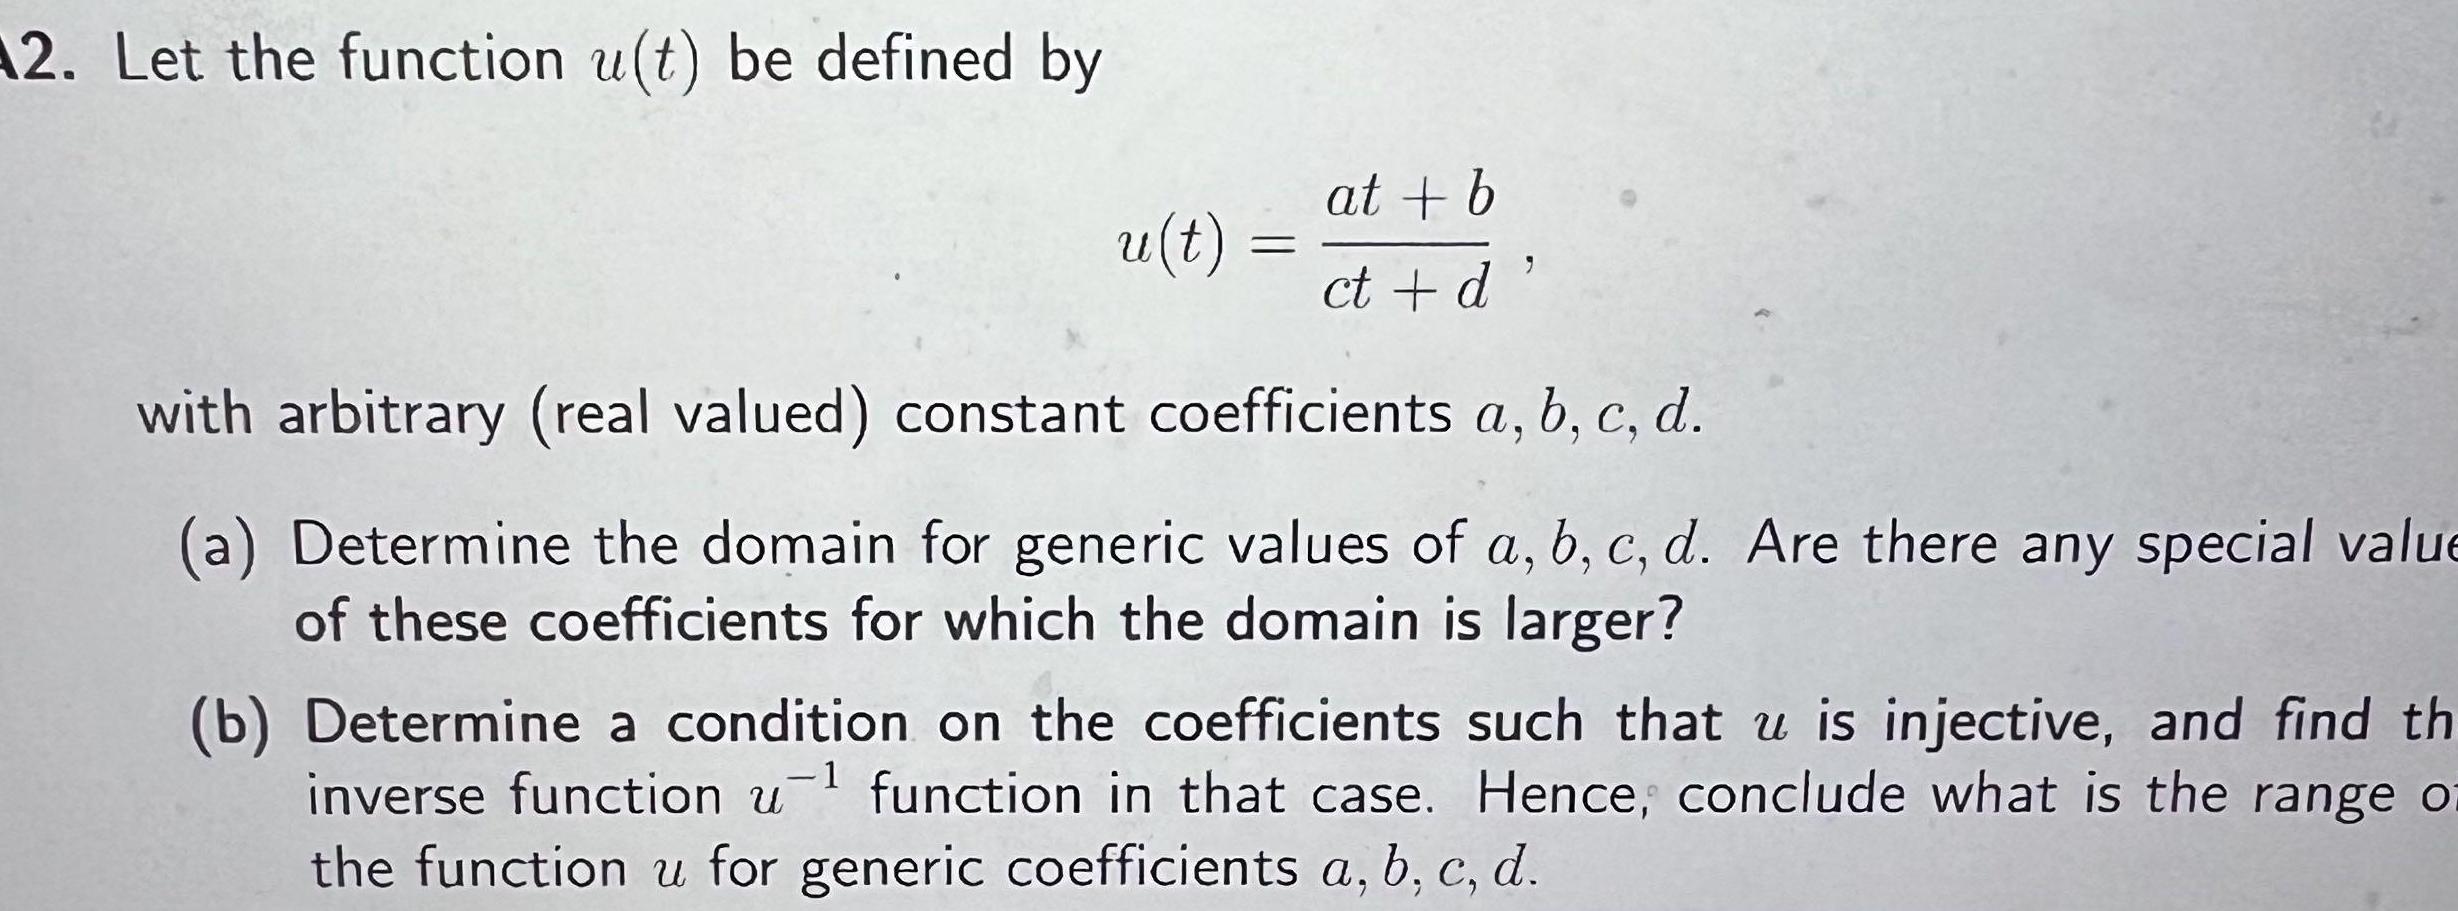
Vector Calculus12 Let the function u t be defined by u t at b ct d with arbitrary real valued constant coefficients a b c d a Determine the domain for generic values of a b c d Are there any special value of these coefficients for which the domain is larger b Determine a condition on the coefficients such that u is injective and find th inverse function u function in that case Hence conclude what is the range of the function u for generic coefficients a b c d
Calculus
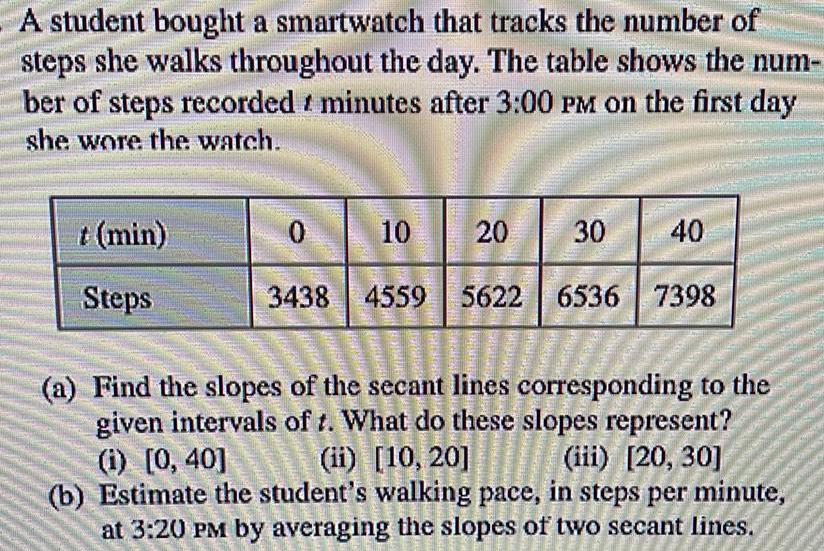
Vector CalculusA student bought a smartwatch that tracks the number of steps she walks throughout the day The table shows the num ber of steps recorded minutes after 3 00 PM on the first day she wore the watch t min Steps 10 20 30 40 3438 4559 5622 6536 7398 0 Matala BORDE PAPINH AMITRIP Helen www ke a Find the slopes of the secant lines corresponding to the given intervals of t What do these slopes represent ii 10 20 iii 20 30 i 0 40 b Estimate the student s walking pace in steps per minute at 3 20 PM by averaging the slopes of two secant lines