Statistics Questions
The best high school and college tutors are just a click away, 24×7! Pick a subject, ask a question, and get a detailed, handwritten solution personalized for you in minutes. We cover Math, Physics, Chemistry & Biology.

Statistics
StatisticsA statistics professor recently graded final exams for students in her introductory statistics course In a review of her grading she found the mean score out of 100 points was a 77 with a margin of error of 10 Construct a confidence interval for the mean score out of 100 points on the final exam Provide your answer below

Statistics
StatisticsKenneth a competitor in cup stacking claims that his average stacking time is 8 2 seconds During a practice session Kenneth has a sample stacking time mean of 7 8 seconds based on 11 trials At the 4 significance level does the data provide sufficient evidence to conclude that Kenneth s mean stacking time is less than 8 2 seconds Accept or reject the hypothesis given the sample data below Hop 8 2 seconds H 8 2 seconds a 0 04 significance level 0 1 75 P 0 0401 Select the correct answer below Do not reject the null hypothesis because the p value 0 0401 is greater than the significance level a 0 04 O Reject the null hypothesis because the p value 0 0401 is greater than the significance level a 0 04 Reject the null hypothesis because the value of 2 is negative Reject the null hypothesis because 1 75 0 04 Do not reject the null hypothesis because 1 75 0 04

Statistics
StatisticsSuppose a chef claims that her meatball weight is less than 4 ounces on average Several of her customers do not believe her so the chef decides to do a hypothesis test at a 10 significance level to persuade them She cooks 14 meatballs The mean weight of the sample meatballs is 3 7 ounces The chef knows from experience that the standard deviation for her meatball weight is 0 5 ounces Ho 4 H 4 a 0 1 significance level What is the test statistic z score of this one mean hypothesis test rounded to two decimal places Provide your answer below

Statistics
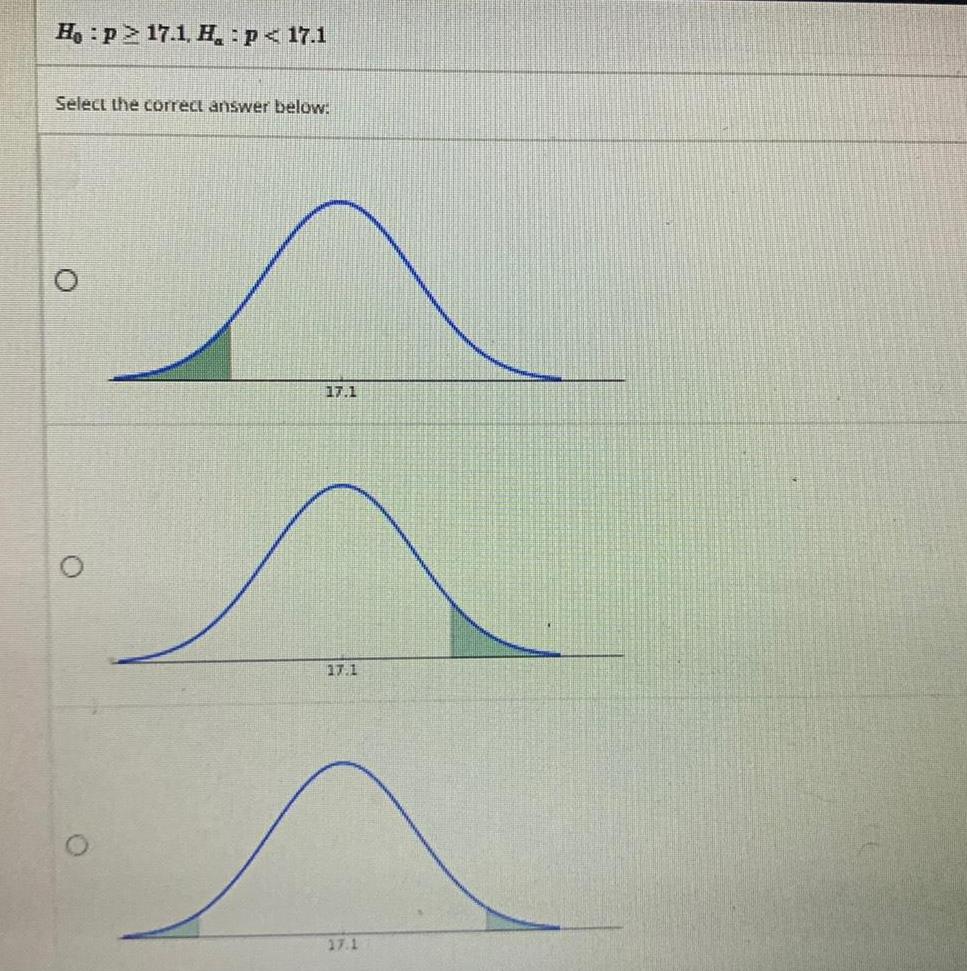
StatisticsFind the graph that matches the following hypothesis test Ho p 17 1 Ha p 17 1 Select the correct answer below
Statistics
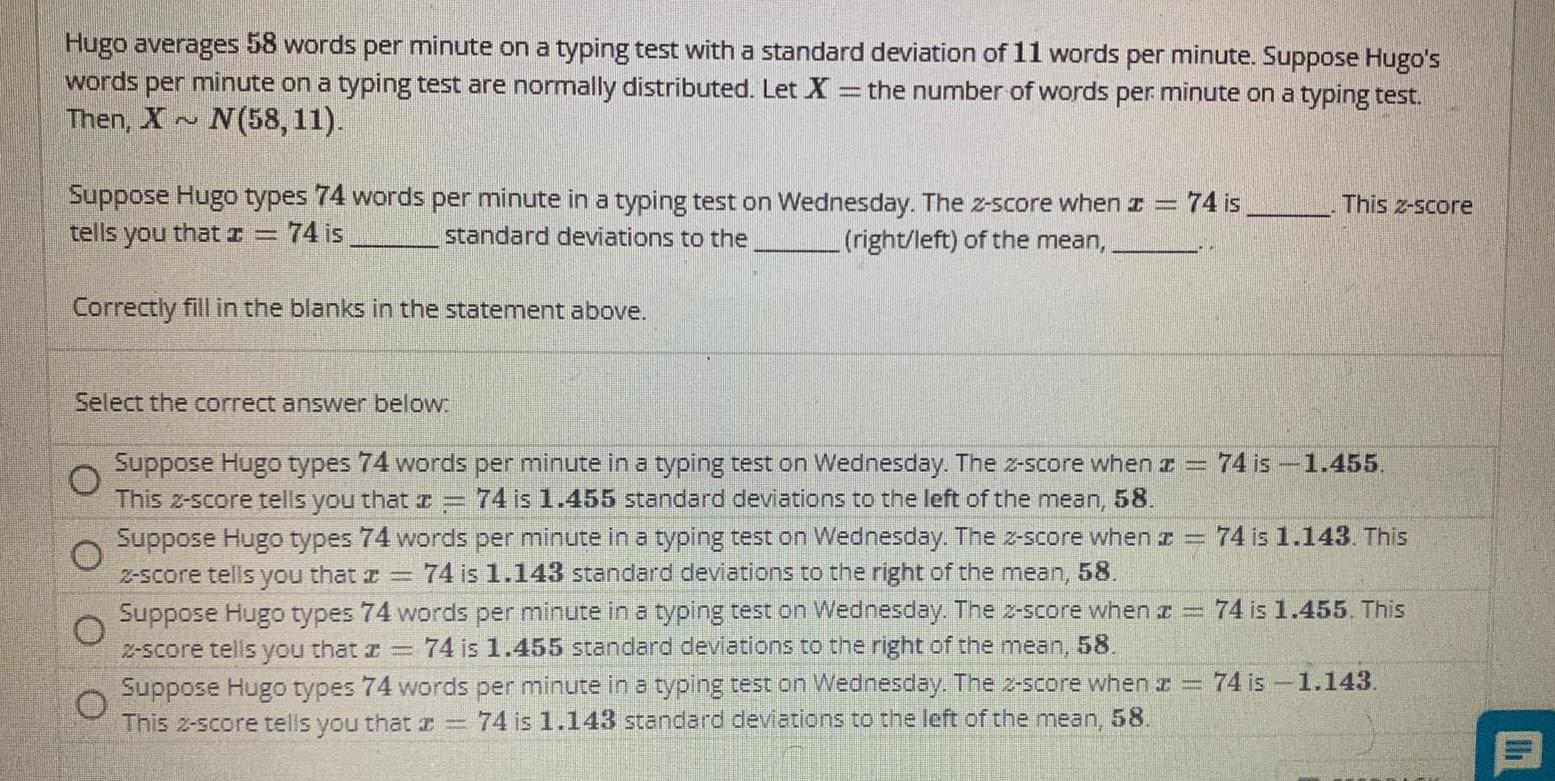
StatisticsHugo averages 58 words per minute on a typing test with a standard deviation of 11 words per minute Suppose Hugo s words per minute on a typing test are normally distributed Let X the number of words per minute on a typing test Then X N N 58 11 Suppose Hugo types 74 words per minute in a typing test on Wednesday The z score when z 74 is tells you that 74 is standard deviations to the right left of the mean Correctly fill in the blanks in the statement above Select the correct answer below 74 is 1 455 74 is 1 143 This Suppose Hugo types 74 words per minute in a typing test on ednesday The 2 score when z This 2 score tells you that 74 is 1 455 standard deviations to the left of the mean 58 Suppose Hugo types 74 words per minute in a typing test on Wednesday The z score when z 2 score tells you that a 74 is 1 143 standard deviations to the right of the mean 58 Suppose Hugo types 74 words per minute in a typing test on Wednesday The 2 score when 74 is 1 455 This 2 score tells you that z 74 is 1 455 standard deviations to the right of the mean 58 Suppose Hugo types 74 words per minute in a typing test on Wednesday The 2 score when z 74 is 1 143 This 2 score tells you that a 74 is 1 143 standard deviations to the left of the mean 58 2 0 This 2 score 127 11
Statistics
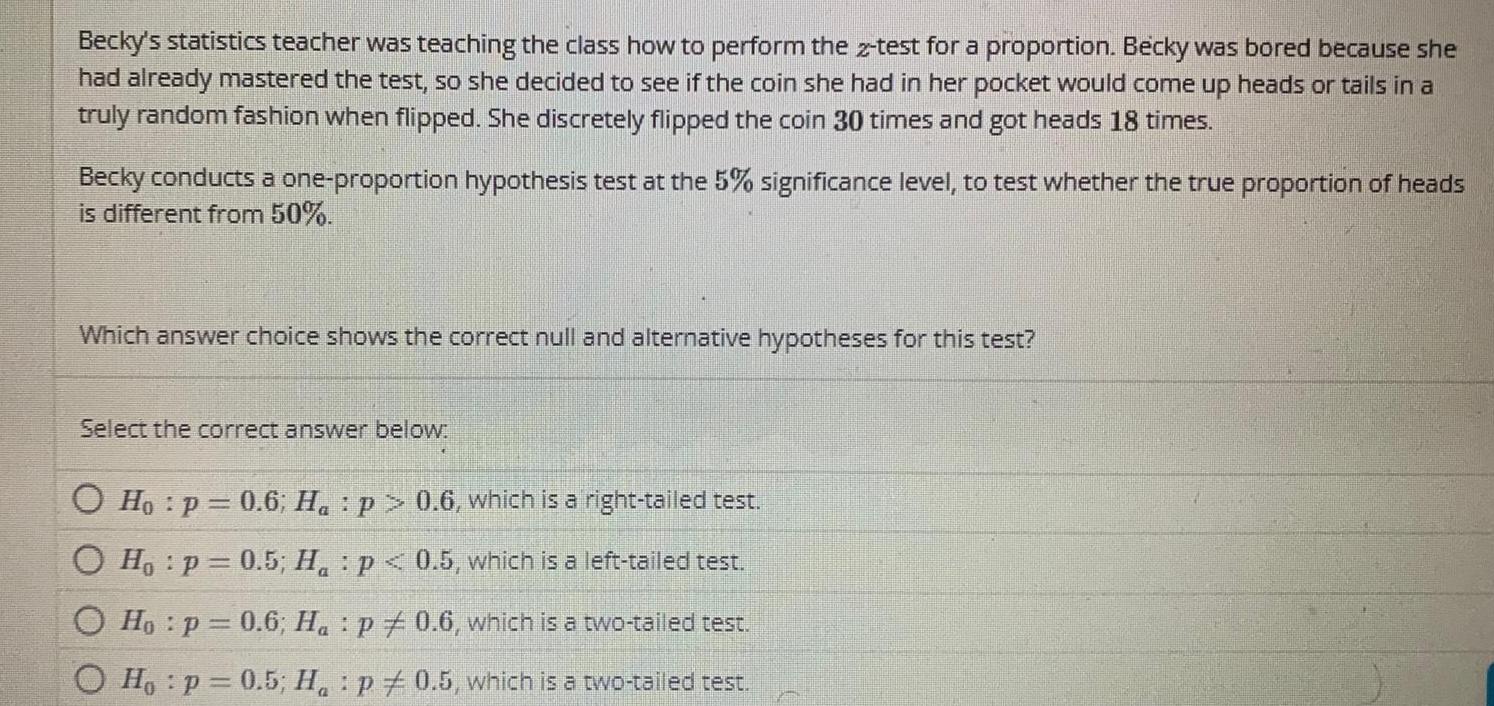
StatisticsBecky s statistics teacher was teaching the class how to perform the 2 test for a proportion Becky was bored because she had already mastered the test so she decided to see if the coin she had in her pocket would come up heads or tails in a truly random fashion when flipped She discretely flipped the coin 30 times and got heads 18 times Becky conducts a one proportion hypothesis test at the 5 significance level to test whether the true proportion of heads is different from 50 Which answer choice shows the correct null and alternative hypotheses for this test Select the correct answer below O Ho p 0 6 Ha p 0 6 which is a right tailed test O Ho p 0 5 H p 0 5 which is a left tailed test Ho p 0 6 Ha p 0 6 which is a two tailed test Ho p 0 5 H p0 5 which is a two tailed test P
Statistics
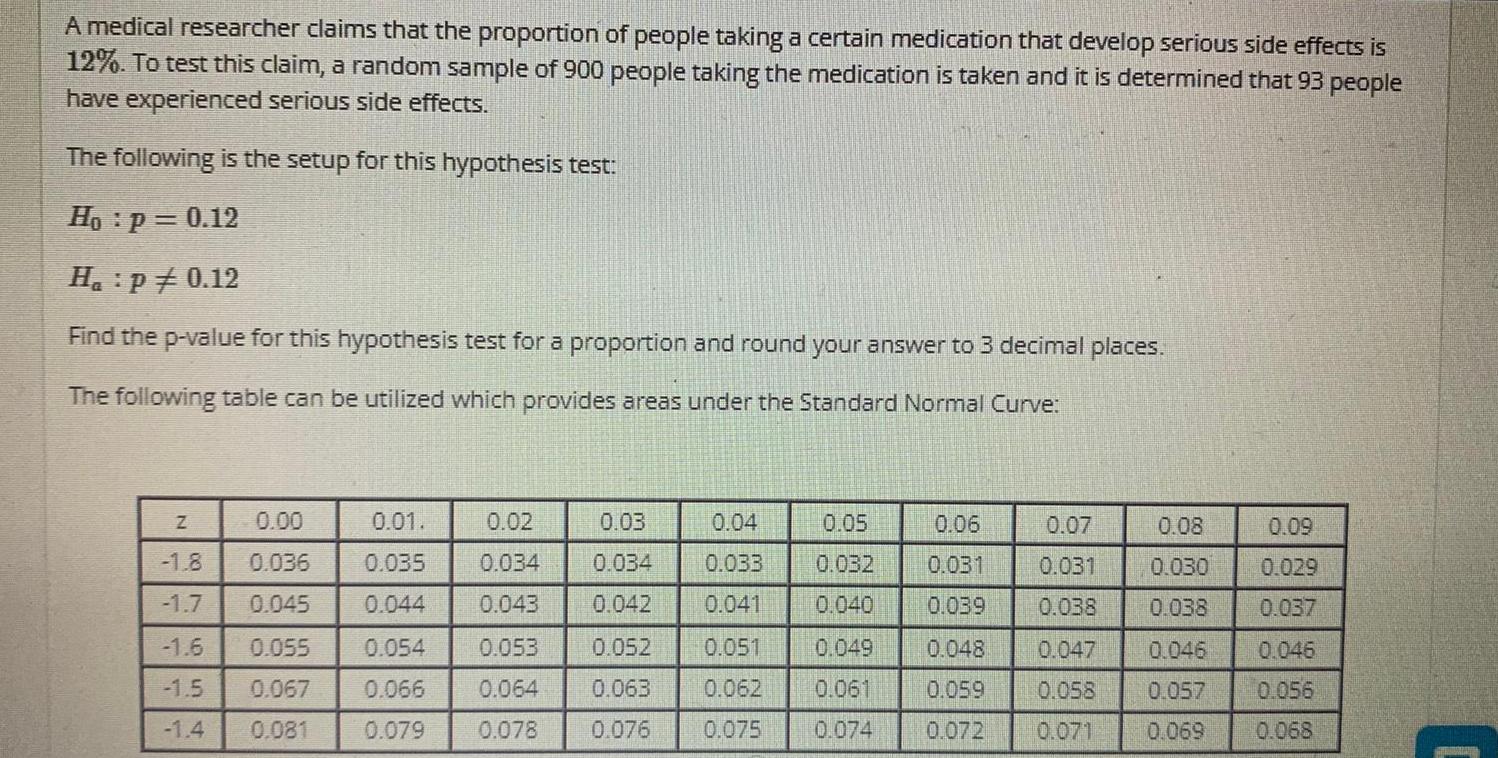
StatisticsA medical researcher claims that the proportion of people taking a certain medication that develop serious side effects is 12 To test this claim a random sample of 900 people taking the medication is taken and it is determined that 93 people have experienced serious side effects The following is the setup for this hypothesis test Ho p 0 12 H p 0 12 Find the p value for this hypothesis test for a proportion and round your answer to 3 decimal places The following table can be utilized which provides areas under the Standard Normal Curve N 1 8 0 036 1 7 0 045 1 6 0 055 1 5 0 067 1 4 0 081 0 01 0 035 0 044 0 054 0 066 0 079 0 02 0 034 0 043 0 053 0 064 0 078 0 03 0 034 0 042 0 052 0 063 0 076 0 04 0 033 0 041 0 051 0 062 0 075 0 05 0 06 0 032 0 031 0 040 0 039 0 049 0 061 0 074 0 07 0 031 0 038 0 048 0 047 0 059 0 058 0 072 0 071 0 08 0 030 0 038 0 046 0 057 0 069 0 09 0 029 0 037 0 046 0 056 0 068
Statistics
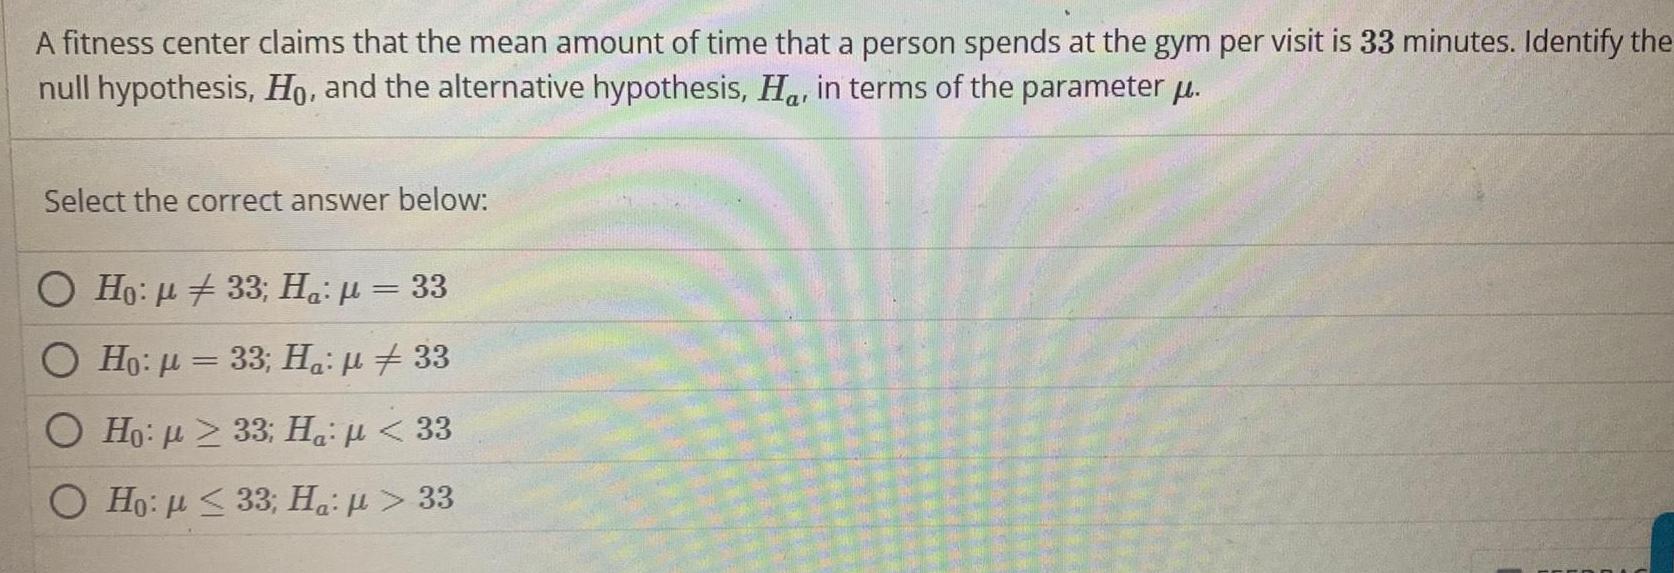
StatisticsA fitness center claims that the mean amount of time that a person spends at the gym per visit is 33 minutes Identify the null hypothesis Ho and the alternative hypothesis Ha in terms of the parameter u Select the correct answer below O Ho 33 Ha 33 O Ho 33 Ha 33 O Ho 33 Ha 33 Ho p 33 Ha u 33

Statistics
StatisticsWhich of the following results in the null hypothesis 38 and alternative hypothesis 38 Select the correct answer below A fitness center claims that the mean amount of time that a person spends at the gym per visit is at most 38 minutes A fitness center claims that the mean amount of time that a person spends at the gym per visit is fewer than 38 minutes A fitness center claims that the mean amount of time that a person spends at the gym per visit is 38 minutes A fitness center claims that the mean amount of time that a person spends at the gym per visit is more than 38 O minutes FEEDBA
Statistics
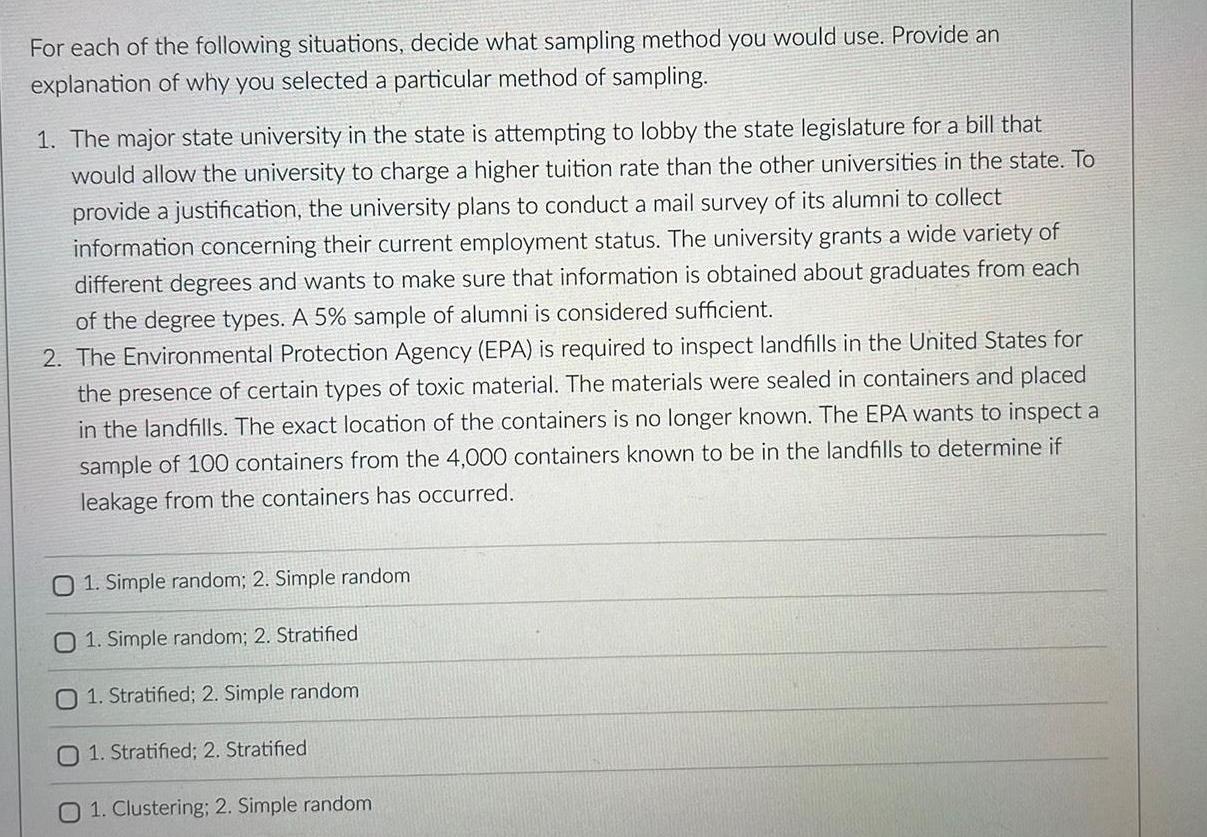
StatisticsFor each of the following situations decide what sampling method you would use Provide an explanation of why you selected a particular method of sampling 1 The major state university in the state is attempting to lobby the state legislature for a bill that would allow the university to charge a higher tuition rate than the other universities in the state To provide a justification the university plans to conduct a mail survey of its alumni to collect information concerning their current employment status The university grants a wide variety of different degrees and wants to make sure that information is obtained about graduates from each of the degree types A 5 sample of alumni is considered sufficient 2 The Environmental Protection Agency EPA is required to inspect landfills in the United States for the presence of certain types of toxic material The materials were sealed in containers and placed in the landfills The exact location of the containers is no longer known The EPA wants to inspect a sample of 100 containers from the 4 000 containers known to be in the landfills to determine if leakage from the containers has occurred O 1 Simple random 2 Simple random 01 Simple random 2 Stratified O 1 Stratified 2 Simple random O 1 Stratified 2 Stratified 1 Clustering 2 Simple random

Statistics
StatisticsA study was conducted to determine if the inclusion of a foreign language requirement in high schools may have a positive effect on students performance on standardized English exams From a sample of 100 high schools 50 of which had a foreign language requirement and 50 of which did not it was found that the average score on the English proficiency exam was 25 higher for the students having a foreign language requirement What confounding variables may be present that would invalidate the conclusion that requiring a foreign language in high school increases English language proficiency
Statistics
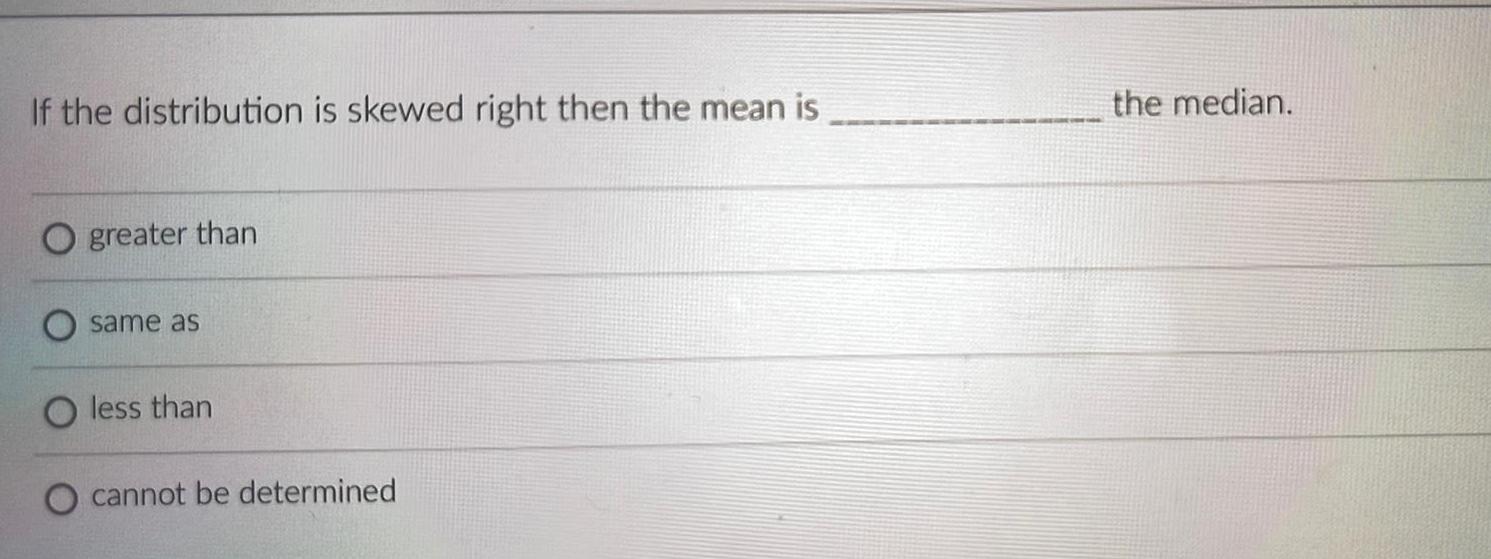
StatisticsIf the distribution is skewed right then the mean is greater than same as O less than cannot be determined the median
Statistics
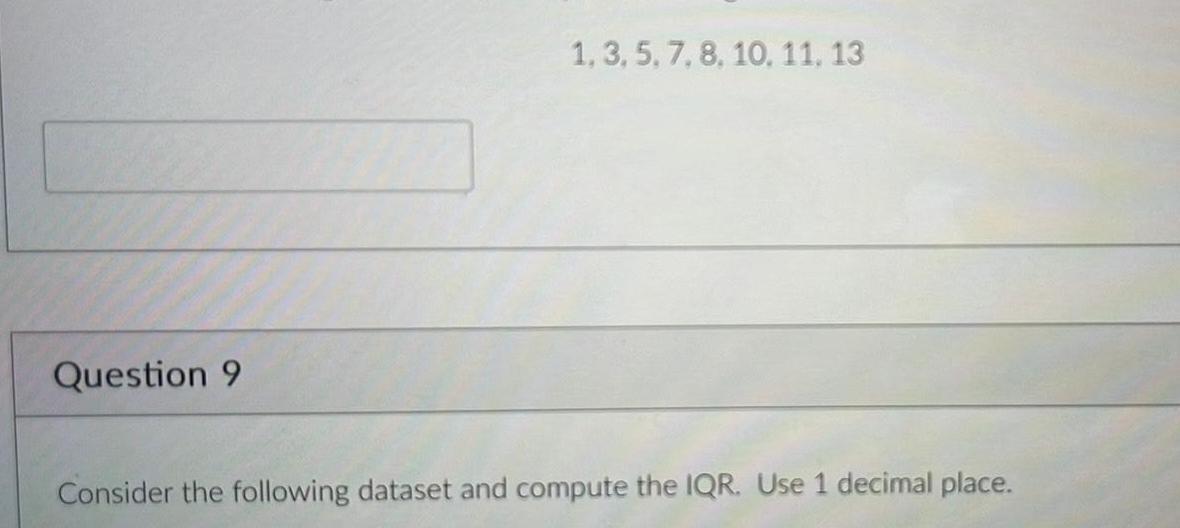
StatisticsQuestion 9 1 3 5 7 8 10 11 13 Consider the following dataset and compute the IQR Use 1 decimal place
Statistics
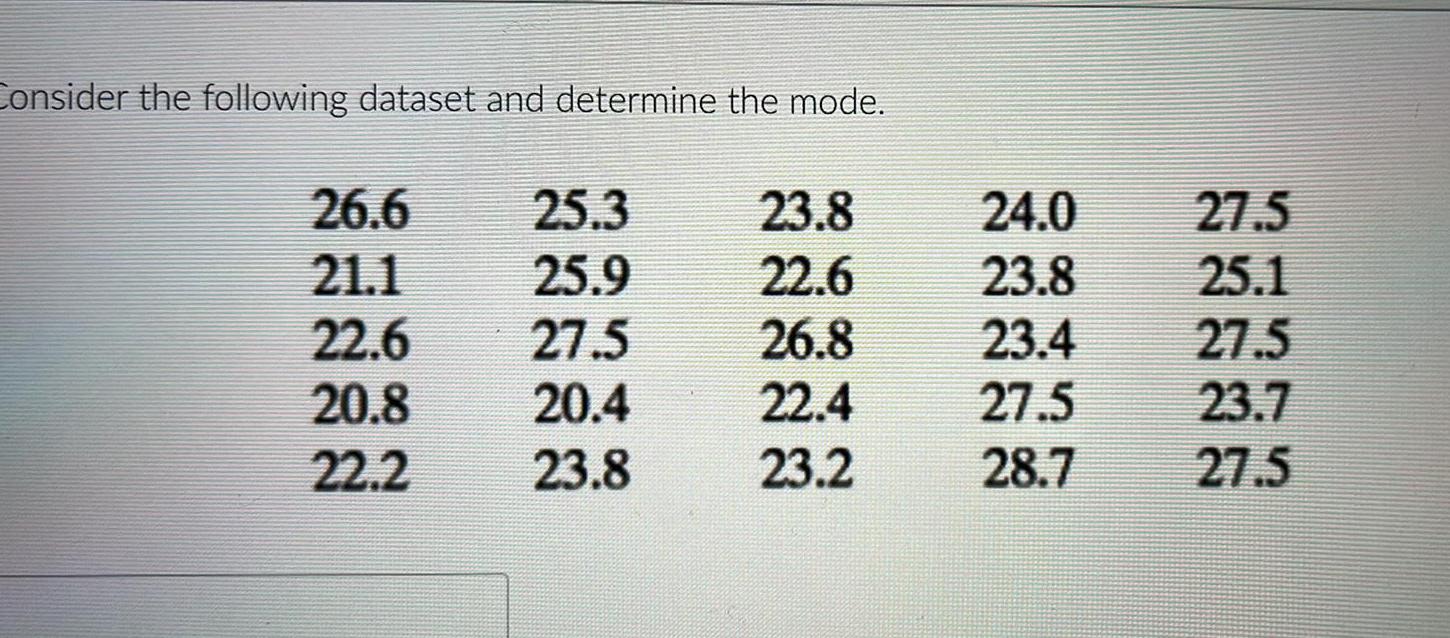
StatisticsConsider the following dataset and determine the mode 26 6 21 1 22 6 20 8 22 2 25 3 25 9 27 5 20 4 23 8 23 8 22 6 26 8 22 4 23 2 24 0 23 8 23 4 27 5 28 7 27 5 25 1 27 5 23 7 27 5

Statistics
StatisticsConsider the following dataset and compute the standard deviation Use 1 decimal place 1 3 5 7 8 10 11 13

Statistics
ProbabilityConsider the following dataset and determine the median 95 86 78 90 62 73 89 92 84 76
Statistics
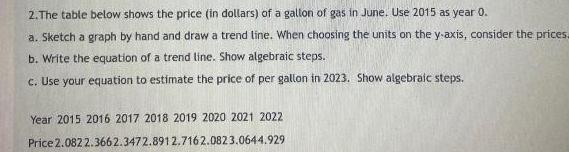
Statistics2 The table below shows the price in dollars of a gallon of gas in June Use 2015 as year 0 a Sketch a graph by hand and draw a trend line When choosing the units on the y axis consider the prices b Write the equation of a trend line Show algebraic steps c Use your equation to estimate the price of per gallon in 2023 Show algebraic steps Year 2015 2016 2017 2018 2019 2020 2021 2022 Price 2 082 2 3662 3472 891 2 7162 0823 0644 929

Statistics
ProbabilityA company has both male and female employees The company has shirts and jackets with the company logo to give away to employees For each of the company s 193 employees a manager asked which piece of clothing the employee prefers The preferences based on gender are summarized in the table below Shirt Jacket 45 66 Female 7 75 Male Suppose an employee of the company is chosen at random Answer each part Do not round intermediate computations and round your answers to the nearest hundredth a What is the probability that the employee is female b What is the probability that the employee is female or prefers a jacket X
Statistics
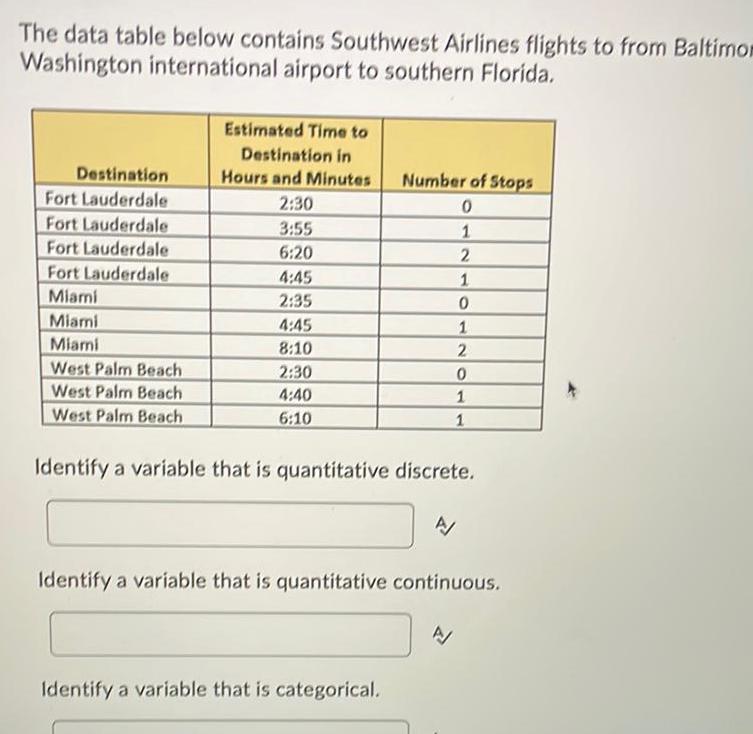
StatisticsThe data table below contains Southwest Airlines flights to from Baltimor Washington international airport to southern Florida Destination Fort Lauderdale Fort Lauderdale Fort Lauderdale Fort Lauderdale Miami Miami Miami West Palm Beach West Palm Beach West Palm Beach Estimated Time to Destination in Hours and Minutes 2 30 3 55 6 20 4 45 2 35 4 45 8 10 2 30 4 40 6 10 Number of Stops 0 1 2 Identify a variable that is quantitative discrete Identify a variable that is categorical 1 0 1 2 0 1 1 A Identify a variable that is quantitative continuous A

Statistics
ProbabilityPre school Attendance and Pre algebra Achievement In these times of educational reform attention has been focused on pre school for all children Since many districts are facing budget cuts funding pre school programs may impact other offerings Before making their recommendations administrators in a large urban district take a random sample of 50 seventh graders and compare the pre algebra achievement levels of those who attended pre school and those who did not If achievement is independent of attending pre school then the proportions at each level should be equal Use the counts in the frequency table to determine if there is an association between attending pre school and pre algebra achievement Pre school No Pre school DF 1 2 3 4 5 6 7 8 9 10 P Below grade level 8 6 0 995 0 975 0004 0 01 0 0717 0 207 0 412 0 676 0 989 1 344 1 735 2 156 0 2 00016 1 642 0 0506 3 219 0 216 4 642 0 484 0 831 1 237 1 69 9 803 2 18 11 03 2 7 3 247 At grade Level 6 15 5 989 7 779 7 289 8 558 0 1 2 706 3 841 5 024 4 605 5 991 7 378 6 251 7 815 9 348 9 488 11 149 9 236 11 07 12 833 10 645 12 592 14 449 12 017 14 067 16 013 13 362 15 507 17 535 16 919 19 023 18 307 20 483 0 05 12 242 14 684 13 442 15 987 Advanced 6 19 0 025

Statistics
ProbabilitySuppose you are planning to collect data for a catering company Identify a potential quantitative variable that you could collect

Statistics
ProbabilityB 80 200 240 Weight Proble 4 User Settings Grades Problems 300 Problem 1 Problem 2 Problem 3 Problem 4 Problem 5 Problem 6 B 900 1 point The histogram below displays the weights for a certain group o a What is the width of the bins in this histogram b The bar centered over 160 includes people whose weights are between and c Is this distribution symmetric skewed to the left or skewed to the right E if symmetric 2 if skewed to the left and 3 if skewed to the right Note You can earn partial credit on this problem

Statistics
ProbabilityBONUS Consider the following situation You want to survey a sample of registered voters about their opinions on raising taxes Please explain how you could use a stratified sampling approach to accomplish this

Statistics
ProbabilityThe width of the box is Part 1 of 2 feet An open rectangular box is 3 feet long and has a surface area of 16 square feet Find the dimensions of the box for which the volume is as large as possible O Points 0 of 1 4 of 23 points

Statistics
StatisticsIdentify the following as an experiment or observational study Researchers wanted to determine the effectiveness of a digital interactive multimedia tutorial DIMT for preparing veterinary students to perform ultrasonography in horses They randomly assigned 42 third year veterinary students into one of three instructional methods independent study lecture or digital interactive multimedia tutorial Written and practical tests were administered after each instruction session For the practical test each student was required to obtain a series of ultrasound images on a live horse and the images were scored for quality by an individual unaware of the instructional method used Observational Study Experiment

Statistics
StatisticsIdentify the following as an experiment or an observational study Veterinary scientists wanted to evaluate whether pigs with outdoor access on farms were commonly exposed to the bacteria Brucella suis They randomly selected 24 farms in New York State Participating farms were provided a questionnaire to complete and up to 30 pigs per farm were tested for serum anti Brucella antibodies Observational Study Experiment

Statistics
StatisticsWhat type of bias is present in this situation A community college wants to survey their students about their preferences of different learning modalities They do a survey of students that attended a lunch time BBQ Sampling bias Non response bias Response bias
Statistics
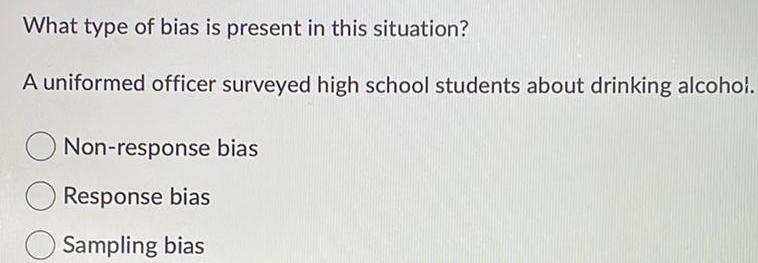
StatisticsWhat type of bias is present in this situation A uniformed officer surveyed high school students about drinking alcohol Non response bias Response bias Sampling bias

Statistics
ProbabilityCriminal justice researchers want to know if prison inmates in general have a lower average reading level compared to the general population What is the response variable in this situation O Classification of Reader inmate or general population Reading level Number of books Prison education

Statistics
StatisticsBaltimore County officials need a sample of households to survey about their recycling habits You randomly select 50 residential blocks in the county and then survey all homes on those blocks This is an example of what type of sampling Convenience sampling Stratified sampling Systematic sampling Random sampling Cluster sampling

Statistics
ProbabilityTo determine customers satisfaction with a new website management attempts to survey every 5th customer as they checkout This is an example of what type of sampling O Stratified sampling Cluster sampling Systematic sampling Random sampling Convenience sampling

Statistics
ProbabilityIn May 2020 Pew Research Center surveyed 10 957 Americans The results indicated that 65 of Americans think the U S government is doing too little to reduce the effects of climate change This statement represents a Statistic Parameter

Statistics
Statistics76 of U S states allow the sale of marijuana for medical purposes This statement represents a Parameter Statistic

Statistics
ProbabilityFifteen randomly selected passengers on a flight are asked about the quality of the flight attendants service Identify the population All the passengers that were on that flight The flight attendants that were on duty for that flight The fifteen randomly selected passengers

Statistics
StatisticsThe price of an Amtrak train ticket from New York City to Boston Identify the type of variable Categorical Quantitative Discrete Quantitative Continuous None of these
Statistics
StatisticsMemphis International Airport keeps a log of how many FedEx airplanes land at their airport daily Categorical O Quantitative Discrete Quantitative Continuous None of these

Statistics
ProbabilityFind the point s on the graph of y x 7x 5 X where the slope is 7 ACCED Type an ordered pair using integers or decimals Round the final answer to two decimal places as needed Round all intermediate values to two decimal places as needed comma to separate answers as needed

Statistics
StatisticsThe width of a rectangle is increasing at a rate of 9 inches per second and its length is increasing at the rate of 3 inches per second At what rate is the area of the rectangle increasing when its width is 7 inches and its length is 8 inches Hint Let W t and L t be the width and length respectively at time t The rate that the area of the rectangle is increasing is in s Simplify your answer
Statistics
StatisticsSuppose that x and y are related by the given equation and use implicit differentiation to determine 4 x y 7 dy dx

Statistics
StatisticsA function h x is defined in terms of a differentiable function f x Find an expression for h x h x 4f x h x 4f x 4f x 4f x 4f x Af x

Statistics
Statisticsybuje 901 101 918 1 An American history professor at a major university was interested in knowing the history literacy of college freshmen In particular he wanted to find what proportion of college freshmen at the university knew which country controlled the original 13 colonies prior to the American Revolution The professor sent a questionnaire to all freshman students enrolled in HIST 101 and received responses from 318 students out of the 7 500 students who were sent the questionnaire One of the questions was What country controlled the original 13 colonies atnsmissit bris nofset oldene prior to the American Revolution a What is the population of interest to the b What is the sampled population Sofessor 318 Students bianco 292 A snistros 2 A study was conducted to determine if the inclusion of a foreign language requirement in high schools may have a positive effect on students performance on standardized English exams From a sample of 100 high schools 50 of which had a foreign language requirement and 50 of which did not it was found that the average score on the English proficiency exam was 25 higher for the students having a foreign language requirement What confounding variables may be present that would invalidate the conclusion that requiring a foreign language in high school increases English language proficiency 1919b bns 1926t6b gniwollot 9rt 19 bizno 3 For each of the following situations decide what sampling method you would use Provide an explanation of why you selected a particular method of sampling a The major state university in the state is attempting to lobby the state legislature for a bill that would allow the university to charge a higher tuition rate than the others16918 6 universities in the state To provide a justification the university plans to conduct a mail survey of its alumni to collect information concerning their current employment status The university grants a wide variety of different degrees and wants to make sure that b information is obtained about graduates from each of the degree types A 5 sample of bns teasteb gniwollel silt sebleno 8 alumni is considered sufficient 936la b The Environmental Protection Agency EPA is required to inspect landfills in the United States for the presence of certain types of toxic material The materials were sealed in containers and placed in the landfills The exact location of the containers is no longer known The EPA wants to inspect a sample of 100 containers from the 4 000 containers known to be in the landfills to determine if leakage from the containers has occurred
Statistics
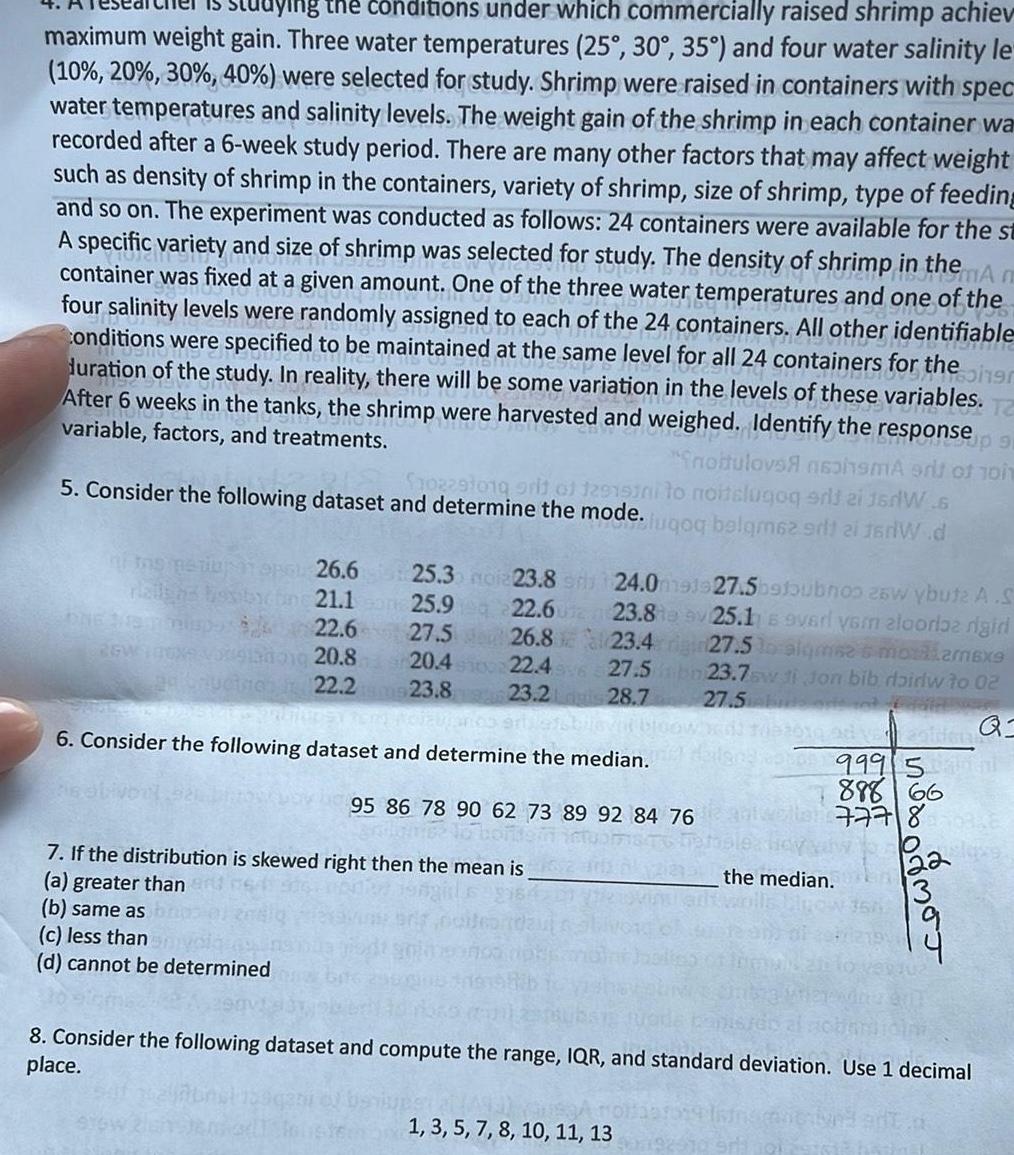
Statisticsying the conditions under which commercially raised shrimp achiev maximum weight gain Three water temperatures 25 30 35 and four water salinity le 10 20 30 40 were selected for study Shrimp were raised in containers with spec water temperatures and salinity levels The weight gain of the shrimp in each container wa recorded after a 6 week study period There are many other factors that may affect weight such as density of shrimp in the containers variety of shrimp size of shrimp type of feeding and so on The experiment was conducted as follows 24 containers were available for the st A specific variety and size of shrimp was selected for study The density of shrimp in the Am container was fixed at a given amount One of the three water temperatures and one of the four salinity levels were randomly assigned to each of the 24 containers All other identifiable Conditions were specified to be maintained at the same level for all 24 containers for the duration of the study In reality there will be some variation in the levels of these variables T After 6 weeks in the tanks the shrimp were harvested and weighed Identify the variable factors and treatments response up 91 noitulovs naohsmA erit of 1011 songr 5 Consider the following dataset and determine the mode fuqoq belgm62 srt 21 f rW d 102291019 prit of 129151ni to noitelugog srij zi jerW 6 2GW 26 6 25 3 noia23 8 21 1 25 9 22 6 23 8 26 823 4 22 46 27 5bn 23 2 28 7 22 6 27 5 vorgang 20 8 20 4 sms 23 8 22 2 6 Consider the following dataset and determine the median 95 86 78 90 62 73 89 92 84 76 7 If the distribution is skewed right then the mean is a greater than b same as c less than d cannot be determined 24 0m91927 5b9toubnoo 26w ybute A S 25 1 s ovari vom alooriaz nigiri 27 5 lo algmse s moralarexe 23 7sw di Jon bib doirlw to 02 27 5 or ot 10 2010 od volden Q 1 3 5 7 8 10 11 13 999 5l 888 66 777 836 uslaze NODO MOJ the median 8 Consider the following dataset and compute the range IQR and standard deviation Use 1 decimal place

Statistics
Statistics2 Here are the ages of the 40 students in the class 16 16 16 18 17 14 18 17 18 17 17 17 17 15 16 16 17 18 18 17 16 17 465 16 15 17 16 15 17 15 14 17 16 Summarize the age distribution with a frequency table and a relative frequency table
