Statistics Questions
The best high school and college tutors are just a click away, 24×7! Pick a subject, ask a question, and get a detailed, handwritten solution personalized for you in minutes. We cover Math, Physics, Chemistry & Biology.

Statistics
ProbabilityQ4 Question 1 26 Cont d One of the variables in the Drafting NFL Quarterbacks problem is Quarterback Production Score What type of variable is Quarterback Production Score 1 pt a Quantitative b Qualitative c Cannot tell from the problem statement

Statistics
ProbabilityThe histogram below gives the length of service of members of the Department of Chemistry at a particular university The classes in years of service are 0 4 9 5 9 9 etc and the vertical axis represents the number of faculty What percent of the department faculty have less than 25 years of service Answer 9 8 CO 7 6 12 5 4 3 2 1 8 5 12 18 15 Chemistry Faculty 28 25 38 35 48 Tt
Statistics
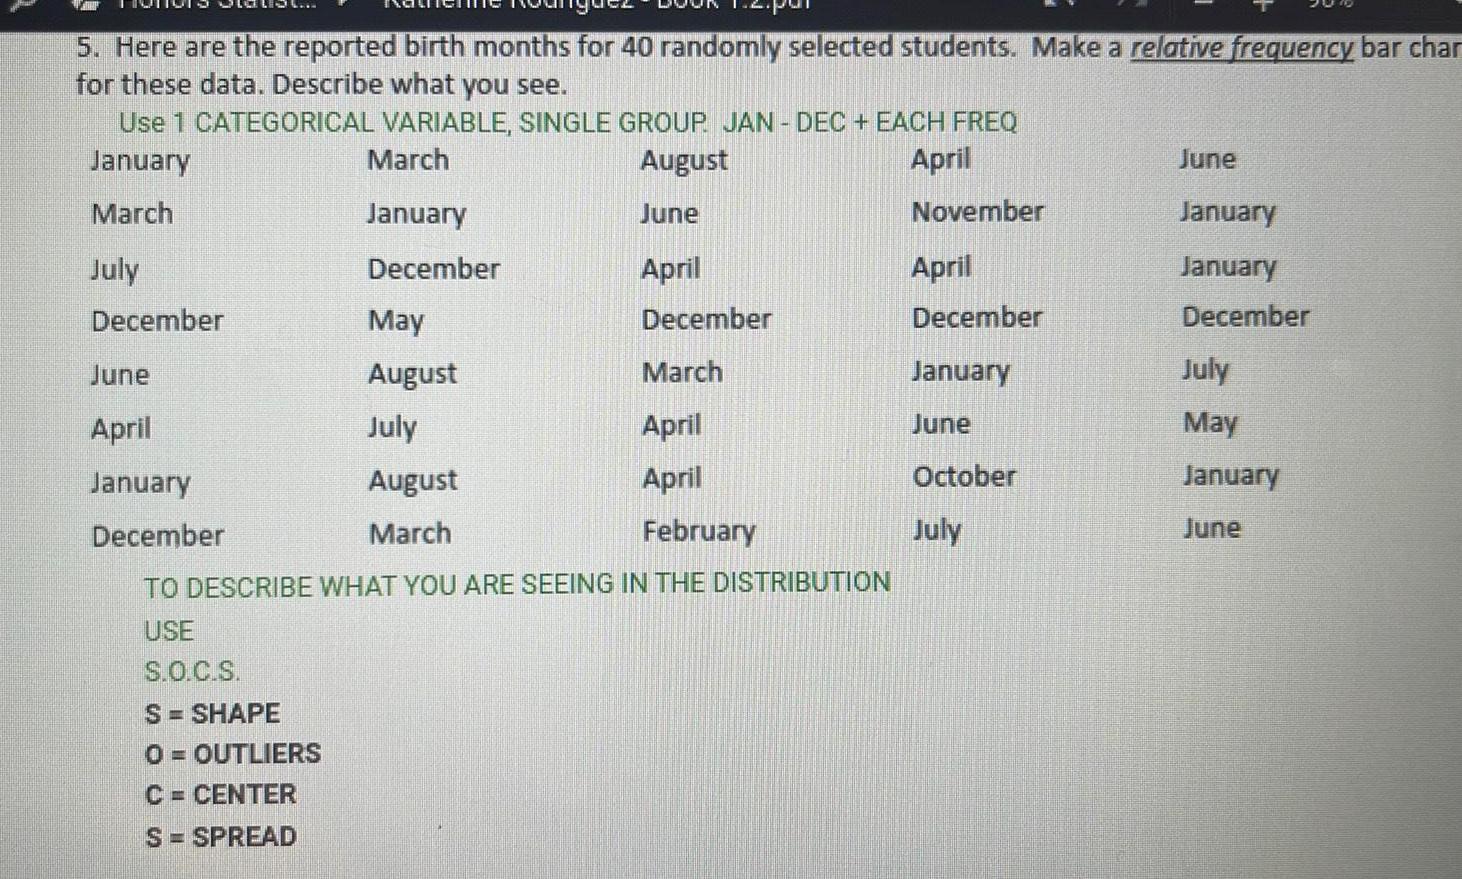
Statistics5 Here are the reported birth months for 40 randomly selected students Make a relative frequency bar char for these data Describe what you see Use 1 CATEGORICAL VARIABLE SINGLE GROUP JAN DEC EACH FREQ January March August April March January June November July December April December December March April April May August July August March June April January December February TO DESCRIBE WHAT YOU ARE SEEING IN THE DISTRIBUTION USE S O C S S SHAPE O OUTLIERS C CENTER S SPREAD April December January June October July June January January December July May January June

Statistics
StatisticsOBFW Publishers Researchers collected data on 76 brands of cereal at a local supermarket For each brand the sugar content grams per serving and the shelf in the store on which the cereal was located 1 bottom 2 middle 3 top were recorded A dotplot of the data is shown here Shelf 2 t Is the variability in sugar content of the cereals similar or different for the three shelves O The variability in the distributions of sugar content is similar for the three shelves because the minimums for all three shelves are exactly the same O The variability in the distributions of sugar content is similar for the three shelves because all three

Statistics
StatisticsYes because you can show the percent of babies born on each day of the week 4 Explain how each of the following graphs is misleading Number of students AGE BREAKDOWN OF SOCIAL MEDIA USERS 13 18 19 29 30 49 50 64 65 280 260 240 220 200 180 160 140 120 89 789 1 43 The age groups are all over the place they are not consistent No definitive asked It is the age breakdown of men Were women involved

Statistics
Statistics1 3 In 2014 Congress cut 8 7 billion from the Supplemental Nutrition Assistance Program SNAP more commonly referred to as food stamps The rationale for the decrease is that providing assistance to people will result in the next generation of citizens being more depend ent on the government for support Hoynes 2012 describes a study to evaluate this claim The study examines 60 782 families over the time period of 1968 to 2009 which is subsequent to the introduction of the Food Stamp Program in 1961 This study examines the impact of a posi tive and policy driven change in economic resources available in utero and during childhood on the economic health of individuals in adulthood The study assembled data linking family background in early childhood to adult health and economic outcomes The study concluded that the Food Stamp Program has effects decades after initial exposure Specifically access to food stamps in childhood leads to a significant reduction in the incidence of metabolic syndrome obesity high blood pressure and diabetes and for women an increase in eco nomic self sufficiency Overall the results suggest substantial internal and external benefits of SNAP a Identify the population that is of interest to the researchers b Describe the sample c What characteristics of the population are of interest to the researchers d If the sample measurements are used to make inferences about the population characteristics why is a measure of reliability of the inferences important

Statistics
Probabilityook int int ences Sydney Retailing buyer and Troy Wholesalers seller enter into the following transactions May 11 Sydney accepts delivery of 37 500 of merchandise it purchases for resale from Troy invoice dated May 11 terms 3 10 n 90 FOB shipping point The goods cost Troy 25 125 Sydney pays 435 cash to Express Shipping for delivery charges on the merchandise May 12 Sydney returns 1 200 of the 37 500 of goods to Troy who receives them the same day and restores them to its inventory The returned goods had cost Troy 804 May 20 Sydney pays Troy for the amount owed Troy receives the cash immediately Both Sydney and Troy use a perpetual inventory system and the gross method 1 Prepare journal entries that Sydney Retailing buyer records for these three transactions 2 Prepare journal entries that Troy Wholesalers seller records for these three transactions Complete this question by entering your answers in the tabs below Required 1 Required 2 Prepare journal entries that Sydney Retailing buyer records for these three transactions Check my we

Statistics
StatisticsNovember 1 Dollar Store purchases merchandise for 2 300 on terms of 2 5 n 30 FOB shipping point invoice dated November 1 November 5 Dollar Store pays cash for the November 1 purchase November 7 Dollar Store discovers and returns 250 of defective merchandise purchased on November 1 and paid for on November 5 for a cash refund November 10 Dollar Store pays 115 cash for transportation costs for the November 1 purchase November 13 Dollar Store sells merchandise for 2 484 with terms n 30 The cost of the merchandise is 1 242 November 16 Merchandise is returned to the Dollar Store from the November 13 transaction The returned items are priced at 230 and cost 115 the items were not damaged and were returned to inventory Journalize the above merchandising transactions for the Dollar Store assuming it uses a perpetual inventory system and the gross method View transaction list Journal entry worksheet 1 2 3 4 5 6 7 8 Dollar Store purchases merchandise for 2 300 on terms of 2 5 n 30 FOR

Statistics
StatisticsA data set of the ages of a sample of 325 Galapagos tortoises has a minimum value of 3 years and a maximum value of 125 years Suppose we want to group these data into five classes of equal width Assuming we take the lower limit of the first class as 3 years determine the class limits boundaries and midpoints for a grouped quantitative data table Hint To determine the class width subtract the minimum age 3 from the maximum age 125 divide by the number of classes 5 and round the solution to the next highest whole number Class width Class Limits to to to to Lower Boundary Upper Boundary Class Midpoint 2 5

Statistics
Statistics1 1 Hansen 2006 describes a study to assess the migration and survival of salmon released from fish farms located in Norway The mingling of escaped farmed salmon with wild salmon raises several concerns First the assessment of the abundance of wild salmon stocks will be biased if there is a presence of large numbers of farmed salmon Second potential interbreed ing between farmed and wild salmon may result in a reduction in the health of the wild stocks Third diseases present in farmed salmon may be transferred to wild salmon Two batches of farmed salmon were tagged and released in two locations one batch of 1 996 fish in northern Norway and a second batch of 2 499 fish in southern Norway The researchers recorded the time and location at which the fish were captured by either commercial fisherman or anglers in fresh water Two of the most important pieces of information to be determined by the study were the distance from the point of the fish s release to the point of its capture and the length of time it took for the fish to be captured a Identify the population that is of interest to the researchers b Describe the sample c What characteristics of the population are of interest to the researchers d If the sample measurements are used to make inferences about the population PROPERT FZR LO Af the intersnoo imparts The
Statistics
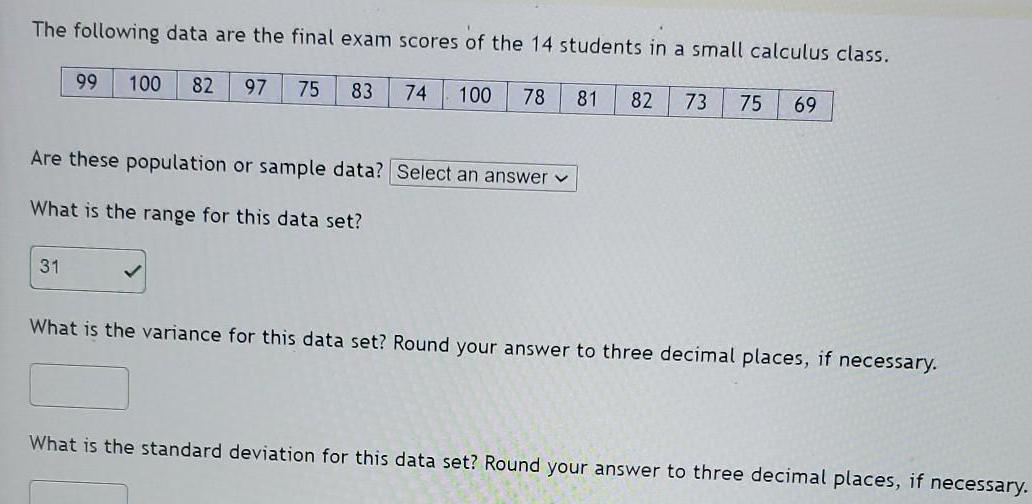
StatisticsThe following data are the final exam scores of the 14 students in a small calculus class 100 82 97 75 83 100 78 81 82 73 75 69 99 31 74 Are these population or sample data Select an answer What is the range for this data set What is the variance for this data set Round your answer to three decimal places if necessary What is the standard deviation for this data set Round your answer to three decimal places if necessary

Statistics
Statistics1 2 During 2012 Texas had listed on FracFocus an industry fracking disclosure site nearly 6 000 oil and gas wells in which the fracking methodology was used to extract natural gas Fontenot et al 2013 reports on a study of 100 private water wells in or near the Barnett Shale in Texas There were 91 private wells located within 5 km of an active gas well using fracking 4 private wells with no gas wells located within a 14 km radius and 5 wells outside of the Barnett Shale with no gas well located with a 60 km radius They found that there were elevated levels of potential contaminants such as arsenic and selenium in the 91 wells closest to natural gas extraction sites compared to the 9 wells that were at least 14 km away from an active gas well using the fracking technique to extract natural gas I a Identify the population that is of interest to the researchers b Describe the sample c What characteristics of the population are of interest to the researchers d If the sample measurements are used to make inferences about the population characteristics why is a measure of reliability of the inferences important
Statistics
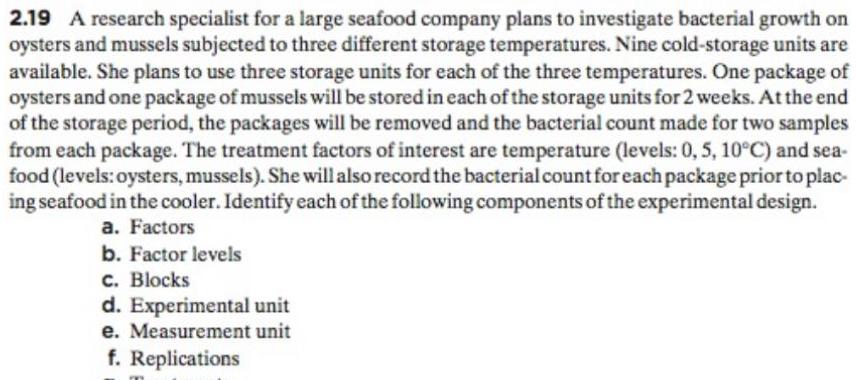
Probability2 19 A research specialist for a large seafood company plans to investigate bacterial growth on oysters and mussels subjected to three different storage temperatures Nine cold storage units are available She plans to use three storage units for each of the three temperatures One package of oysters and one package of mussels will be stored in each of the storage units for 2 weeks At the end of the storage period the packages will be removed and the bacterial count made for two samples from each package The treatment factors of interest are temperature levels 0 5 10 C and sea food levels oysters mussels She will also record the bacterial count for each package prior to plac ing seafood in the cooler Identify each of the following components of the experimental design a Factors b Factor levels c Blocks d Experimental unit e Measurement unit f Replications

Statistics
Statistics2 5 The board of directors of a city owned electric power plant in a large urban city wants to assess the increase in electricity demands due to sources such as hybrid cars big screen TVs and other entertainment devices in the home There are a number of different sampling plans that can be implemented to survey the residents of the city What are the relative merits of the follow ing sampling units individual families dwelling units single family homes apartment buildings etc and city blocks 2 6 A large auto parts supplier with distribution centers throughout the United States wants to survey its employees concerning health insurance coverage Employee insurance plans vary greatly from state to state The company wants to obtain an estimate of the annual health insur ance deductible its employees would find acceptable What sampling plan would you suggest to the company to achieve its goal 2 7 The circuit judges in a rural county are considering a change in how jury pools are selected for felony trials They ask the administrator of the courts to assess the county residents reaction to changing the requirement for membership in the jury pool from the current requirement of all registered voters to a new requirement of all registered voters plus all residents with a current driver s license The administrator sends questionnaires to a random sample of 1 000 people from the list of registered voters in the county and receives responses from 253 people a What is the population of interest b What is the sampling frame C What possible biases could be present in using the information from the survey

Statistics
Statistics2 9 Time magazine in an article in the late 1950s stated that the average Yaleman class of 1924 makes 25 111 a year which in today s dollars would be over 150 000 Time s estimate was based on replies to a sample survey questionnaire mailed to those members of the Yale class of 1924 whose addresses were on file with the Yale administration in the late 1950s a What is the survey s population of interest b Were the techniques used in selecting the sample likely to produce a sample that was representative of the population of interest c What are the possible sources of bias in the procedures used to obtain the sample d Based on the sources of bias do you believe that Time s estimate of the salary of a 1924 Yale graduate in the late 1950s is too high too low or nearly the correct value

Statistics
StatisticsSelect one answer Rainfall and corn crop yield reported for the 38 years from 1890 through 10 points 1927 give us the scatterplot shown below with an r 0 0426 Yield is the number of ears of corn measured in metric tons per hectare rainfall is in inches 45 40 35 g 25 20 15 9 Predictor Coef Constant Rain Crop Yield 11 13 Rain Based on corn crop yield from Ezekiel M and K A Fox 1959 Methods of Correlation and Regression Analysis Wiley New York The following edited output is available The regression equation is Yield 23 55 0 78 Rain 15 SE Coef T 23 55 3 24 17 0 7755 0 2938 2 6391 19 P 0 0122 Which of the following is an appropriate conclusion based on the output A O The data provide moderately strong evidence that crop yield is linearly related to rainfall B The data provide extremely strong evidence that crop yield is linearly related to rainfall C The data do not provide sufficient evidence to conclude that crop yield is linearly
Statistics
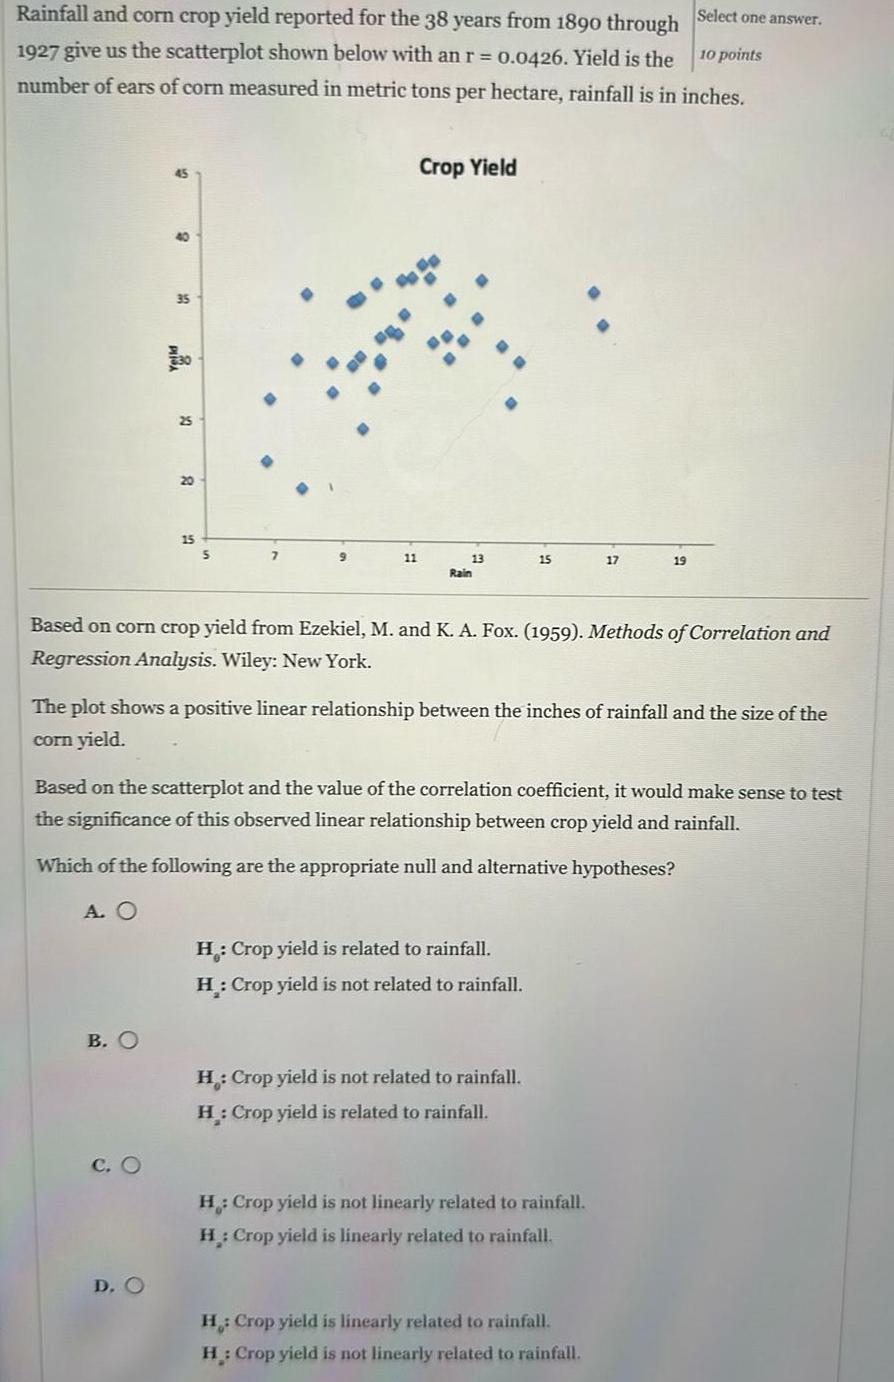
StatisticsSelect one answer 10 points Rainfall and corn crop yield reported for the 38 years from 1890 through 1927 give us the scatterplot shown below with an r 0 0426 Yield is the number of ears of corn measured in metric tons per hectare rainfall is in inches 25 20 B O 15 D O 5 9 11 Crop Yield 13 Rain Based on corn crop yield from Ezekiel M and K A Fox 1959 Methods of Correlation and Regression Analysis Wiley New York 15 The plot shows a positive linear relationship between the inches of rainfall and the size of the corn yield Based on the scatterplot and the value of the correlation coefficient it would make sense to test the significance of this observed linear relationship between crop yield and rainfall Which of the following are the appropriate null and alternative hypotheses A O H Crop yield is related to rainfall H Crop yield is not related to rainfall H Crop yield is not related to rainfall H Crop yield is related to rainfall 17 19 H Crop yield is not linearly related to rainfall H Crop yield is linearly related to rainfall H Crop yield is linearly related to rainfall H Crop yield is not linearly related to rainfall

Statistics
Statistics46 The article Effects Short Term warming on High Latitude Forest Ant Communities Ecoshpere May 2011 Article 62 described an experiment in which observations on various characteristics were made using minichambers of three different types 1 cooler PVC frames covered with shade cloth 2 control PVC frames only and 3 warmer PVC frames covered with plastic One of the article s authors kindly supplied the accompany ing data on the difference between air and soil temperatures C Cooler 1 59 1 43 1 88 1 26 1 91 1 86 1 90 1 57 1 79 1 72 2 41 2 34 0 83 1 34 1 76 Control 1 92 2 00 2 19 1 12 1 78 1 84 2 45 2 03 1 52 0 53 1 90 Warmer 2 57 2 60 1 93 1 58 2 30 0 84 2 65 0 12 2 74 2 53 2 13 2 86 2 31 1 91 a Compare measures of center for the three different samples b Calculate interpret and compare the standard devia tions for the three different samples c Do the fourth spreads for the three samples convey the same message as do the standard deviations about relative variability and d Construct a comparative boxplot which was includ ed in the cited article and comment on any interest ing features

Statistics
Statistics2 For each of the following hypothetical populations give a plausible sample of size 4 a All distances that might result when you throw a football b Page lengths of books published 5 years from now c All possible earthquake strength measurements Richter scale that might be recorded in California during the next year d All possible yields in grams from a certain chemi cal reaction carried out in a laboratory
Statistics
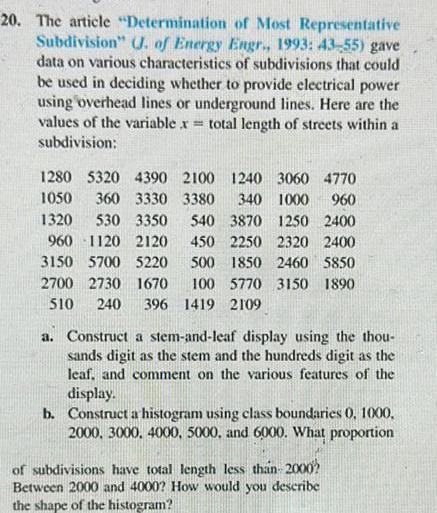
Statistics20 The article Determination of Most Representative Subdivision J of Energy Engr 1993 43 55 gave data on various characteristics of subdivisions that could be used in deciding whether to provide electrical power using overhead lines or underground lines Here are the values of the variable x total length of streets within a subdivision 1280 5320 4390 2100 1240 3060 4770 1050 360 3330 3380 340 1000 960 1320 530 3350 540 3870 1250 2400 960 1120 2120 450 2250 2320 2400 3150 5700 5220 500 1850 2460 5850 2700 2730 1670 100 5770 3150 1890 510 240 396 1419 2109 a Construct a stem and leaf display using the thou sands digit as the stem and the hundreds digit as the leaf and comment on the various features of the display b Construct a histogram using class boundaries 0 1000 2000 3000 4000 5000 and 6000 What proportion of subdivisions have total length less than 2000 Between 2000 and 4000 How would you describe the shape of the histogram
Statistics
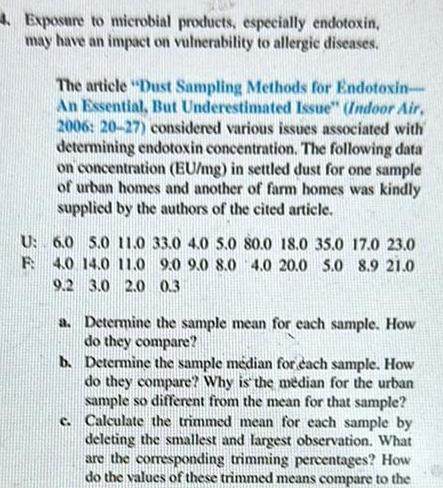
Statistics4 Exposure to microbial products especially endotoxin may have an impact on vulnerability to allergic diseases The article Dust Sampling Methods for Endotoxin An Essential But Underestimated Issue Indoor Air 2006 20 27 considered various issues associated with determining endotoxin concentration The following data on concentration EU mg in settled dust for one sample of urban homes and another of farm homes was kindly supplied by the authors of the cited article U 6 0 5 0 11 0 33 0 4 0 5 0 80 0 18 0 35 0 17 0 23 0 F 4 0 14 0 11 0 9 0 9 0 8 0 4 0 20 0 5 0 8 9 21 0 9 2 3 0 2 0 0 3 a Determine the sample mean for each sample How do they compare b Determine the sample m dian for each sample How do they compare Why is the median for the urban sample so different from the mean for that sample c Calculate the trimmed mean for each sample by deleting the smallest and largest observation What are the corresponding trimming percentages How do the values of these trimmed means compare to the

Statistics
StatisticsEraph the data and the equation on your calculator Adjust m and or b to get an eye ball best fit 0 7x 5 y X 2 0 X 3 y 6 6 5 2 6

Statistics
StatisticsDr Henry s colleague asks to collaborate on this spatial reasoning project But because he has tenure and knows he can continue data collection for an extensive period of time he decides to go to another daycare and sets up a plan to test 2 year olds in Spring Semester 2023 and then come test them again in Spring Semester 2024 when they are 3 years old and then again in Spring 2025 when they are 4 years old What developmental research design is this O longitudinal sequential O cross sectional O microdevelopment

Statistics
StatisticsTake Home Quiz 2 1 5 pts Interpreting and describing graphs Population in millions 350 300 250 200 150 100 50 O 1800 1840 Population of the United States 1880 Name Lindy Everette Year 1920 1960 2000 FIGURE 2 1 Source U S Bureau of the Census Statistical Abstract of the United States 2010 Looking at this graph give a 60 second summary 5 6 sentences discussing observations you see Include discussion points talked about this week Discuss other things you might notice pniaseros Steastsb erit not epris erit ai feriW b
Statistics
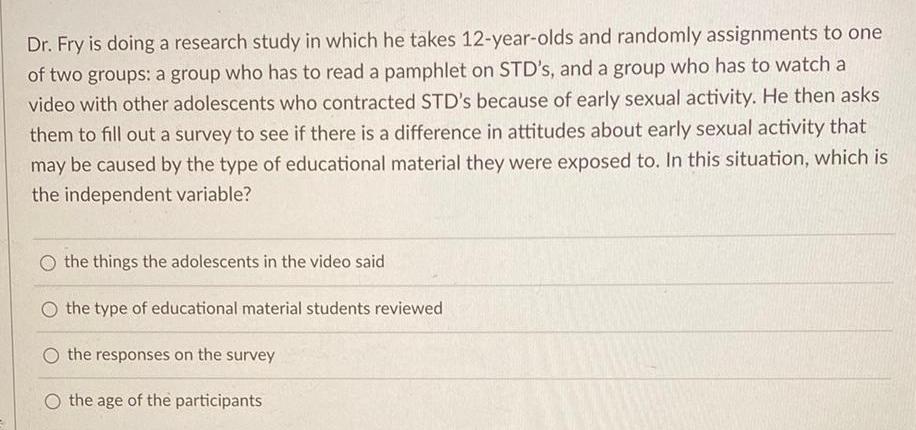
StatisticsDr Fry is doing a research study in which he takes 12 year olds and randomly assignments to one of two groups a group who has to read a pamphlet on STD s and a group who has to watch a video with other adolescents who contracted STD s because of early sexual activity He then asks them to fill out a survey to see if there is a difference in attitudes about early sexual activity that may be caused by the type of educational material they were exposed to In this situation which is the independent variable the things the adolescents in the video said O the type of educational material students reviewed O the responses on the survey O the age of the participants
Statistics
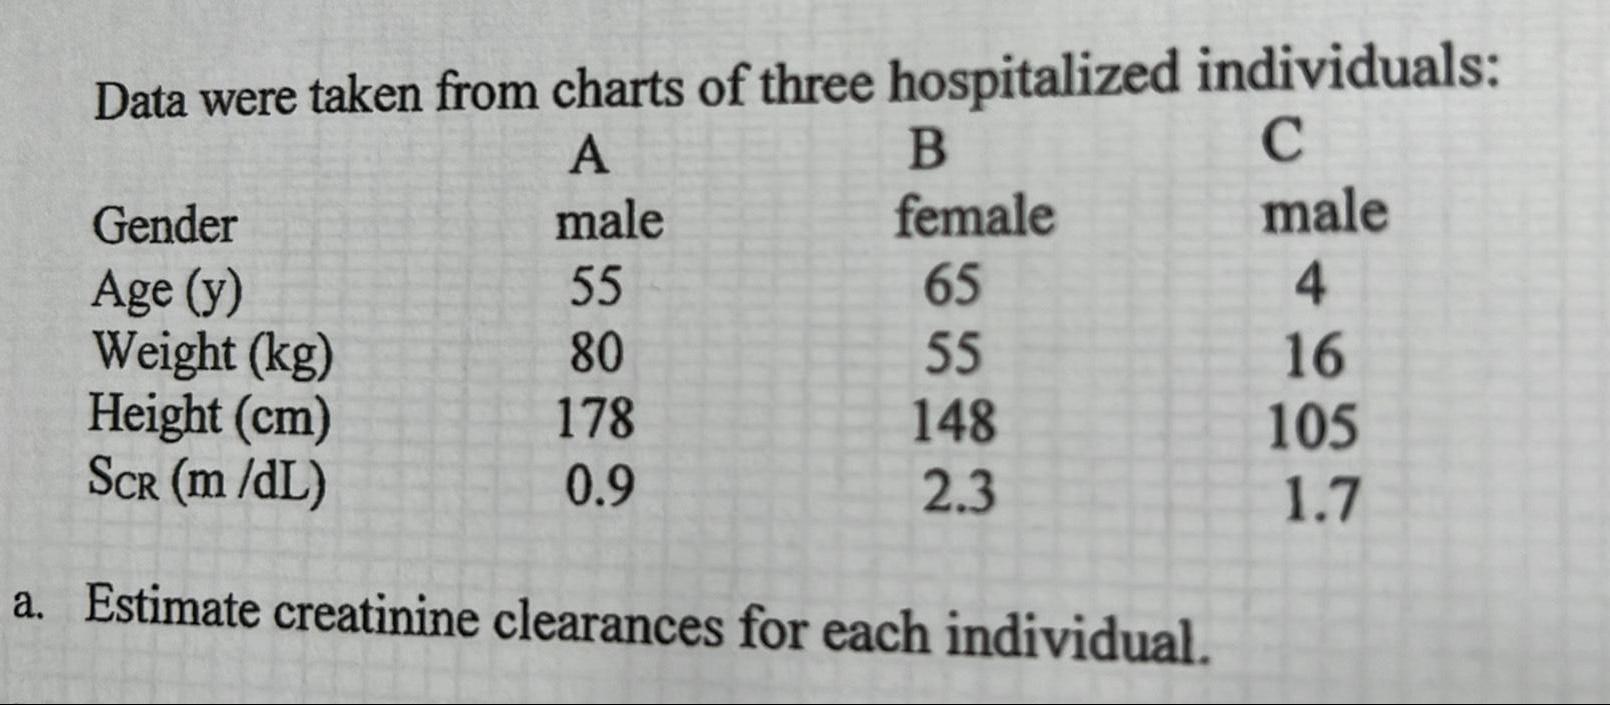
StatisticsData were taken from charts of three hospitalized individuals A male 55 80 178 0 9 B female 65 55 148 2 3 Gender Age y Weight kg Height cm SCR m dL a Estimate creatinine clearances for each individual C male 4 16 105 1 7

Statistics
ProbabilityThe graph of 4x4 8x y 4y4 36x 36y is a lemniscate dy a Find by implicit differentiation dx b Find the slope of the tangent line to the lemniscate at 5 1 a dy dx

Statistics
StatisticsThe advertising revenue is changing at a rate of oints 0 The monthly advertising revenue A and the monthly circulation x of a magazine are related approximately by the equation A 8 x 144 for x 12 where A is given in thousands of dollars and x is measured in thousands of copies sold At what rate is the advertising revenue changing if the current circulation is x 13 thousand copies and the circulation is growing at the rate of 5 thousand dA dA dx copies per month Hint Use the chain rule dt dx dt thousand dollars per month Save

Statistics
StatisticsUse implicit differentiation of the equation below to determine the slope of the graph at the given point xy 49 x 1 49 Y 7 The slope of the graph at the given point is Simplify your answer O F

Statistics
Statisticsdy Suppose that x and y are both differentiable functions of t and are related by the given equation Use implicit differentiation with respect to t to determine in terms of x y and dt dt 4xy 4x dx dt dx dt 10

Statistics
Probability3 Homework K Question 17 3 3 20 Use the implicit differentiation of the equation to determine the slope of the graph at the given point y x 41 x 2 y 7 The slope of the graph at the given point is Type an integer or a simplified fraction Points
Statistics
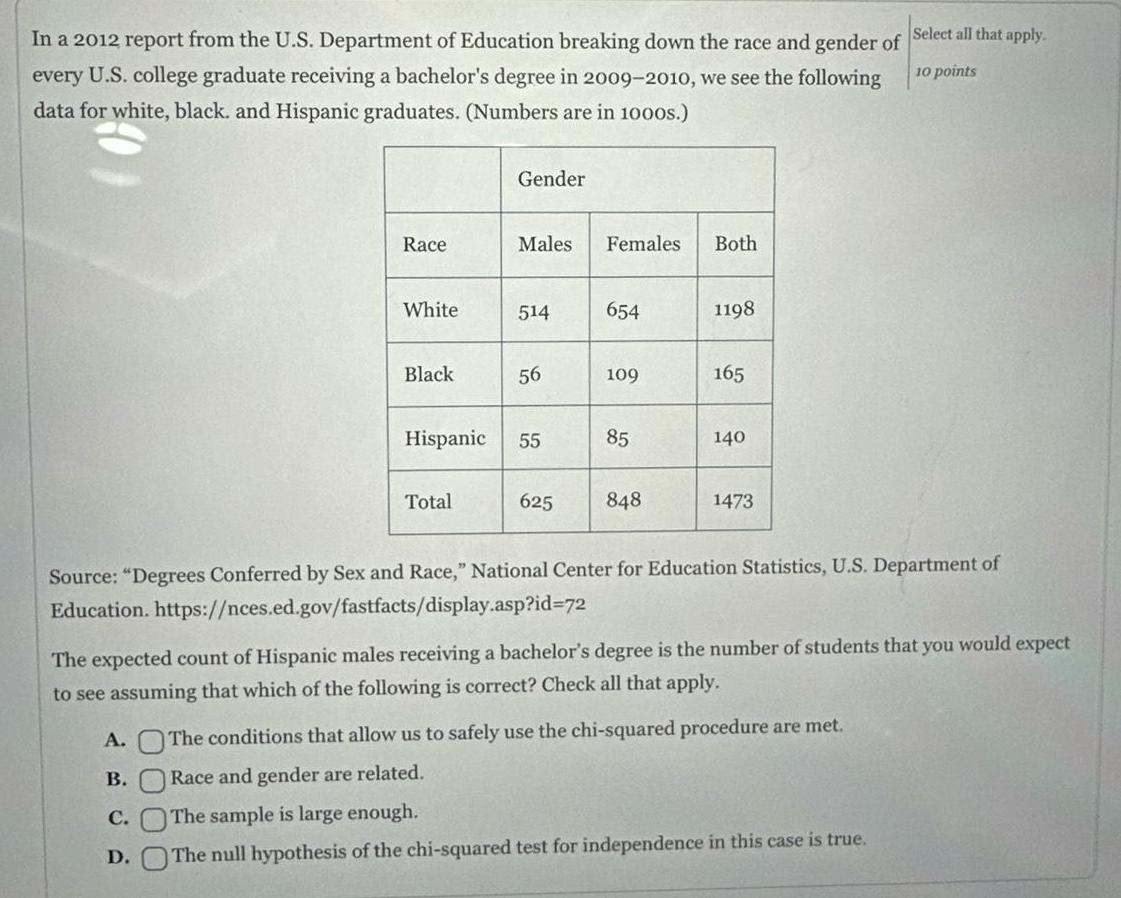
StatisticsIn a 2012 report from the U S Department of Education breaking down the race and gender of Select all that apply every U S college graduate receiving a bachelor s degree in 2009 2010 we see the following data for white black and Hispanic graduates Numbers are in 1000s 10 points A B Race C White D Black Gender Total Males Females 514 56 Hispanic 55 654 109 85 625 848 Both 1198 Source Degrees Conferred by Sex and Race National Center for Education Statistics U S Department of https nces ed gov fastfacts display asp id 72 Education 165 The expected count of Hispanic males receiving a bachelor s degree is the number of students that you would expect to see assuming that which of the following is correct Check all that apply 140 1473 The conditions that allow us to safely use the chi squared procedure are met Race and gender are related The sample is large enough The null hypothesis of the chi squared test for independence in this case is true

Statistics
StatisticsThe mortality rate from melanoma skin cancer pating the 1950s was recorded for each of the Select one answer 10 points 48 contiguous United States plus Washington D C as reported by Fisher and Van Belle 1993 and found at http www stat psu edu lsimon stat501wc sp05 data The following is the scatterplot of the data Mortality per 10 million 225 200 175 150 125 100 The following output is available 30 35 Predictor Constant Lat Scatterplot Latitude r 83 45 Regression Analysis Mort versus Lat The regression equation is Mort 389 5 98 Lat P Coef SE Coef T 389 19 23 81 16 34 0 000 5 9776 0 5984 9 99 0 000 Which of the following is an appropriate conclusion based on the output A The data do not provide sufficient evidence to conclude that melanoma mortality rate is linearly related latitude B The data provide extremely strong evidence that melanoma mortality rate is linearly related latitude

Statistics
StatisticsBased on corn crop yield from Ezekiel M and K A Fox 1959 Methods of Correlation and Regression Analysis Wiley New York The plot shows a positive linear relationship between the inches of rainfall and the size of the corn yield Based on the scatterplot and the value of the correlation coefficient it would make sense to test the significance of this observed linear relationship between crop yield and rainfall Which of the following are the appropriate null and alternative hypotheses A O B O C O D O H Crop yield is related to rainfall H Crop yield is not related to rainfall H Crop yield is not related to rainfall H Crop yield is related to rainfall H Crop yield is not linearly related to rainfall H Crop yield is linearly related to rainfall H Crop yield is linearly related to rainfall H Crop yield is not linearly related to rainfall Rainfall and corn crop yield reported for the 38 years from 1890 through 1927 give us the catterplot shown below with an r 0 0426 Yield is the number of ears of corn measured in metric tons per hectare rainfall is in inches 40 35 25 20 Crop Yield Select one answer 10 points

Statistics
StatisticsA researcher wants to explore the relationship between the following two variables Weight 1 and Weight 2 Weight 1 130 160 220 125 205 Weight 2 138 156 224 119 213 A O Two independent samples B Inference for regression C O Matched pairs Select one answer 10 points Suppose that Weight 1 is the weight in pounds of a sample of five individuals before beginning a weight loss diet and Weight 2 is the weight in pounds of the same five individuals after the diet If we would like to test the effectiveness of the diet which of the following is the appropriate inference method to analyze these data

Statistics
Statistics10 points A researcher wanted to see if there was a white coat effect where a patient s systolic blood pressure was higher when it was taken at a doctor s office rather than at home Patients were given a small blood pressure machine and told to take a measurement while they were at home and then they took another measurement with the same machine while at the doctor s office The results are shown below for 16 patients taking their own blood pressure at home and at the doctor s office Subject 1 2 3 4 5 6 A O ANOVA B OTwo sample t test C O Inference for regression D O Matched pairs t test E O Chi squared test for independence 7 8 9 10 11 12 13 14 15 16 17 Home 134 139 144 115 127 110 120 146 151 124 154 127 148 150 153 144 132 Doctor s Office 160 139 148 154 136 149 133 164 130 135 139 157 170 165 134 157 158 Which of the following is the most appropriate statistical test to use to determine the impact of the two different locations on a patient s blood pressure

Statistics
ProbabilitySuppose an economist wishes to determine the relationship between the age and price of houses A study yields the following data A B O Matched pairs C Inference for regression Two independent samples Worksheet 1 C1 1 2 3 4 5 27 74864 49 35 51 42 C2 87886 48 63 50 72 55 If column 1 is the price in hundreds of thousands of dollars of a sample of five houses from ten years ago and column 2 is the price in hundreds of thousands of dollars of the same homes today which of the following is the appropriate inference method to analyze these data Select one answer 10 points

Statistics
ProbabilityCAL BIOCHEMISTRY 72 248 254 1976 apid and Sensitive Method for the Quantitation of Microgram Quantities of Protein Utilizing the Principle of Protein Dye Binding MARION M BRADFORD Reproduction Research Laboratories Department of Biochemistry University of Georgia Athens Georgia 30602 Received September 11 1975 accepted January 29 1976 A protein determination method which involves the binding of Coomassie rilliant Blue G 250 to protein is described The binding of the dye to protein auses a shift in the absorption maximum of the dye from 465 to 595 nm and is the increase in absorption at 595 nm which is monitored This assay is ery reproducible and rapid with the dye binding process virtually complete in pproximately 2 min with good color stability for 1 hr There is little or no nterference from cations such as sodium or potassium nor from carbohydrates uch as sucrose A small amount of color is developed in the presence of trongly alkaline buffering agents but the assay may be run accurately by the use of proper buffer controls The only components found to give excessive nterfering color in the assay are relatively large amounts of detergents such as sodium dodecyl sulfate Triton X 100 and commercial glassware detergents Interference by small amounts of detergent may be eliminated by the use of proper controls aboratory practice in protein purification often requires a rapid an sitive method for the quantitation of protein Methods presentl inal primary literature article that describes the Bradford Assay A rapid and sensitive method for the quantitation of microgram quantities of protein utilizing the principle of protein dye binding Then answer the questions below about the article 3 9 pts According to the article Coomassie Brilliant Blue G 250 can be red or blue a What causes the color change from red to blue b Approximately how long does it take for the color to change In the pre lab video instructions stated to incubate Bradford dye protein for 10 minutes According to Figure 3 in the paper how much would the absorbance change if I waited one hour to make my measurement 4 5 pts In the manuscript the author looks at a variety of substances to see if they interfere with the Bradford assay We will be using NaCl in our Buffer this semester Would 50 mM NaCl interfere with the assay at 595 nm Provide evidence for your answer

Statistics
ProbabilityA researcher wants to find out if U S adults still support the death penalty at a proportion of 0 64 as it was in 2003 This graph indicates the sampling distribution for the proportion of supporters in random samples of 25 adults The standard deviation is approximately 0 10 04 0 5 0 6 0 7 0 8 0 9 What is the approximate test statistic for p 0 84 A O 2 B O 1 C Oo D O1 E O2 Select one 10 points
Statistics
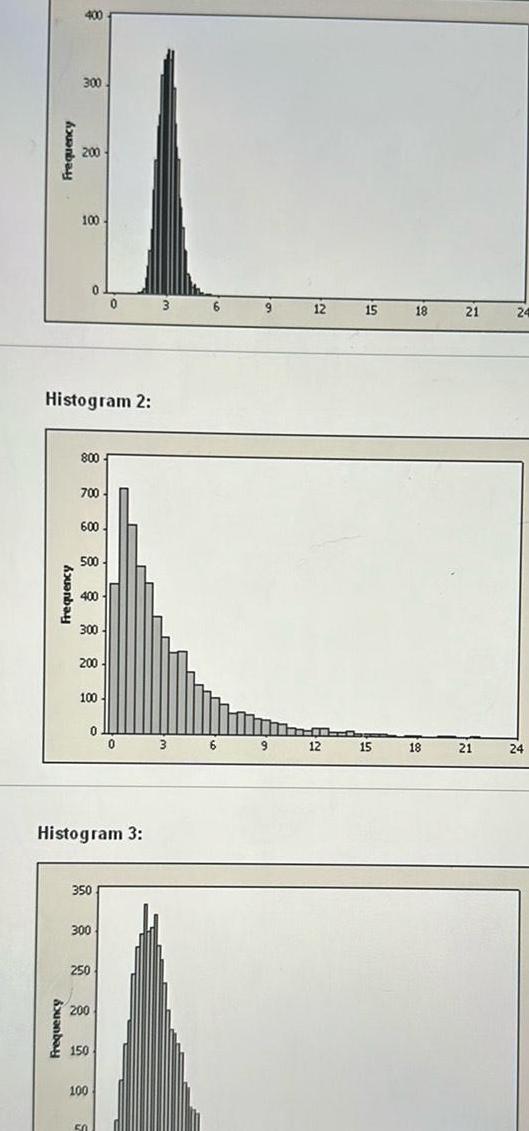
StatisticsFrequency Aanbay 400 300 Frequency 200 100 Histogram 2 800 700 600 500 400 300 200 100 Histogram 3 350 300 0 250 200 150 100 0 50 0 3 3 6 9 12 12 15 15 18 18 21 21 24 24

Statistics
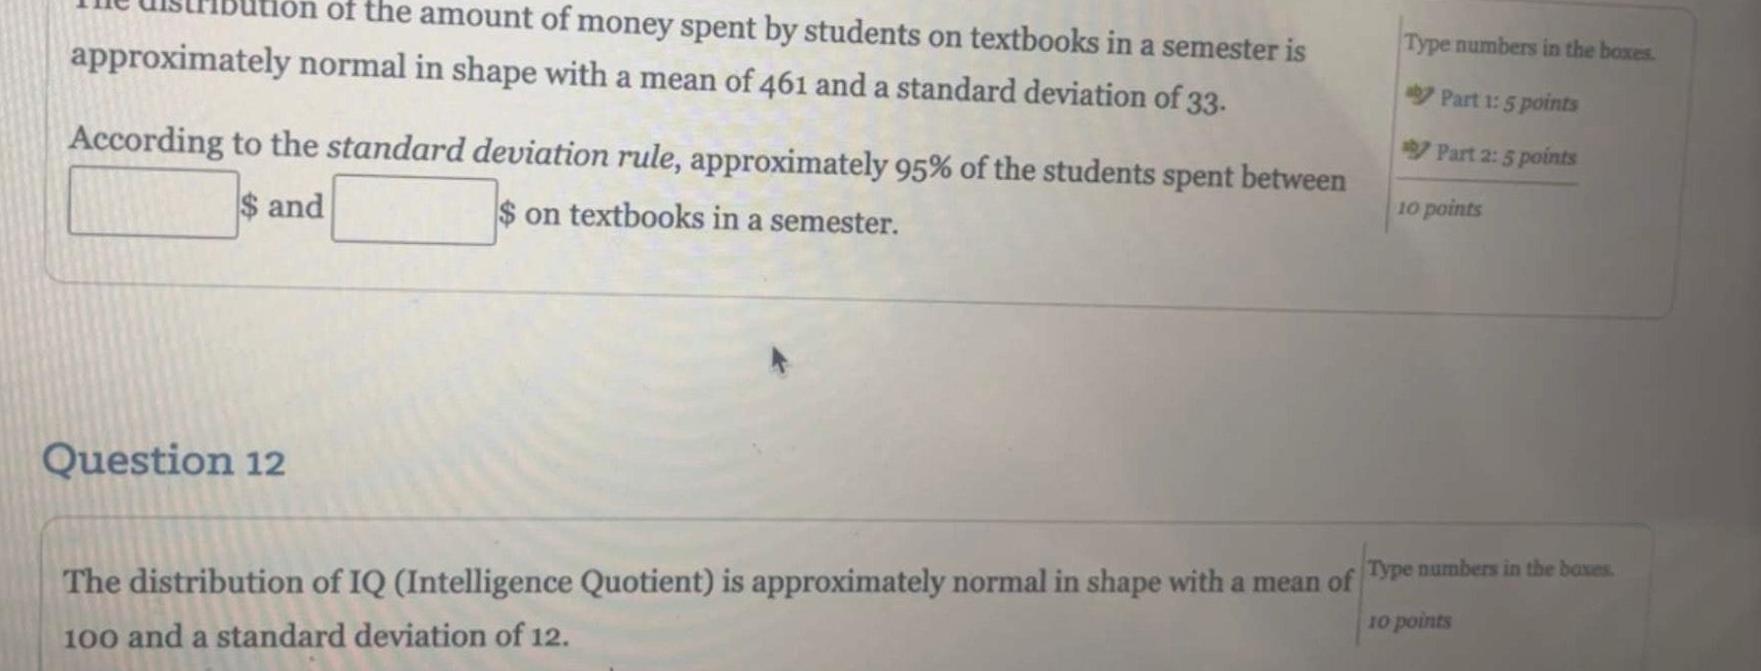
StatisticsThe distribution of IQ Intelligence Quotient is approximately normal in shape with a mean of Type numbers in the boxes 100 and a standard deviation of 12 10 points According to the standard deviation rule of people have an IQ between 88 and 112 Do not round
Statistics
Statisticson of the amount of money spent by students on textbooks in a semester is approximately normal in shape with a mean of 461 and a standard deviation of 33 According to the standard deviation rule approximately 95 of the students spent between on textbooks in a semester and Question 12 Type numbers in the boxes Part 1 5 points Part 2 5 points 10 points The distribution of IQ Intelligence Quotient is approximately normal in shape with a mean of Type numbers in the boxes 100 and a standard deviation of 12 10 points
Statistics
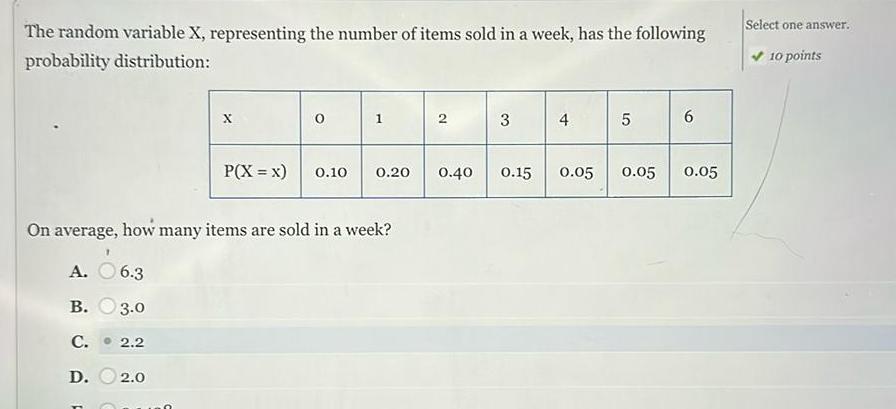
ProbabilityThe random variable X representing the number of items sold in a week has the following probability distribution D 2 0 X F 0 P X x 0 10 1 On average how many items are sold in a week A 6 3 B 3 0 C 2 2 0 20 2 0 40 3 0 15 4 5 0 05 0 05 6 0 05 Select one answer 10 points

Statistics
StatisticsMinimum Find the five number summary for Drug A Round to 2 decimal places Q3 Find the five number summary for Drug B Round to 2 decimal places Q3 Minimum Drug A 2 33 2 36 4 09 2 85 3 44 3 28 3 80 3 26 4 17 1 85 4 00 5 05 Drug B 9 36 7 39 4 51 6 03 7 22 4 14 5 19 Q1 Q1 Median Median 30 point 6 02 8 42 3 85 3 65 3 39 Maximum Maximum
Statistics
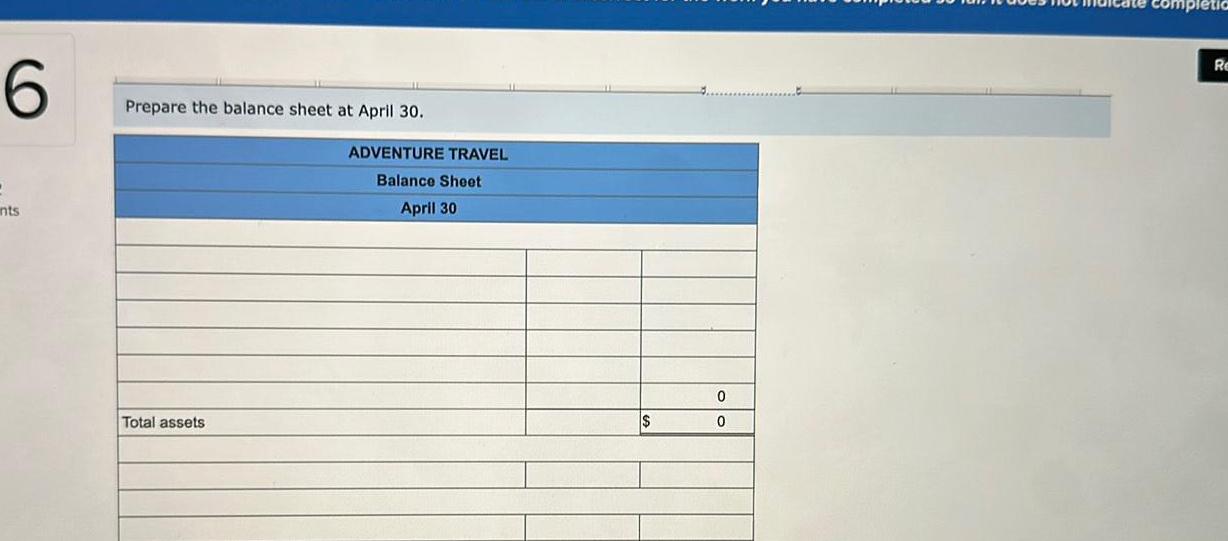
Statistics6 2 ints Prepare the balance sheet at April 30 Total assets ADVENTURE TRAVEL Balance Sheet April 30 0 0 completic Re

Statistics
StatisticsTravel times to work in New York State are on the average longer than in North Carolina Here are the travel times in minutes of 20 randomly chosen New York workers 10 30 5 25 40 20 10 15 30 20 15 20 85 15 65 15 60 60 40 45 A stemplot not only displays the distribution but also makes finding the median easy because it arranges the observations in order With n O 5 1 2 3 M 4 5 6 7 8 005555 0005 00 005 The distribution is single peaked and right skewed with several travel times of an hour or more There is no center observation but there is a center pair These are the bold 20 and 25 in the stemplot which have nine observations before them in the ordered list and nine after them The median is midway between these two observations 20 25 2 005 location of M 5 22 5 minutes JUZGON S S 20 the rule for locating the median in the list gives n 1 2 21 10 5 2

Statistics
Statistics13 Logging in the Rain Forest Conservationists have despaired over destruc tion of tropical rain forest by logging clearing and burning These words begin a report on a statistical study of the effects of logging in Borneo 2 Charles Can non of Duke University and his coworkers compared forest plots that had never been logged Group 1 with similar plots nearby that had been logged one year earlier Group 2 and eight years earlier Group 3 All plots were 0 1 hectare in area Here are the counts of trees for plots in each group LOGGING Group 1 27 22 29 21 19 33 16 20 24 Group 2 12 12 15 9 20 18 17 14 14 Group 3 18 4 22 15 18 19 22 12 12 To what extent has logging affected the count of trees Follow the four step 27 27 28 19 2 17 19