Statistics Questions
The best high school and college tutors are just a click away, 24×7! Pick a subject, ask a question, and get a detailed, handwritten solution personalized for you in minutes. We cover Math, Physics, Chemistry & Biology.
Statistics
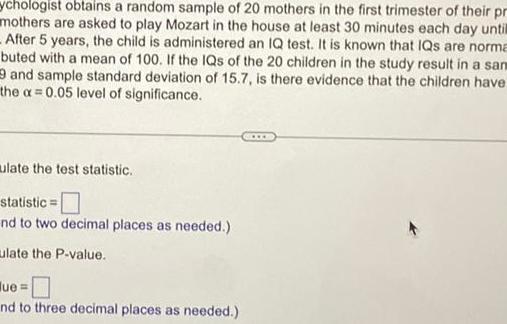
Statisticssychologist obtains a random sample of 20 mothers in the first trimester of their pr mothers are asked to play Mozart in the house at least 30 minutes each day until After 5 years the child is administered an IQ test It is known that IQs are norma buted with a mean of 100 If the IQs of the 20 children in the study result in a sam and sample standard deviation of 15 7 is there evidence that the children have the a 0 05 level of significance ulate the test statistic statistic nd to two decimal places as needed ulate the P value ue nd to three decimal places as needed www
Statistics
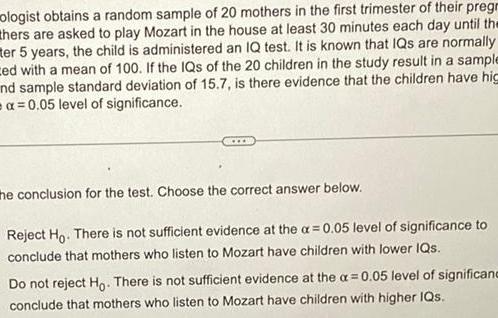
Statisticsologist obtains a random sample of 20 mothers in the first trimester of their pregr thers are asked to play Mozart in the house at least 30 minutes each day until the ter 5 years the child is administered an IQ test It is known that IQs are normally ced with a mean of 100 If the IQs of the 20 children in the study result in a sample nd sample standard deviation of 15 7 is there evidence that the children have hig a 0 05 level of significance the conclusion for the test Choose the correct answer below Reject Ho There is not sufficient evidence at the a 0 05 level of significance to conclude that mothers who listen to Mozart have children with lower IQs Do not reject Ho There is not sufficient evidence at the a 0 05 level of significanc conclude that mothers who listen to Mozart have children with higher IQs
Statistics
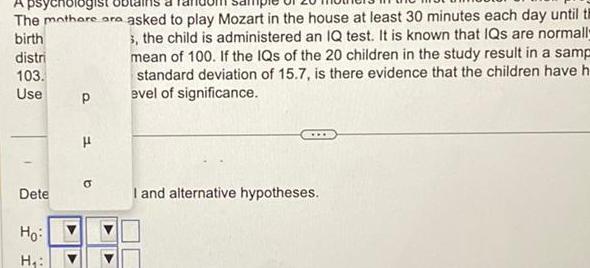
StatisticsA psychologist The mothere are asked to play Mozart in the house at least 30 minutes each day until th birth distri 3 the child is administered an IQ test It is known that IQs are normall mean of 100 If the IQs of the 20 children in the study result in a samp standard deviation of 15 7 is there evidence that the children have h evel of significance 103 Use 1 Dete Ho H P H I and alternative hypotheses
Statistics
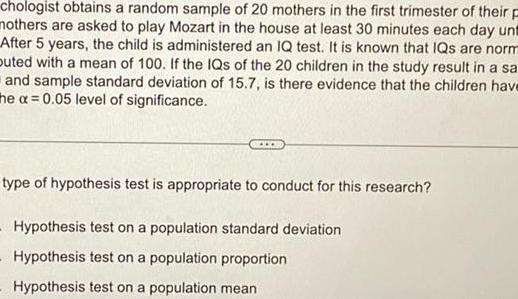
Statisticschologist obtains a random sample of 20 mothers in the first trimester of their p mothers are asked to play Mozart in the house at least 30 minutes each day unt After 5 years the child is administered an IQ test It is known that IQs are norm buted with a mean of 100 If the IQs of the 20 children in the study result in a sa and sample standard deviation of 15 7 is there evidence that the children have the a 0 05 level of significance type of hypothesis test is appropriate to conduct for this research Hypothesis test on a population standard deviation Hypothesis test on a population proportion Hypothesis test on a population mean
Statistics
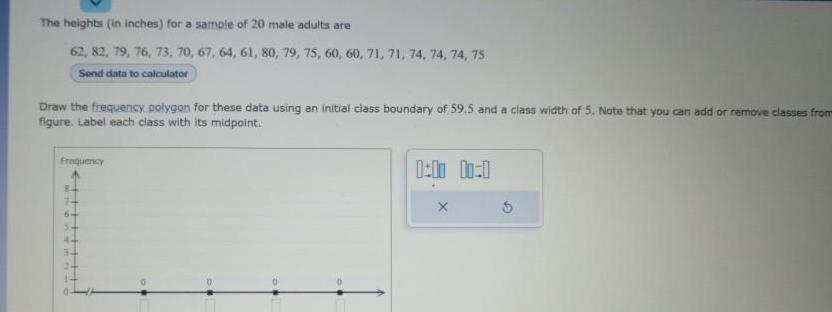
StatisticsThe heights in inches for a sample of 20 male adults are 62 82 79 76 73 70 67 64 61 80 79 75 60 60 71 71 74 74 74 75 Send data to calculator Draw the frequency polygon for these data using an initial class boundary of 59 5 and a class width of 5 Note that you can add or remove classes from figure Label each class with its midpoint Frequency 44 3 Pim 1 00 0

Statistics
StatisticsMaybe you have considered buying a term life insurance policy The expected value of any term life insurance product yields a positive expected value for the insurance company and a negative expected value for you meaning the insurance company will make profits by selling their insurance products Would you still buy the term life insurance Why or why not Are there other examples other than insurance that uses this same concept This is not a question asking your opinion about whether or not you would buy life insurance It is a question about Expected Value In your response you will need to discuss Expected Value and its calculation however it is related to your post
Statistics
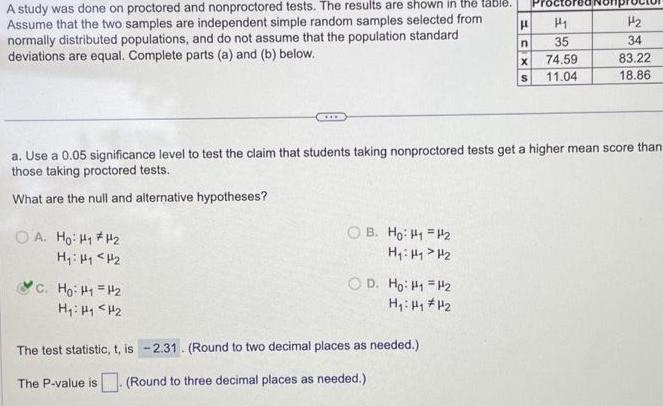
StatisticsA study was done on proctored and nonproctored tests The results are shown in the table Assume that the two samples are independent simple random samples selected from normally distributed populations and do not assume that the population standard deviations are equal Complete parts a and b below OA Ho H H H H H C Ho H H H H H a Use a 0 05 significance level to test the claim that students taking nonproctored tests get a higher mean score than those taking proctored tests What are the null and alternative hypotheses OB Ho H1 H H H H OD Ho H1 H H The test statistic t is 2 31 Round to two decimal places as needed The P value is Round to three decimal places as needed H n X S H H 141 35 74 59 11 04 H 34 83 22 18 86
Statistics
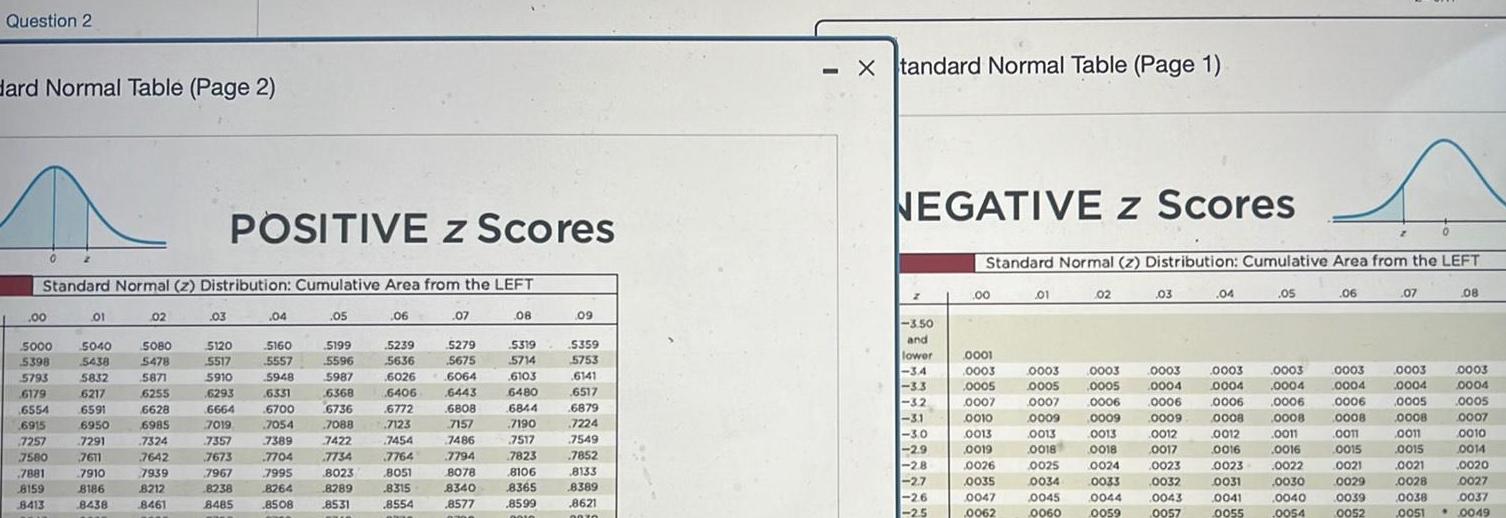
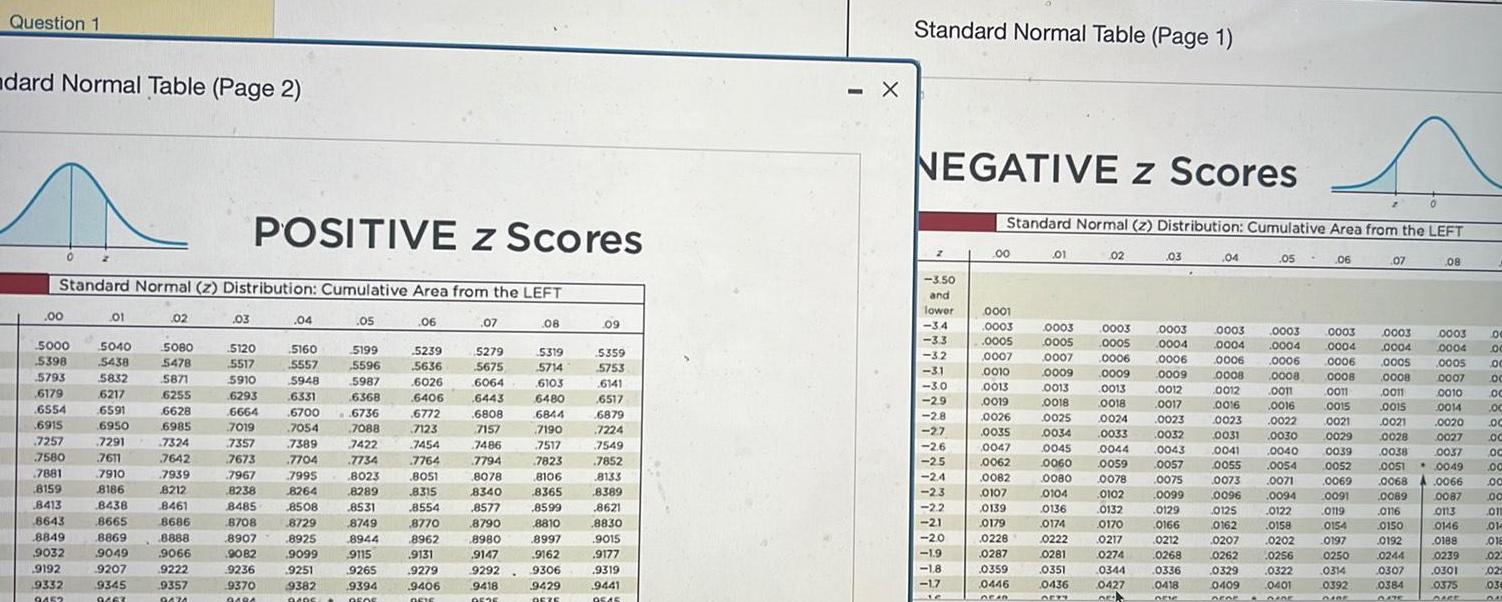
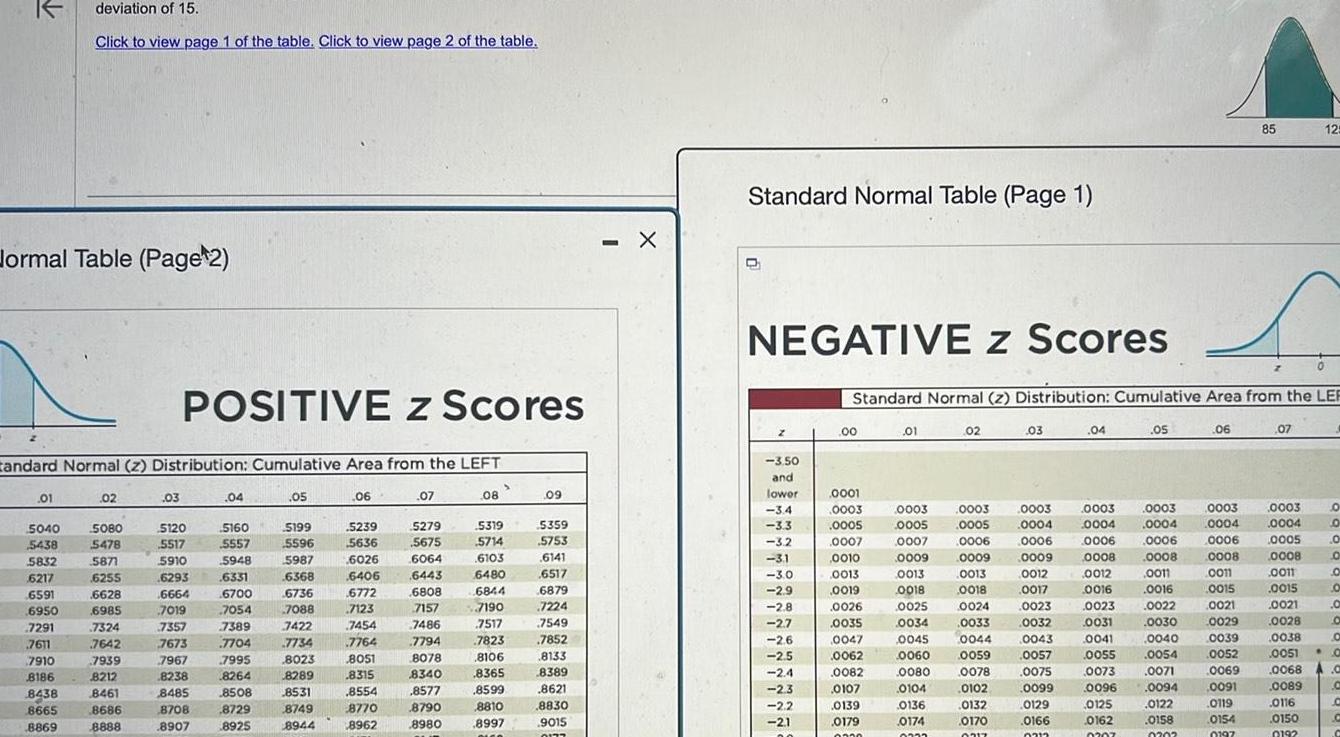
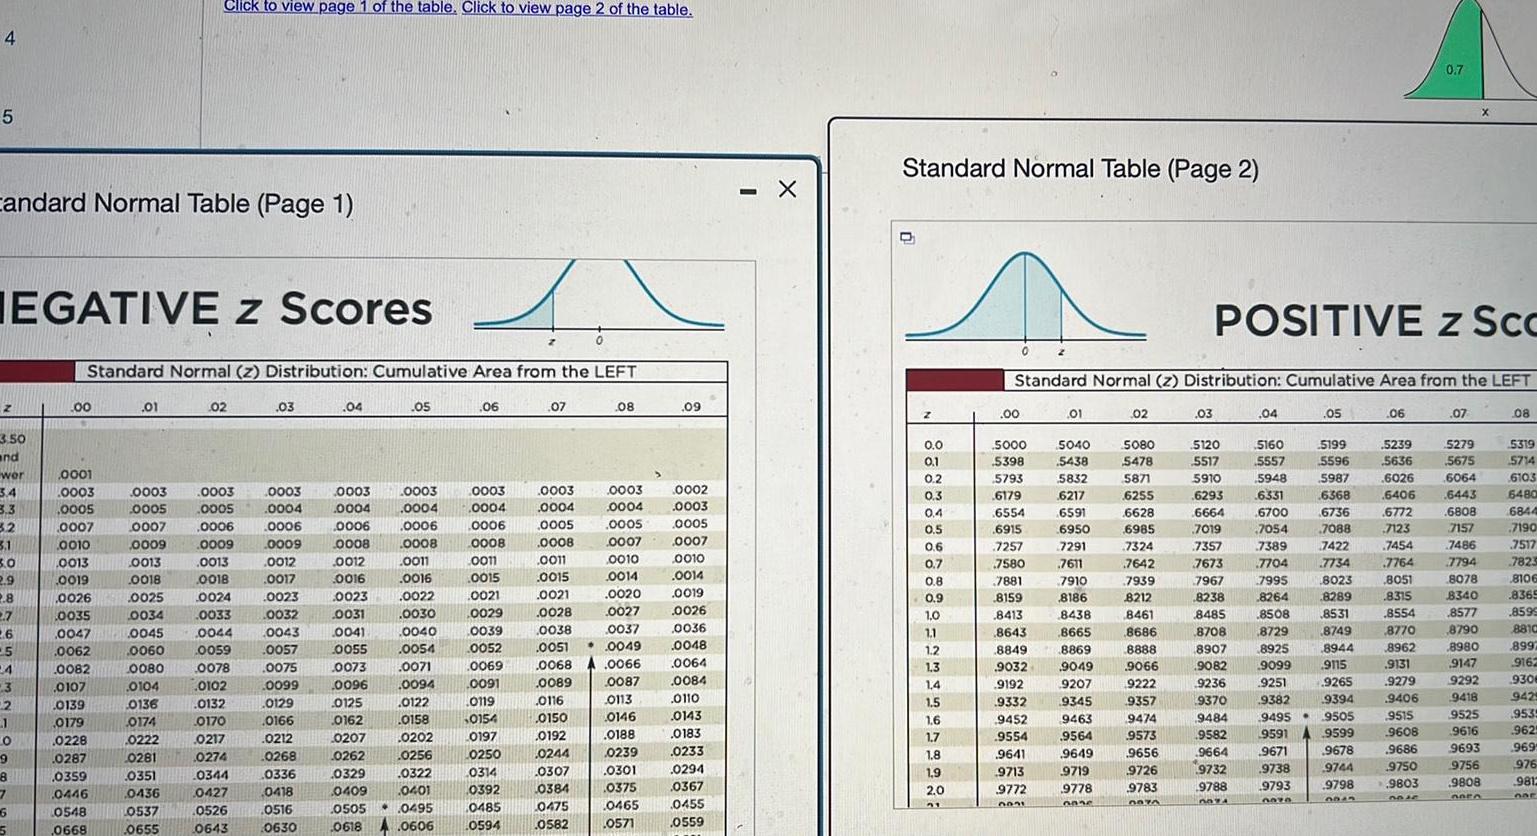
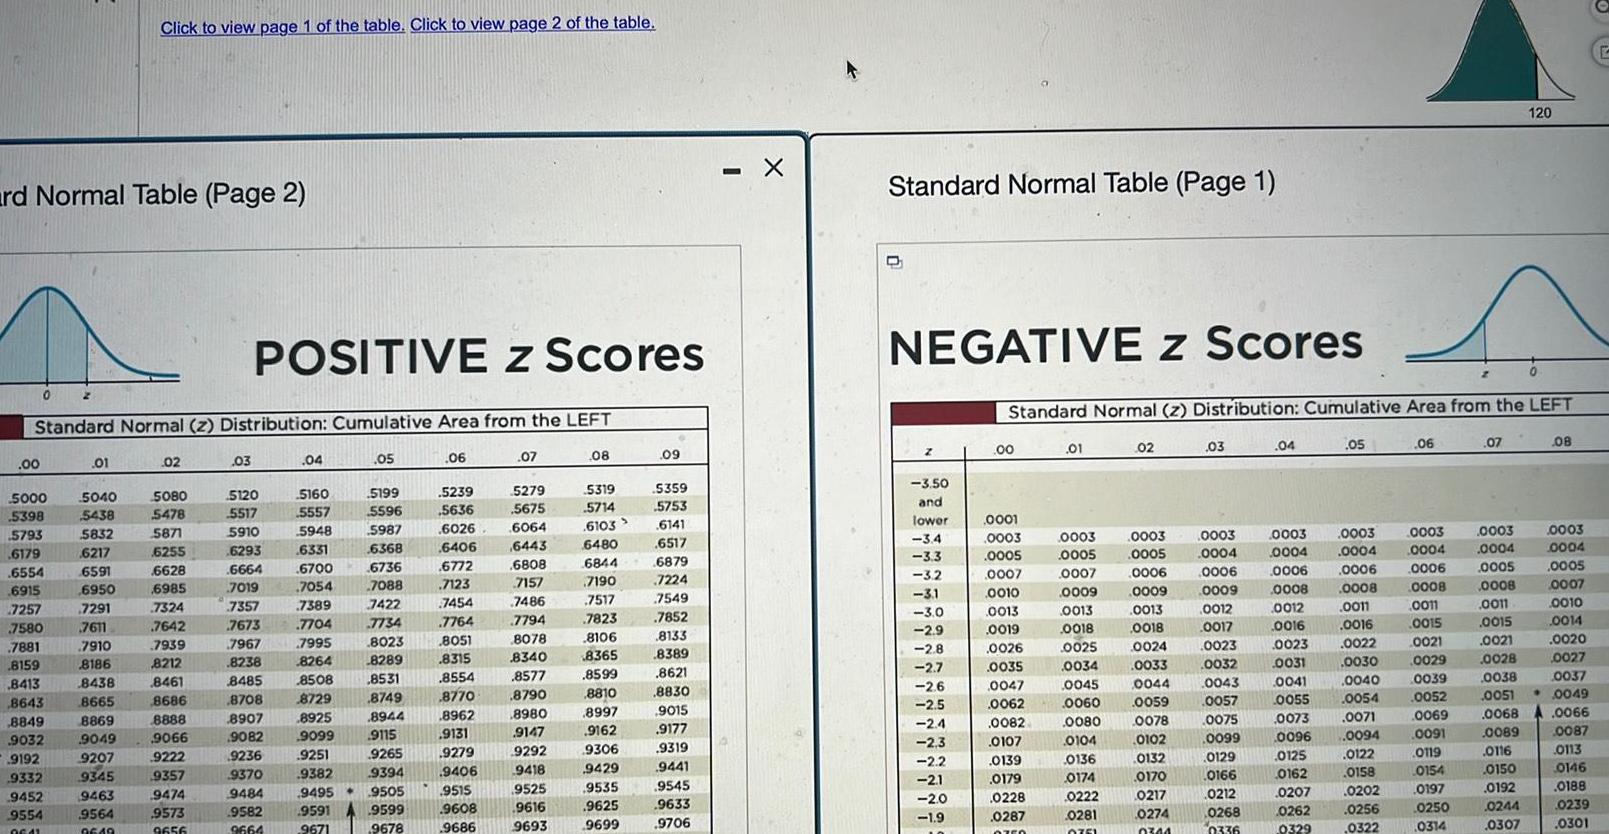
ProbabilityQuestion 2 Hard Normal Table Page 2 00 Standard Normal z Distribution Cumulative Area from the LEFT 5000 5398 5793 6179 GEKA 6554 2 6915 6915 01 5040 5438 5832 6217 6217 GEO 6591 6950 6950 7291 7257 7291 7580 7611 7881 7910 8159 8186 8413 8438 02 5080 5478 5871 6255 6529 6628 6985 7324 7642 7642 7939 8212 8461 POSITIVE z Scores 03 5120 5517 5910 6293 6293 6666 7019 7357 7673 7967 8238 8485 04 5160 5557 5948 6331 5700 6700 2054 7054 7389 7789 7704 7995 8264 8508 05 5199 5596 5987 6368 6776 6736 7088 7422 7422 7734 8023 8289 8531 06 5239 5636 6026 6406 6772 6772 7123 7454 7764 8051 8315 8554 ha 07 5279 5675 6064 6443 6808 7157 7157 7486 7794 8078 8340 8577 n 08 5319 5714 6103 6480 6844 6644 27190 7190 7517 7517 7823 7625 8106 8365 8599 0010 09 5359 5753 6141 6517 6879 6879 7224 crowd 7549 7852 1632 8133 8389 8621 2076 Xtandard Normal Table Page 1 NEGATIVE Z Scores 3 50 and lower 34 ZT 3 3 32 3 2 BETY 3 1 zo 30 2 9 2 8 2 7 2 6 2 5 Standard Normal z Distribution Cumulative Area from the LEFT 00 0001 0003 0005 0007 CO10 0010 001 0013 0019 0026 0035 0047 0062 01 0003 0005 0007 0009 0013 0018 0025 0034 0045 0060 02 0003 0005 0006 0009 0013 0018 0024 0033 0044 0059 03 0003 0004 0006 0009 0012 0017 0023 0032 0043 0057 04 05 0003 0003 0004 0004 0006 0006 0008 0008 0012 0011 0016 0016 0023 0022 0031 0030 0041 0040 0055 0054 06 0003 0004 0006 0008 0011 0015 0015 0021 0029 0039 0052 07 0003 0004 0005 0008 0011 0015 0021 0028 08 0003 0004 0005 0007 0010 0014 0020 0027 0038 0037 0051 0049
Statistics
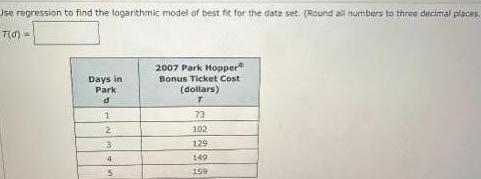
StatisticsUse regression to find the logarithmic model of best fit for the date set Round all numbers to three decimal places T d Days in Park d 1 2 3 4 5 2007 Park Hopper Bonus Ticket Cost dollars T 73 102 129 149 159
Statistics
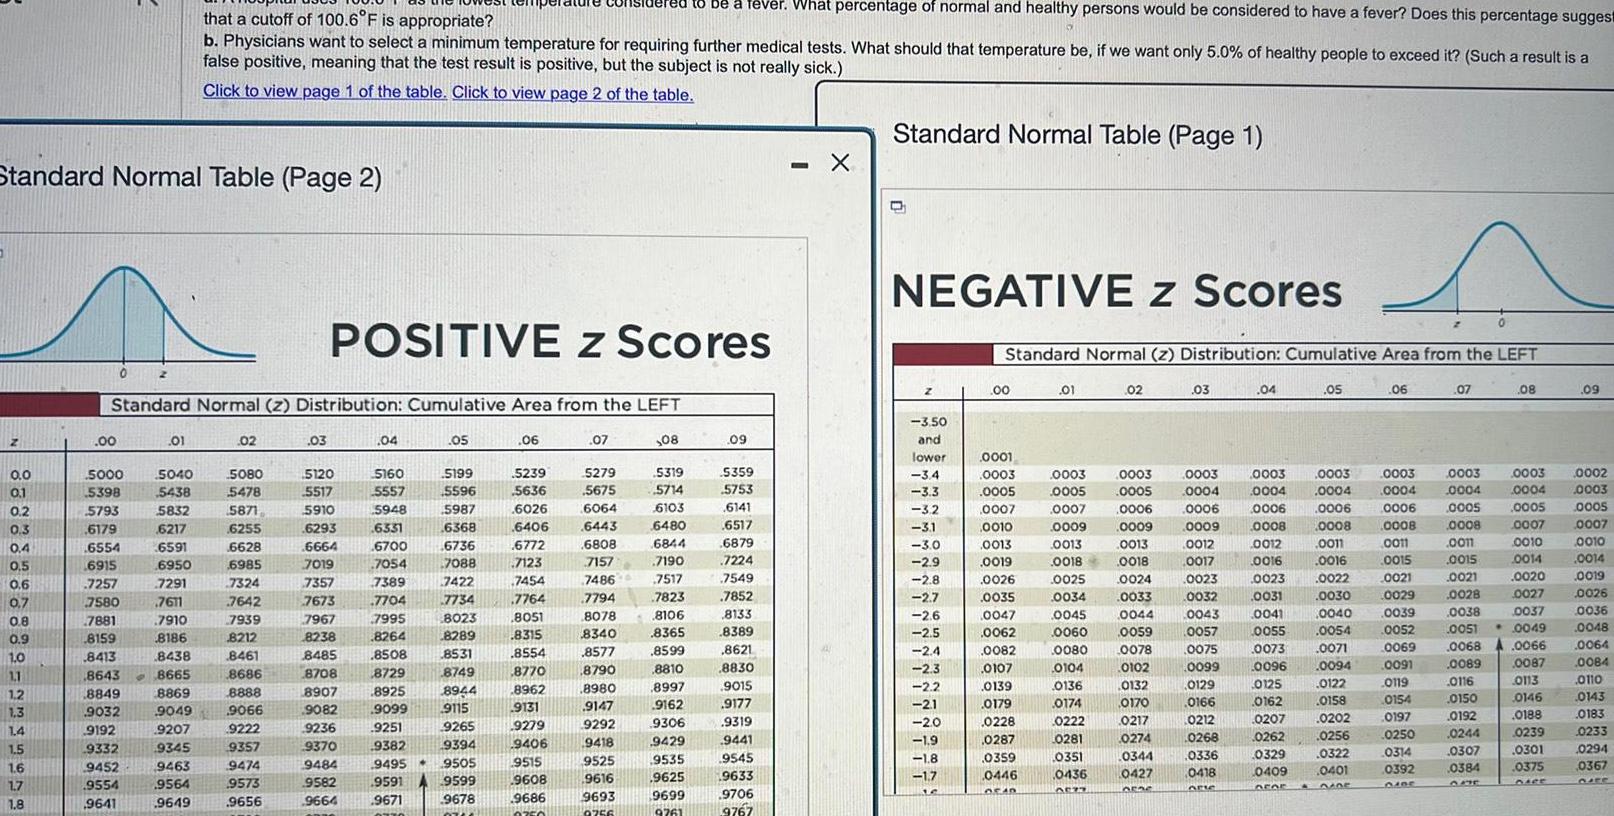
StatisticsStandard Normal Table Page 2 0 0 0 1 0 2 0 3 0 4 0 5 0 6 0 7 0 8 0 9 1 0 1 1 1 2 1 3 1 4 1 5 1 6 1 7 1 8 0 00 Standard Normal z Distribution Cumulative Area from the LEFT 5000 5398 5793 6179 6554 6915 7257 7580 7881 8159 8413 8643 8849 9032 9192 9332 9452 9554 9641 01 5040 5438 5832 6217 6591 6950 7291 7611 7910 8186 8438 8665 8869 9049 9207 9345 that a cutoff of 100 6 F is appropriate b Physicians want to select a minimum temperature for requiring further medical tests What should that temperature be if we want only 5 0 of healthy people to exceed it Such a result is a false positive meaning that the test result is positive but the subject is not really sick Click to view page 1 of the table Click to view page 2 of the table 9463 9564 9649 02 5080 5478 5871 6255 6628 6985 7324 7642 7939 8212 8461 8686 8888 9066 9222 9357 9474 9573 9656 03 POSITIVE Z Scores 5120 5517 5910 6293 6664 7019 7357 7673 7967 8238 8485 8708 8907 9082 9236 9370 9484 9582 9664 04 5160 5557 5948 6331 6700 7054 7389 7704 7995 8264 8508 8729 8925 9099 9251 9382 9495 9591 9671 2770 05 5199 5596 5987 6368 6736 7088 7422 7734 8023 8289 8531 8749 8944 9115 9265 9394 9505 9599 9678 76 06 5239 5636 6026 6406 6772 7123 7454 7764 8051 8315 8554 8770 8962 9131 9279 9406 9515 9608 9686 0750 07 5279 5675 to be a fever What percentage of normal and healthy persons would be considered to have a fever Does this percentage suggest 08 6064 6443 5319 5714 6103 6480 6808 6844 7157 7190 7486 7517 7794 7823 8078 8106 8340 8365 8577 8599 8790 8810 8980 8997 9147 9162 9292 9306 9418 9429 9525 9535 9616 9625 9693 9699 9756 9761 09 5359 5753 6141 6517 6879 7224 7549 7852 8133 8389 8621 8830 9015 9177 9319 9441 9545 9633 9706 9767 X Standard Normal Table Page 1 NEGATIVE Z Scores Z 3 50 and lower 3 4 3 3 32 3 1 3 0 2 9 2 8 2 7 2 6 2 5 2 4 2 3 2 2 21 2 0 1 9 1 8 1 7 16 00 Standard Normal z Distribution Cumulative Area from the LEFT 0001 0003 0005 0007 0010 19 0013 0019 0026 0035 0047 0062 0082 0107 0139 0179 0228 0287 0359 0446 DEAD 01 0003 0003 0005 0005 0007 0006 0009 0009 0013 0013 0018 0018 0025 0034 0045 0060 0080 0104 0136 0174 0222 0281 02 0351 0436 0527 0024 0033 0044 0059 0078 0102 0132 0170 0217 0274 0344 0427 orac 03 0003 0004 0006 0009 0012 0017 0023 0032 0043 0057 0075 0099 0129 0166 0212 0268 0336 0418 arte 04 0003 0004 0006 0008 0012 0016 05 0003 0004 0006 0008 0011 0016 0023 0022 0031 0030 0041 0040 0055 0054 0073 0071 0096 0094 0125 0122 0162 0158 0207 0202 0262 0256 0329 0322 0401 0409 OFG5 DADE A 06 0003 0004 0006 0008 0011 0015 0021 0029 0039 0052 0069 0091 0119 0154 0197 0250 2 0314 0392 DIBE 07 0003 0004 0005 0008 0011 0015 0021 0028 0038 0051 08 0089 0116 0150 0192 0244 0307 0384 0003 0004 0005 0007 0010 0014 0020 0027 0037 0049 0068 0066 0087 0113 0146 0188 0239 0301 0375 1 09 0002 0003 0005 0007 0010 0014 0019 0026 0036 0048 0064 0084 0110 0143 0183 0233 0294 0367 QUEE
Statistics
StatisticsQuestion 1 dard Normal Table Page 2 00 Standard Normal z Distribution Cumulative Area from the LEFT 5000 5398 5793 6170 6179 6554 COLE 6915 7257 7257 7580 7881 8159 8413 wato 0 8643 Home 8849 Popes 9032 9192 9332 9452 2 01 5040 5438 5832 6217 6591 6950 6950 2301 7291 7611 7611 7910 8186 8438 8665 8869 9049 9207 9345 9463 02 5080 5478 5871 6255 www 6628 GOOF 6985 772 7324 7642 7939 Mede 8212 8461 GEAR 8686 8888 www c 9066 9222 9357 9474 POSITIVE z Scores 03 5120 5517 5910 6293 6664 2010 7019 04 5160 5557 5948 6331 Hope 6700 7054 MOD 7389 7704 7995 8264 Corom 8508 wwwp 7357 water 7673 7967 8238 8485 8708 8729 10 09 C0129 8907 9082 9236 9370 9494 8925 40 9099 9251 9382 0405 05 5199 5596 5987 6368 6736 caree 8749 0143 8944 06 7088 p 7422 7734 8023 8051 6 69 8289 8315 8531 LOSK 9115 9265 9394 DEOF 5239 5636 6026 6406 6772 7123 7454 7764 26554 8554 8770 8962 9131 9279 9406 DETE 07 5279 5675 6064 6443 6808 7157 7486 7794 8078 5540 8340 6977 8577 0730 8790 10900 8980 9147 9292 9418 0525 08 5319 5714 6103 104 60 6480 6844 7190 7517 7823 8106 8365 8599 8810 8810 8997 9162 9306 9429 9575 09 5359 5753 6141 6517 6879 9973 7224 7549 7852 8133 8389 8621 6621 8830 10000 9015 9177 9319 9441 0545 X Standard Normal Table Page 1 NEGATIVE z Scores z 3 50 and lower 34 3 3 3 2 3 1 3 0 2 9 2 8 2 7 2 6 2 5 2 4 2 3 2 2 21 2 0 1 9 1 8 17 Standard Normal z Distribution Cumulative Area from the LEFT 00 0001 0003 0005 0007 0010 0013 0019 0026 0035 0047 0062 0082 0107 0139 0179 0228 0287 0359 0446 GE40 01 02 03 04 0032 0043 0057 0075 0099 0129 0166 0212 0268 0336 0418 OFIC 05 06 0003 0003 0003 0003 0005 0005 0004 0004 0007 0006 0006 0006 0009 0009 0009 0008 0013 0013 0012 0012 0018 0018 0017 0016 0015 0025 0024 0023 0023 0003 0003 0004 0004 0006 0006 0008 0008 0011 0011 0016 0022 0030 0040 0054 0071 0094 0122 0021 0034 0033 0045 0044 0060 0059 0031 0041 0055 0073 0096 0125 0080 0078 0102 0104 0136 0132 0174 0170 0162 0158 0222 0217 0207 0202 0281 0274 0262 0256 0351 0344 0436 GERT 0427 OF 0329 0322 0409 0401 DFOR ORDE 0029 0039 0052 0069 0091 0119 0154 0197 0250 0314 0392 CASE 07 0003 0004 08 0116 0150 0192 0244 0307 0384 0003 0004 0005 0007 0010 0014 0005 0008 0011 0015 0021 0028 0020 0027 0037 0049 0038 0051 0068 A 0066 0089 0087 0113 0146 0188 0239 0301 0375 DACE RRRRRRRRRRRRRD0000 Oc OC OC 011 014 018 022 025 036
Statistics
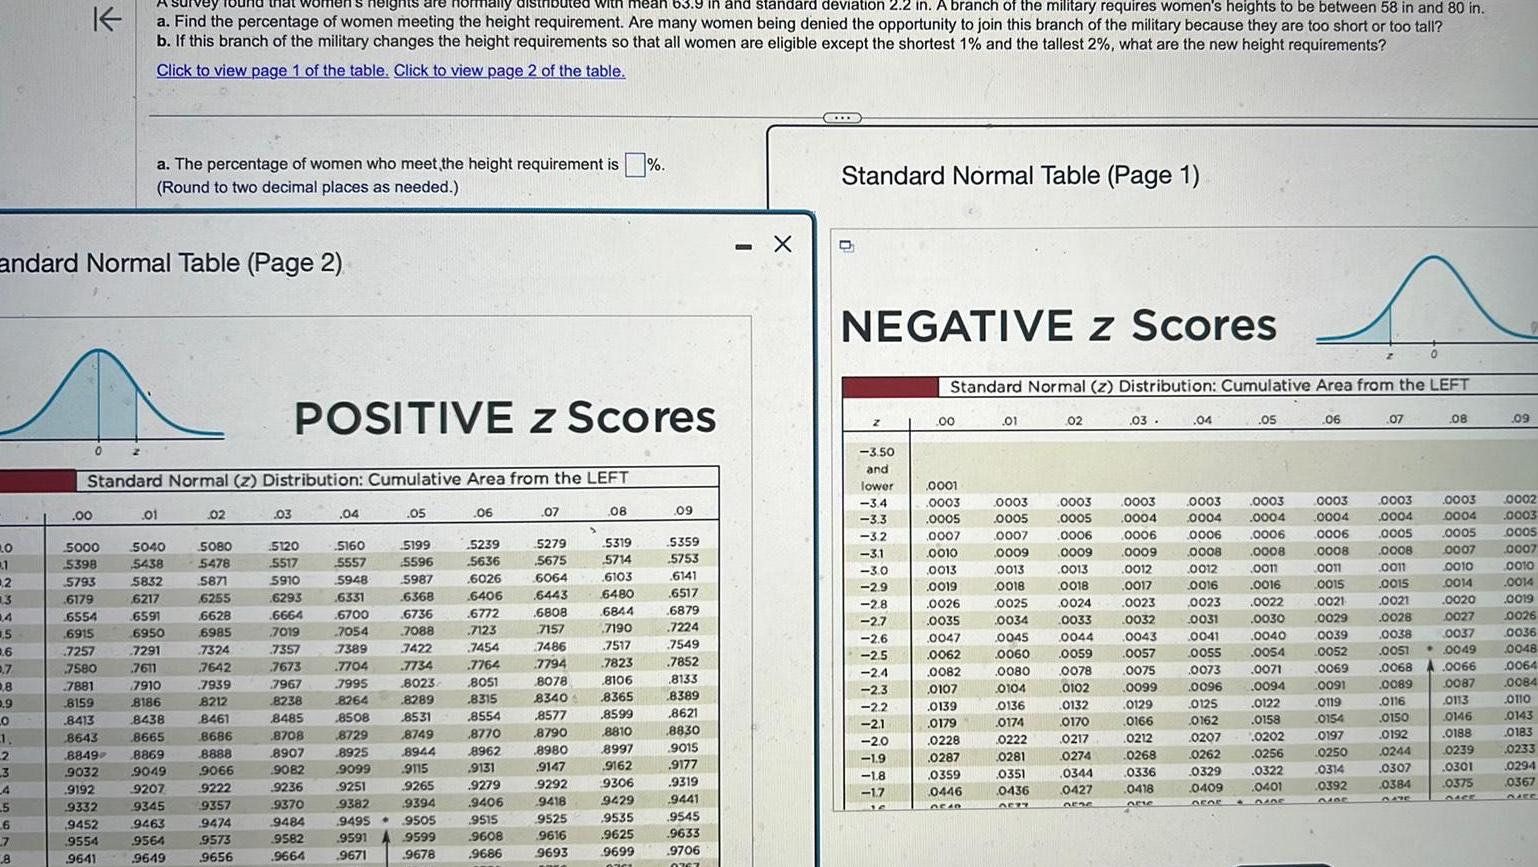
Statistics0 1 1 andard Normal Table Page 2 2 13 14 5 6 9 7 2 8 0 9 0 1 2 K vey found that women s heights are normally distributed with mean 63 9 in and standard deviation 2 2 in A branch of the military requires women s heights to be between 58 in and 80 in a Find the percentage of women meeting the height requirement Are many women being denied the opportunity to join this branch of the military because they are too short or too tall b If this branch of the military changes the height requirements so that all women are eligible except the shortest 1 and the tallest 2 what are the new height requirements Click to view page 1 of the table Click to view page 2 of the table 3 4 5 6 7 8 0 00 a The percentage of women who meet the height requirement is Round to two decimal places as needed Standard Normal z Distribution Cumulative Area from the LEFT 5000 5398 5793 6179 6554 6915 7257 7580 7881 8159 8413 8643 8849 9032 9192 9332 9452 9554 9641 01 5040 5438 5832 6217 6591 6950 7291 7611 7910 8186 8438 8665 8869 9049 9207 9345 9463 9564 9649 02 5080 5478 5871 6255 6628 6985 7324 7642 7939 8212 8461 8686 8888 9066 9222 9357 9474 9573 9656 POSITIVE z Scores 03 5120 5517 5910 6293 6664 7019 7357 7673 7967 8238 8485 8708 8907 9082 9236 9370 9484 9582 9664 04 5160 5557 5948 6331 6700 7054 7389 7704 05 5199 5596 5987 6368 6736 7088 7422 7734 7995 8264 8508 8729 8925 9099 9251 9265 9382 9394 9495 9505 9591 9599 9671 9678 8023 8289 8531 8749 8944 9115 06 5239 5636 6026 6406 6772 7123 7454 7764 8051 8315 8554 8770 8962 9131 9279 9406 9515 9608 9686 07 5279 5675 6064 6443 6808 7157 7486 7794 8078 8340 8577 8790 8980 9147 9292 9418 9525 9616 9693 08 5319 5714 6103 6480 6844 7190 7517 7823 8106 8365 8599 8810 8997 9162 9306 9429 9535 9625 9699 6301 09 5359 5753 6141 6517 6879 7224 7549 7852 8133 8389 8621 8830 9015 9177 9319 9441 9545 9633 9706 0707 X Standard Normal Table Page 1 D NEGATIVE Z Scores 2 3 50 and lower 3 4 3 3 3 2 3 1 3 0 2 9 2 8 2 7 2 6 2 5 2 4 2 3 2 2 2 1 2 0 1 9 1 8 1 7 16 Standard Normal z Distribution Cumulative Area from the LEFT 00 0001 0003 0005 0007 0010 0013 0019 0026 0035 0047 0062 0082 0107 0139 0179 0228 0287 0359 0446 0540 01 0003 0003 0005 0005 0006 0007 0009 0009 0013 0018 0013 0018 0025 0034 0045 0060 0080 0104 02 0136 0174 0222 0281 0351 0436 AFET 0024 0033 0044 0059 0078 0102 0132 0170 0217 0274 0344 0427 0530 03 0003 0004 0006 0009 0012 0017 0023 0032 0043 0057 0075 0099 0129 0166 0212 0268 0336 0418 arte 04 0003 0004 0006 0008 0012 0016 0023 0031 0041 0055 0073 0096 0125 0162 0207 0262 0329 0409 0505 05 0003 0004 0006 0008 0011 0016 0022 0030 0040 0054 0071 0094 0122 0158 0202 0256 0322 0401 0405 06 0003 0004 0006 0008 0011 0015 0021 0029 0039 0052 0069 0091 0119 0154 0197 0250 0314 0392 DIBE 07 0003 0004 0005 0008 0011 0015 0021 0028 0038 0051 0068 0089 0116 0150 0192 0244 0307 0384 0436 08 A 0003 0004 0005 0007 0010 0014 0020 0027 0037 0049 0066 0087 0113 0146 0188 0239 0301 0375 09 0002 0003 0005 0007 0010 0014 0019 0026 0036 0048 0064 0084 0110 0143 0183 0233 0294 0367 CAFE
Statistics
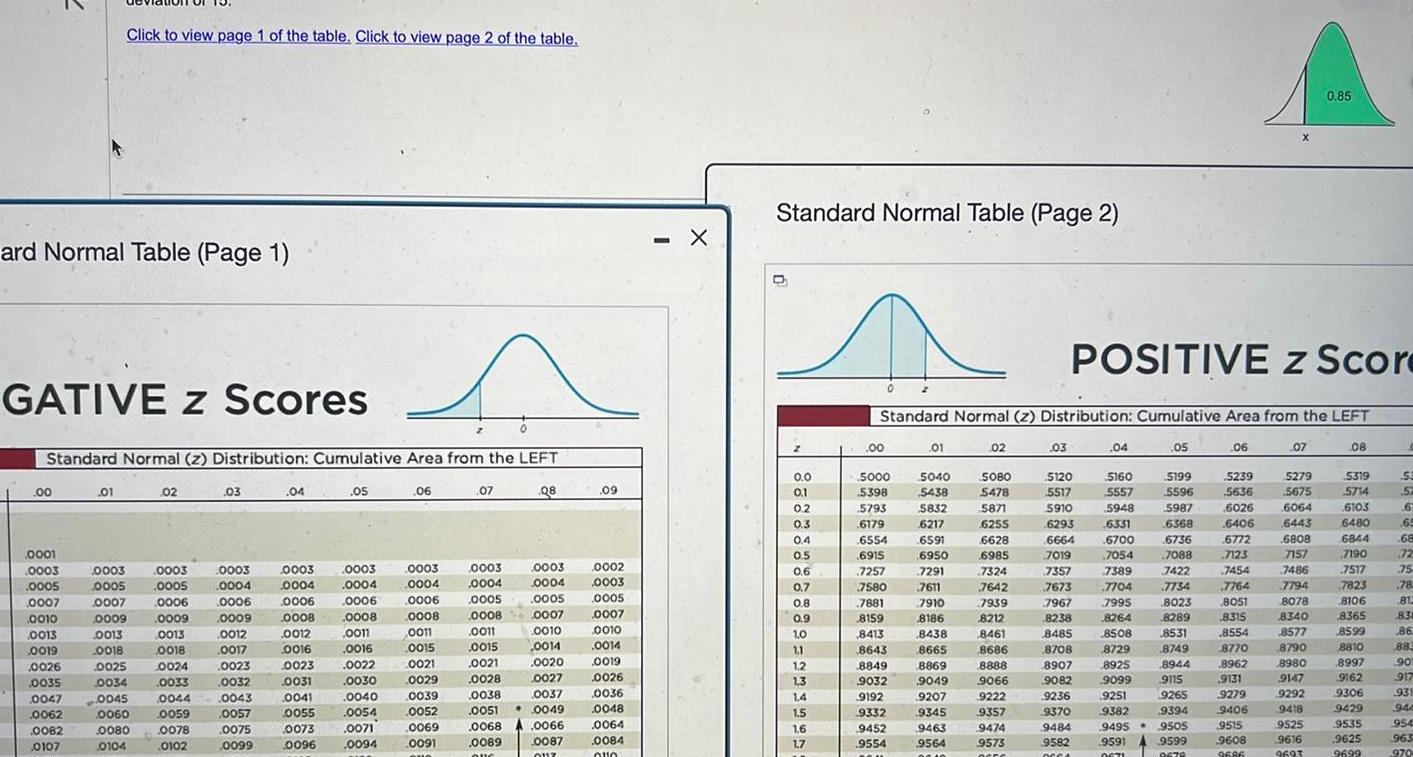
Statisticsard Normal Table Page 1 GATIVE Z Scores Standard Normal z Distribution Cumulative Area from the LEFT 00 0001 0003 0005 0001 0007 0010 0013 0015 0019 0026 0035 www w 0047 0062 Click to view page 1 of the table Click to view page 2 of the table 0082 0107 01 0003 0005 02 0025 0034 0045 0060 0080 0104 0003 0005 0007 0006 0009 0009 0013 0018 0013 wold 0018 Hono 0024 0033 0044 0059 0078 0102 03 0003 0004 0006 0009 www 0012 0017 0023 0032 www 0043 0057 0075 0099 04 05 0003 0003 0004 0004 0006 0006 0008 0008 0012 www 0016 0023 0031 0001 0041 0055 0073 0096 06 0003 0004 0006 0008 0011 0015 0021 0029 0011 0016 0022 0030 0040 0054 0071 0069 0094 0091 0039 0052 07 0003 0004 0005 0008 0011 0015 0021 www 0028 0038 0051 0068 0089 QUC Q8 0003 0004 0005 0007 0010 Cow 0014 2000 0020 6032 0027 0037 0049 0066 0087 OUZ 09 0002 0003 0005 0007 0010 0014 0014 0010 0019 0026 0026 0036 0048 0064 0084 Q10 X Standard Normal Table Page 2 85038888889 203990 0 1 0 4 0 6 0 7 1 0 1 1 1 2 1 3 1 4 1 5 1 6 1 7 00 0 Standard Normal z Distribution Cumulative Area from the LEFT 5000 5398 5793 6179 6554 6915 7257 1231 7580 1500 7881 7601 8159 Waga 8413 8643 8849 Com 9032 9192 9332 9452 9554 hom 01 5040 5438 5832 6217 6591 6950 7291 7291 7611 7910 crane 8186 8438 A 8665 8869 00 40 9049 2007 9207 9345 9463 9564 0010 02 5080 5478 5871 6255 6628 6985 7324 crow 1042 7642 7939 8212 8461 8686 8888 9066 9222 9357 9474 9573 0656 03 POSITIVE z Score 5120 5517 5910 6293 6664 7019 Trois 7357 Ves 7673 fore 7967 8238 8485 8708 8907 9082 9236 9370 9484 9582 MCCA 04 5160 5557 5948 5987 6368 6331 6700 7034 7054 13 09 7389 7704 1704 7995 Masa 8264 8508 0129 8729 8925 9099 Pappa 05 5199 5596 0671 6736 7088 1000 7422 7734 7734 8023 8289 8531 8749 8944 9115 9265 9251 9382 9495 9591A9599 9394 9505 9679 06 5239 5636 6026 6406 6772 7123 wied 7454 7764 om 8051 8315 8554 8770 8962 9131 9279 9406 9515 9608 9686 07 5279 5675 6064 6443 6808 7157 Pe 7486 www w 0 85 7794 Tem 8078 8340 8577 8790 8980 9147 9292 9418 9525 9616 9693 08 5319 5714 6103 6480 6844 7190 7517 7823 8106 8365 8599 8810 8997 9162 9306 9429 9535 9625 9699 53 57 6 65 68 725 75 78 81 834 86 88 00 901 917 931 944 954 963 970
Statistics
StatisticsJormal Table Page 2 01 tandard Normal z Distribution Cumulative Area from the LEFT 5040 5438 5832 6217 deviation of 15 Click to view page 1 of the table Click to view page 2 of the table 6591 6950 7291 7611 7910 8186 8438 8665 8869 02 5080 5478 5871 6255 6628 6985 7324 7642 7939 8212 8461 8686 8888 POSITIVE z Scores 03 5120 5517 5910 6293 6664 7019 7357 7673 7967 8238 8485 8708 8907 04 5160 5557 5948 6331 6700 7054 7389 7704 7995 8264 8508 8729 8925 05 5199 5596 5987 6368 6736 7088 7422 7734 8023 8289 8531 8749 8944 06 5239 5636 6026 6406 p 6772 7123 7454 7704 7764 8051 8315 8554 8770 8962 07 5279 5675 6064 6443 App 6808 7157 7486 7794 8078 8340 8577 8790 8980 08 5319 5714 6103 6480 COLL 6844 HOO 7190 7517 7823 8106 8365 8599 8810 8997 09 5359 5753 6141 6517 6879 7224 7224 ww 7549 7852 8133 8389 8621 8830 9015 0177 X Standard Normal Table Page 1 NEGATIVE z Scores 3 50 and lower 3 4 77 3 3 32 3 2 271 3 1 z 3 0 20 2 9 2 8 2 7 2 6 2 5 2 4 2 3 2 2 2 1 20 00 0001 0003 0005 0007 0010 0010 Standard Normal z Distribution Cumulative Area from the LEF COU 0013 2010 0019 moo 0026 GOTE 0035 www 0047 0062 0082 0107 0139 0179 0550 01 02 0003 0003 0005 0005 0007 0009 0013 2010 0018 0025 0074 0034 w 0045 0060 0080 0104 0136 0174 0333 0006 0009 0013 0019 0018 0001 0024 COTT 0033 Cow 0044 Oro 0059 0078 0102 0132 0170 0317 03 0003 0004 0006 0009 0012 0017 0023 0032 w 0043 COF 0057 Com 0075 0099 0129 0166 0312 04 0003 0004 0006 0008 0012 0016 0016 0037 0023 con 0031 com 0041 COFF 0055 com 0073 0096 0125 0162 0207 05 0003 0004 0006 0008 0011 0016 0016 0000 0022 0070 0030 2010 0040 0054 0054 com 0071 0094 0122 0158 0202 06 0003 0004 0006 0008 0011 0015 0021 0021 0029 0029 2690 0039 0052 0052 85 0069 0091 0119 0154 0197 Z 07 0003 0004 0005 0008 0011 0015 0015 0021 0028 0028 0038 0038 125 0051 0051 0068 0089 0116 0150 0192 0 0 0 0 0 0 0 0 0 0 C C C
Statistics
Statistics4 5 Candard Normal Table Page 1 Z 3 50 and wor 3 4 EGATIVE z Scores 3 3 3 2 3 1 3 0 2 9 2 8 2 7 2 6 5 24 3 2 1 0 9 8 7 6 5 1 Standard Normal z Distribution Cumulative Area from the LEFT 00 0001 0003 0005 0007 0010 0013 0019 0026 0035 0047 0062 0082 0107 0139 0179 0228 0287 0359 0446 0548 0668 01 0003 0005 0007 0009 0013 0018 Click to view page 1 of the table Click to view page 2 of the table 0025 0034 0045 0060 0080 0104 0136 0174 0222 0281 0351 0436 0537 0655 02 0003 0005 0006 0009 0013 0018 0024 0033 0044 0059 0078 0102 0132 0170 0217 0274 0344 0427 0526 0643 03 0003 0004 0006 0009 0012 0017 0023 0032 0043 0057 0075 0099 0129 0166 0212 0268 0336 0418 0516 0630 04 0003 0004 0006 0008 0012 0016 0023 0031 0041 0055 0073 0096 0125 0162 0207 0262 0329 0409 05 0003 0004 0006 0008 0011 0016 0022 0030 0040 0054 0071 0094 0122 0158 0202 0256 0322 0401 0505 0495 0618 0606 A 06 0003 0004 0006 0008 0011 0015 0021 0029 0039 0052 0069 0091 0119 0154 0197 0250 0314 0392 0485 0594 07 0003 0004 0005 0008 08 0003 0004 0005 0007 0011 0010 0015 0014 0021 0020 0028 0027 0038 0037 0051 0049 0068 A 0066 0089 0087 0116 0113 0150 0146 0192 0188 0244 0307 0384 0475 0582 0239 0301 0375 0465 0571 09 0002 0003 0005 0007 0010 0014 0019 0026 0036 0048 0064 0084 0110 0143 0183 0233 0294 0367 0455 0559 X Standard Normal Table Page 2 0 0 0 1 0 2 0 3 0 4 0 5 0 6 0 7 0 8 0 9 1 0 1 1 1 2 1 3 1 4 1 5 1 6 1 7 1 8 1 9 2 0 00 5000 5398 5793 6179 Standard Normal z Distribution Cumulative Area from the LEFT 6554 6915 7257 7580 7881 8159 8413 8643 8849 9032 9192 9332 9452 9554 9641 9713 9772 0031 01 5040 5438 5832 6217 6591 6950 7291 7611 7910 8186 8438 8665 8869 9049 9207 9345 9463 9564 9649 9719 9778 0836 02 5080 5478 5871 6255 6628 6985 7324 7642 7939 8212 8461 8686 8888 9066 9222 9357 9474 9573 9656 9726 9783 0974 03 POSITIVE z Sco 5120 5517 5910 6293 6664 7019 7357 7673 7967 8238 8485 8708 8907 9082 9236 9370 9484 9582 9664 9732 9788 0874 04 5160 5557 5948 6331 6700 7054 7389 7704 7995 8264 8508 8729 8925 9099 9251 9382 9495 9591 9671 9738 9793 2020 05 5199 5596 5987 6368 6736 7088 7422 7734 8023 8289 8531 8749 8944 9115 9265 9394 9505 9599 9678 9744 9798 3545 06 5239 5636 6026 6406 6772 7123 7454 7764 8051 8315 8554 8770 8962 9131 9279 9406 0 7 9515 9608 9686 9750 9803 DO 45 07 5279 5675 6064 6443 6808 7157 7486 X 7794 8078 8340 8577 8790 8980 9147 9292 9418 9525 9616 9693 9756 9808 GAFA 08 5319 5714 6103 6480 6844 7190 7517 7823 8106 8369 8599 8810 89972 9162 9306 9425 9535 9625 969 976 9812 nar
Statistics
Statisticsrd Normal Table Page 2 00 0 5000 5398 5793 Standard Normal z Distribution Cumulative Area from the LEFT 6179 6554 6915 7257 7580 7881 8159 8413 2 8643 8849 9032 9192 9332 9452 9554 0641 01 5040 5438 5832 6217 6591 6950 7291 7611 7910 8186 8438 8665 8869 9049 Click to view page 1 of the table Click to view page 2 of the table 9207 9345 9463 9564 9649 02 5080 5478 5871 6255 6628 6985 7324 7642 7939 8212 8461 8686 8888 9066 9222 9357 9474 9573 9656 POSITIVE z Scores 03 5120 5517 5910 6293 6664 7019 7357 7673 7967 8238 8485 8708 8907 9082 9236 9370 9484 9582 9664 04 5160 5557 5948 6331 6700 7054 7389 7704 7995 8264 8508 8729 8925 9099 9251 9382 9495 9591 9671 05 5199 5596 5987 6368 6736 7088 7422 7734 8023 8289 8531 8749 8944 9115 9265 9394 9505 9599 9678 06 5239 5636 6026 6406 6772 7123 7454 7764 8051 8315 8554 8770 8962 9131 9279 9406 9515 9608 9686 07 5279 5675 6064 6443 6808 7157 7486 7794 8078 8340 8577 8790 8980 9147 9292 9418 9525 9616 9693 08 5319 5714 6103 6480 6844 7190 7517 7823 8106 8365 8599 8810 8997 9162 9306 9429 9535 9625 9699 09 5359 5753 6141 6517 6879 7224 7549 7852 8133 8389 8621 8830 9015 9177 9319 9441 9545 9633 9706 X 4 Standard Normal Table Page 1 NEGATIVE z Scores 2 3 50 and lower 3 4 3 3 3 2 3 1 3 0 2 9 2 8 2 7 2 6 2 5 2 4 2 3 2 2 2 1 2 0 1 9 00 0001 0003 0005 0007 0010 0013 0019 0026 Standard Normal z Distribution Cumulative Area from the LEFT 0035 0047 0062 0082 0107 0139 0179 0228 0287 0750 01 0003 0003 0005 0005 0007 0006 0009 0009 0013 0018 0024 0033 0044 0013 0018 0025 0034 0045 0060 0080 0104 0136 02 0174 0222 0281 0751 0059 0078 0102 0132 0170 0217 0274 0344 03 0003 0004 0006 0009 0012 0017 0023 0032 0043 0057 0075 0099 0129 0166 0212 0268 0336 04 0003 0004 0006 0008 0012 0016 0023 0031 0041 0055 0073 0096 0125 0162 0207 0262 0329 05 0003 0004 0006 0008 0011 0016 0022 0030 0040 0054 0071 0094 0122 0158 0202 0256 0322 06 2 0003 0004 0006 0008 0011 0015 0021 0029 0039 0052 0069 0091 0119 0154 0197 0250 0314 07 0003 0004 0005 0008 0011 0015 0021 0028 0038 0051 120 0068 0089 0116 0150 0192 0244 0307 0 08 0003 0004 0005 0007 0010 0014 0020 0027 0037 0049 0066 0087 0113 0146 0188 0239 0301 E
Statistics
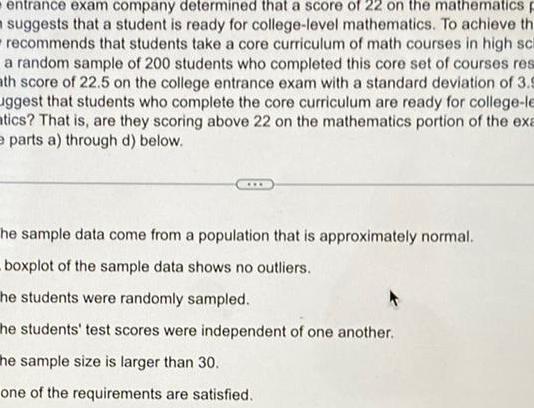
Probabilityentrance exam company determined that a score of 22 on the mathematics p suggests that a student is ready for college level mathematics To achieve th recommends that students take a core curriculum of math courses in high sch a random sample of 200 students who completed this core set of courses res ath score of 22 5 on the college entrance exam with a standard deviation of 3 9 uggest that students who complete the core curriculum are ready for college le tics That is are they scoring above 22 on the mathematics portion of the exa e parts a through d below he sample data come from a population that is approximately normal boxplot of the sample data shows no outliers he students were randomly sampled he students test scores were independent of one another he sample size is larger than 30 one of the requirements are satisfied
Statistics
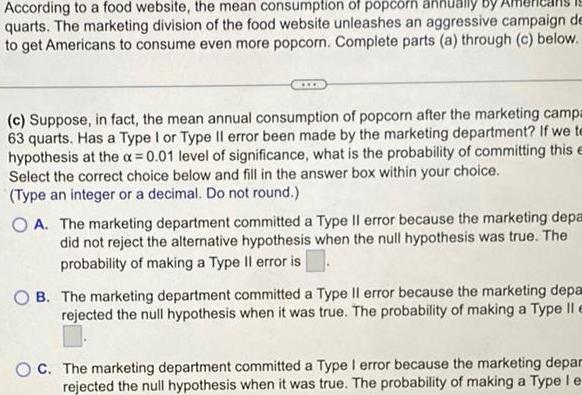
StatisticsAccording to a food website the mean consumption of popcorn annually quarts The marketing division of the food website unleashes an aggressive campaign de to get Americans to consume even more popcorn Complete parts a through c below c Suppose in fact the mean annual consumption of popcorn after the marketing campa 63 quarts Has a Type I or Type II error been made by the marketing department If we te hypothesis at the a 0 01 level of significance what is the probability of committing this e Select the correct choice below and fill in the answer box within your choice Type an integer or a decimal Do not round OA The marketing department committed a Type II error because the marketing depa did not reject the alternative hypothesis when the null hypothesis was true The probability of making a Type Il error is OB The marketing department committed a Type Il error because the marketing depa rejected the null hypothesis when it was true The probability of making a Type Il e OC The marketing department committed a Type I error because the marketing depar rejected the null hypothesis when it was true The probability of making a Type le
Statistics
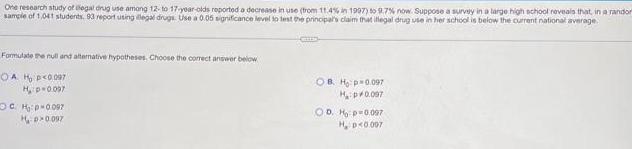
ProbabilityOne research study of legal drug use among 12 to 17 year olds reported a decrease in use trom 11 4 in 1997 to 9 7 now Suppose a survey in a large high school reveals that in a randor sample of 1 041 students 93 report using illegal drugs Use a 0 05 significance level to test the principal s claim that illegal drug use in her school is below the current national average Formulate the null and alternative hypotheses Choose the correct answer below AH p 0 097 H p 0 097 CH p 0 097 H D0097 CS OB Hop 0 097 Hp 0 097 OD Ho p 0 097 H D 0 007
Statistics
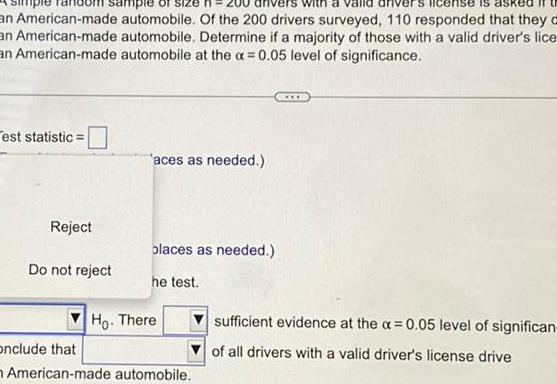
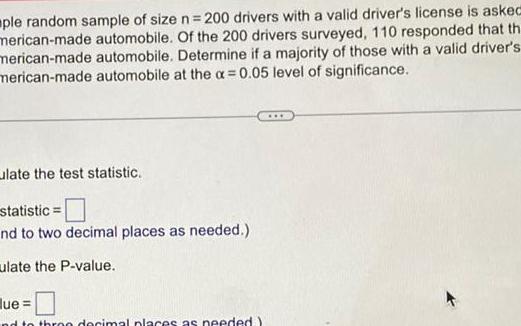
Statisticsan American made automobile Of the 200 drivers surveyed 110 responded that they a automobile Determine if a majority of those with a valid driver s lice automobile at the x 0 05 level of significance sample an American made an American made est statistic Reject Do not reject aces as needed olaces as needed he test Ho There onclude that American made automobile sufficient evidence at the 0 05 level of significan of all drivers with a valid driver s license drive
Statistics
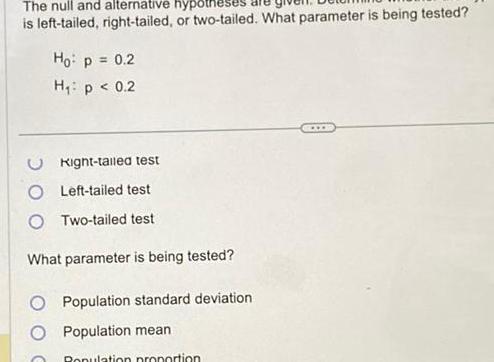
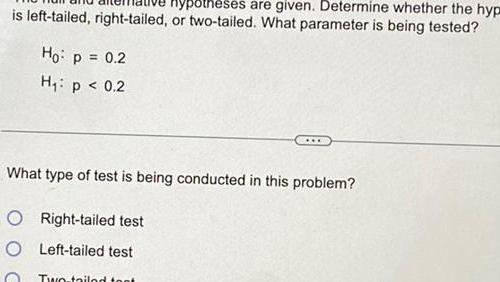
ProbabilityThe null and alternative hypot is left tailed right tailed or two tailed What parameter is being tested Ho p 0 2 H p 0 2 Right tailed test Left tailed test OTwo tailed test What parameter is being tested Population standard deviation Population mean Population proportion
Statistics
Statisticsple random sample of size n 200 drivers with a valid driver s license is asked merican made automobile Of the 200 drivers surveyed 110 responded that th merican made automobile Determine if a majority of those with a valid driver s merican made automobile at the x 0 05 level of significance late the test statistic statistic nd to two decimal places as needed ulate the P value lue nd to thron decimal places as needed
Statistics
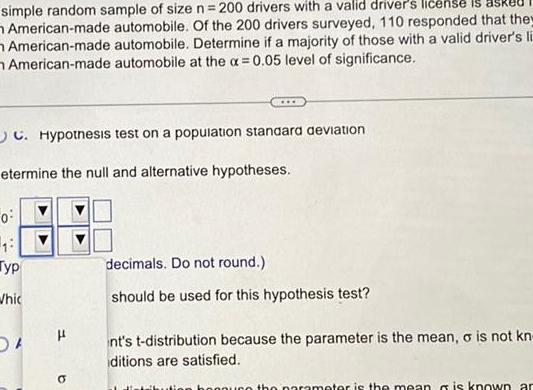
Statisticssimple random sample of size n 200 drivers with a valid driver s license is American made automobile Of the 200 drivers surveyed 110 responded that they American made automobile Determine if a majority of those with a valid driver s li American made automobile at the a 0 05 level of significance C Hypothesis test on a population standard deviation etermine the null and alternative hypotheses 0 13 Typ Whic 5 H a decimals Do not round should be used for this hypothesis test nt s t distribution because the parameter is the mean o is not kn ditions are satisfied the parameter is the mean is known ar
Statistics
Probabilityis left tailed right tailed Ho p 0 2 H p 0 2 hypotheses are given Determine whether the hyp or two tailed What parameter is being tested What type of test is being conducted in this problem O Right tailed test O Left tailed test Two tailed toot
Statistics
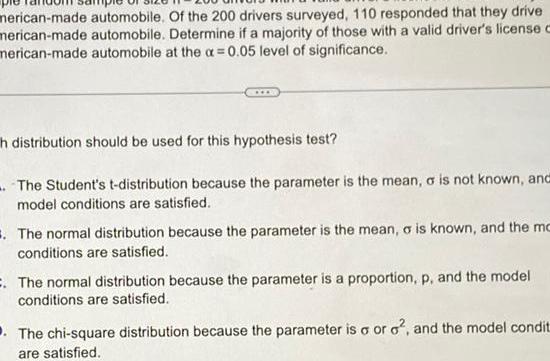
Statisticsmerican made automobile Of the 200 drivers surveyed 110 responded that they drive merican made automobile Determine if a majority of those with a valid driver s license c merican made automobile at the a 0 05 level of significance h distribution should be used for this hypothesis test The Student s t distribution because the parameter is the mean a is not known and model conditions are satisfied The normal distribution because the parameter is the mean o is known and the mo conditions are satisfied The normal distribution because the parameter is a proportion p and the model conditions are satisfied The chi square distribution because the parameter is o or o and the model condit are satisfied
Statistics
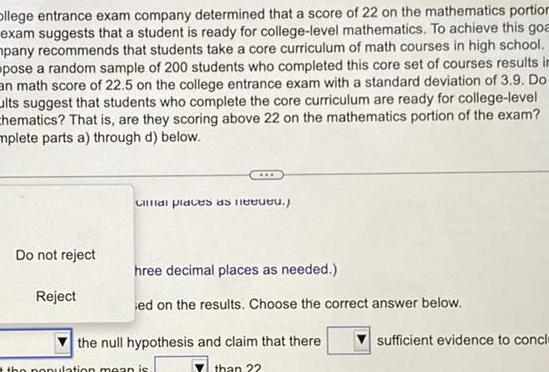
StatisticsOllege entrance exam company determined that a score of 22 on the mathematics portion exam suggests that a student is ready for college level mathematics To achieve this goa mpany recommends that students take a core curriculum of math courses in high school pose a random sample of 200 students who completed this core set of courses results in an math score of 22 5 on the college entrance exam with a standard deviation of 3 9 Do ults suggest that students who complete the core curriculum are ready for college level chematics That is are they scoring above 22 on the mathematics portion of the exam mplete parts a through d below Do not reject Reject Cal places as need hree decimal places as needed ed on the results Choose the correct answer below the null hypothesis and claim that there than 22 the population mean is sufficient evidence to concl
Statistics
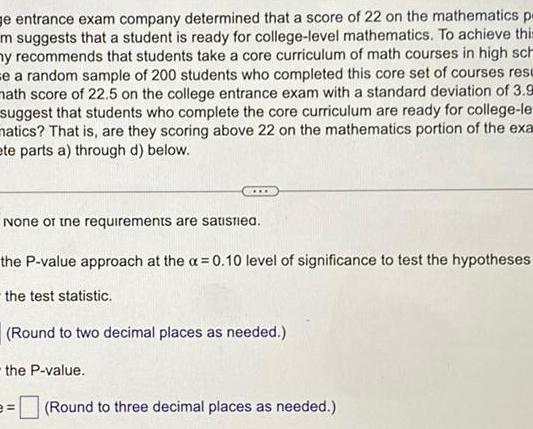
Statisticse entrance exam company determined that a score of 22 on the mathematics p m suggests that a student is ready for college level mathematics To achieve this ny recommends that students take a core curriculum of math courses in high sch se a random sample of 200 students who completed this core set of courses resu math score of 22 5 on the college entrance exam with a standard deviation of 3 9 suggest that students who complete the core curriculum are ready for college le matics That is are they scoring above 22 on the mathematics portion of the exa ete parts a through d below None of the requirements are satisfied the P value approach at the x 0 10 level of significance to test the hypotheses the test statistic Round to two decimal places as needed the P value Round to three decimal places as needed
Statistics
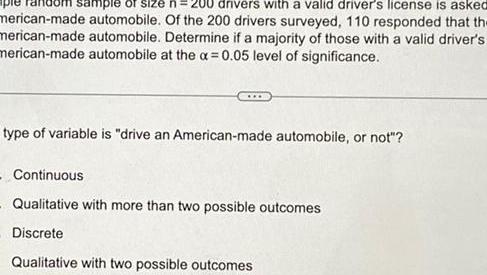
Statisticsdrivers with a valid driver s license is asked sample of size n 20 merican made automobile Of the 200 drivers surveyed 110 responded that the merican made automobile Determine if a majority of those with a valid driver s merican made automobile at the x 0 05 level of significance type of variable is drive an American made automobile or not Continuous Qualitative with more than two possible outcomes Discrete Qualitative with two possible outcomes
Statistics
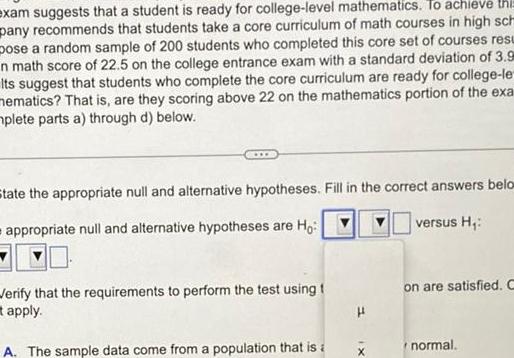
Statisticsexam suggests that a student is ready for college level mathematics To achieve thi pany recommends that students take a core curriculum of math courses in high sch pose a random sample of 200 students who completed this core set of courses resu n math score of 22 5 on the college entrance exam with a standard deviation of 3 9 Its suggest that students who complete the core curriculum are ready for college le mematics That is are they scoring above 22 on the mathematics portion of the exa plete parts a through d below State the appropriate null and alternative hypotheses Fill in the correct answers belo appropriate null and alternative hypotheses are Ho versus H Verify that the requirements to perform the test using t apply A The sample data come from a population that is a X on are satisfied C normal

Statistics
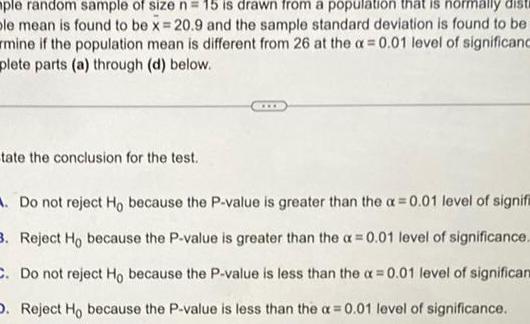
ProbabilityK A simple random sample of size n 15 is drawn from a population that is normally distri sample mean is found to be x 20 9 and the sample standard deviation is found to be s Determine if the population mean is different from 26 at the a 0 01 level of significance
Statistics
Statisticsple random sample of size n 15 is drawn from a population that is normally disti ple mean is found to be x 20 9 and the sample standard deviation is found to be mine if the population mean is different from 26 at the a 0 01 level of significanc plete parts a through d below tate the conclusion for the test Do not reject Ho because the P value is greater than the a 0 01 level of signif 3 Reject Ho because the P value is greater than the a 0 01 level of significance C Do not reject Ho because the P value is less than the x 0 01 level of significan D Reject Ho because the P value is less than the a 0 01 level of significance
Statistics
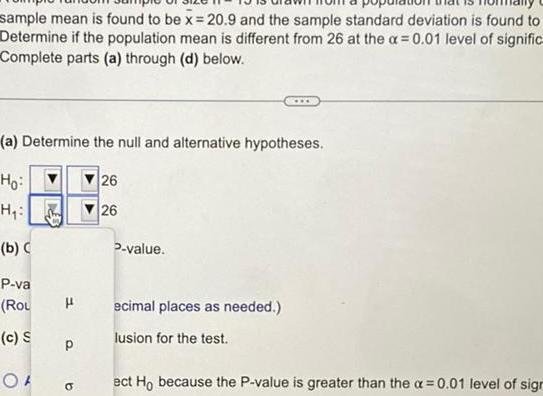
Statisticssample mean is found to be x 20 9 and the sample standard deviation is found to Determine if the population mean is different from 26 at the a 0 01 level of signific Complete parts a through d below a Determine the null and alternative hypotheses Ho H b P va Rou H c S OF P b 26 26 P value www ecimal places as needed lusion for the test ect Ho because the P value is greater than the a 0 01 level of sign
Statistics
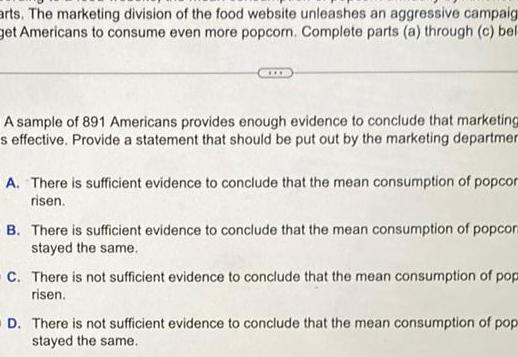
Statisticsarts The marketing division of the food website unleashes an aggressive campaig get Americans to consume even more popcorn Complete parts a through c bel A sample of 891 Americans provides enough evidence to conclude that marketing s effective Provide a statement that should be put out by the marketing departmen A There is sufficient evidence to conclude that the mean consumption of popcor risen B There is sufficient evidence to conclude that the mean consumption of popcor stayed the same C There is not sufficient evidence to conclude that the mean consumption of pop risen OD There is not sufficient evidence to conclude that the mean consumption of pop stayed the same
Statistics
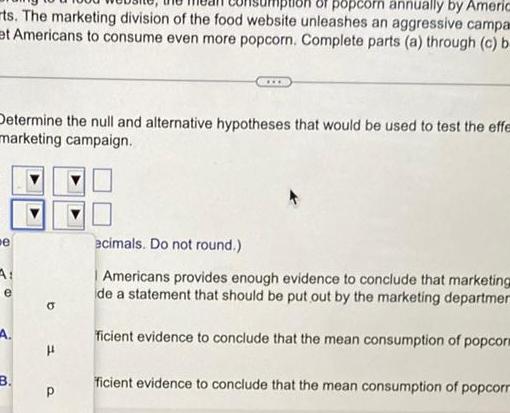
Statisticspopcorn annually by Americ ts The marketing division of the food website unleashes an aggressive campa et Americans to consume even more popcorn Complete parts a through c b Determine the null and alternative hypotheses that would be used to test the effe marketing campaign e e B P ecimals Do not round Americans provides enough evidence to conclude that marketing de a statement that should be put out by the marketing departmer ficient evidence to conclude that the mean consumption of popcors ficient evidence to conclude that the mean consumption of popcorr
Statistics
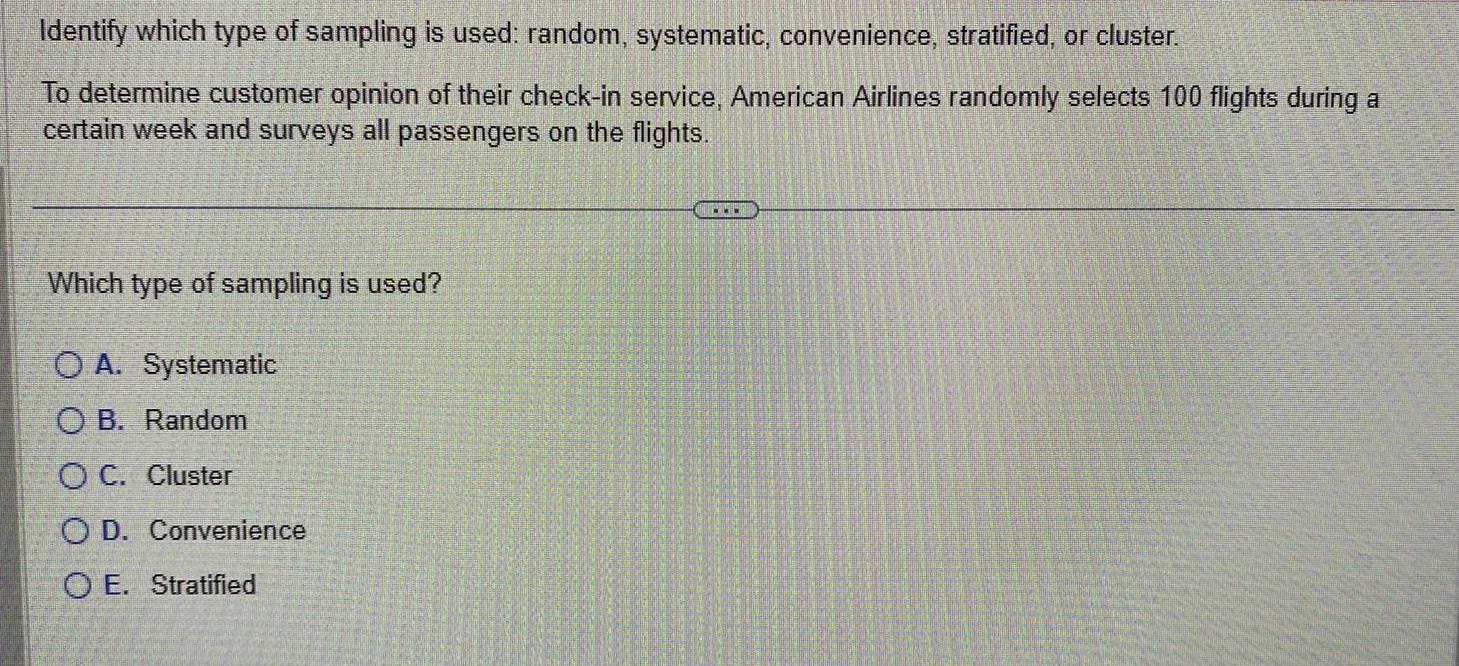
ProbabilityIdentify which type of sampling is used random systematic convenience stratified or cluster To determine customer opinion of their check in service American Airlines randomly selects 100 flights during a certain week and surveys all passengers on the flights Which type of sampling is used OA Systematic OB Random OC Cluster OD Convenience O E Stratified www
Statistics
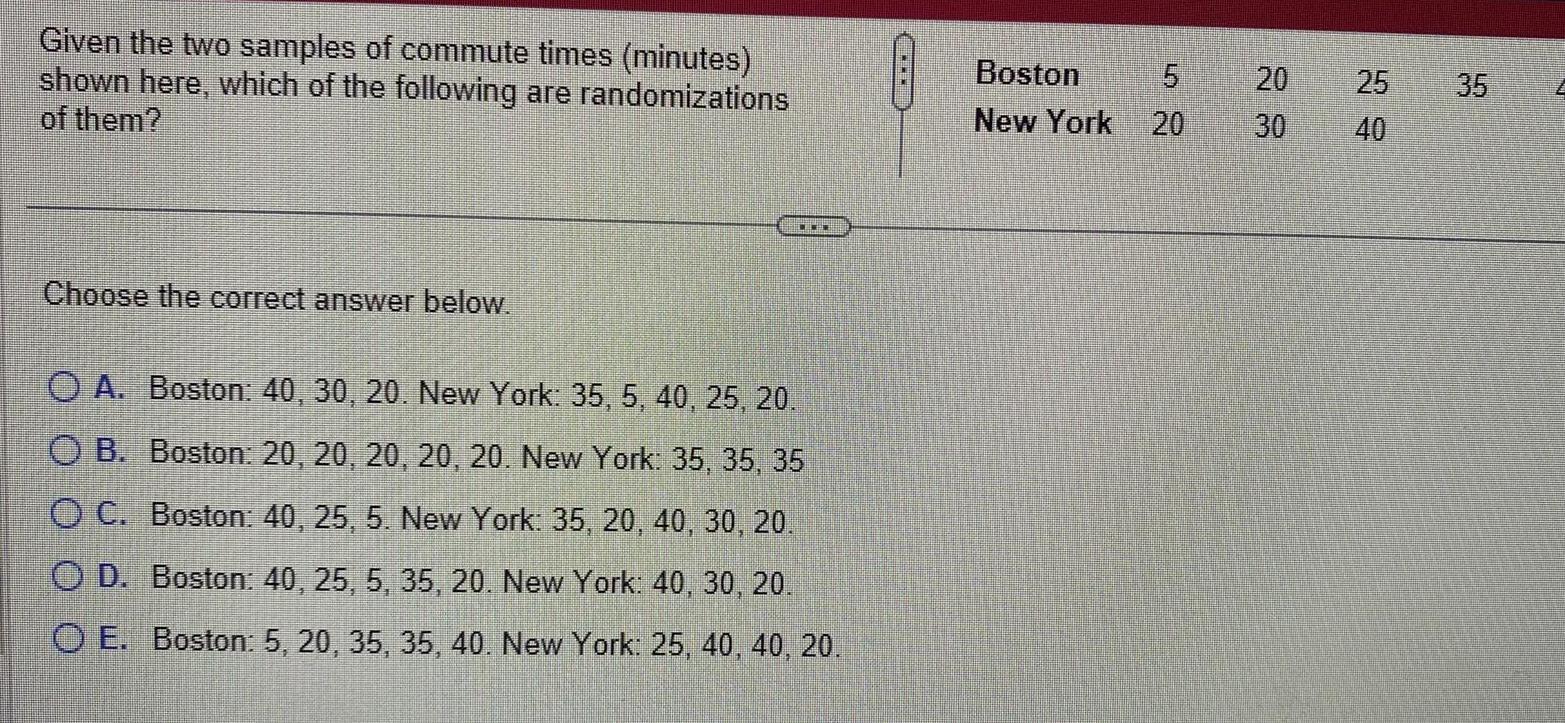
StatisticsGiven the two samples of commute times minutes shown here which of the following are randomizations of them Choose the correct answer below OA Boston 40 30 20 New York 35 5 40 25 20 O B Boston 20 20 20 20 20 New York 35 35 35 O C Boston 40 25 5 New York 35 20 40 30 20 OD Boston 40 25 5 35 20 New York 40 30 20 OE Boston 5 20 35 35 40 New York 25 40 40 20 Boston New York 20 LO 5 20 30 25 40 35

Statistics
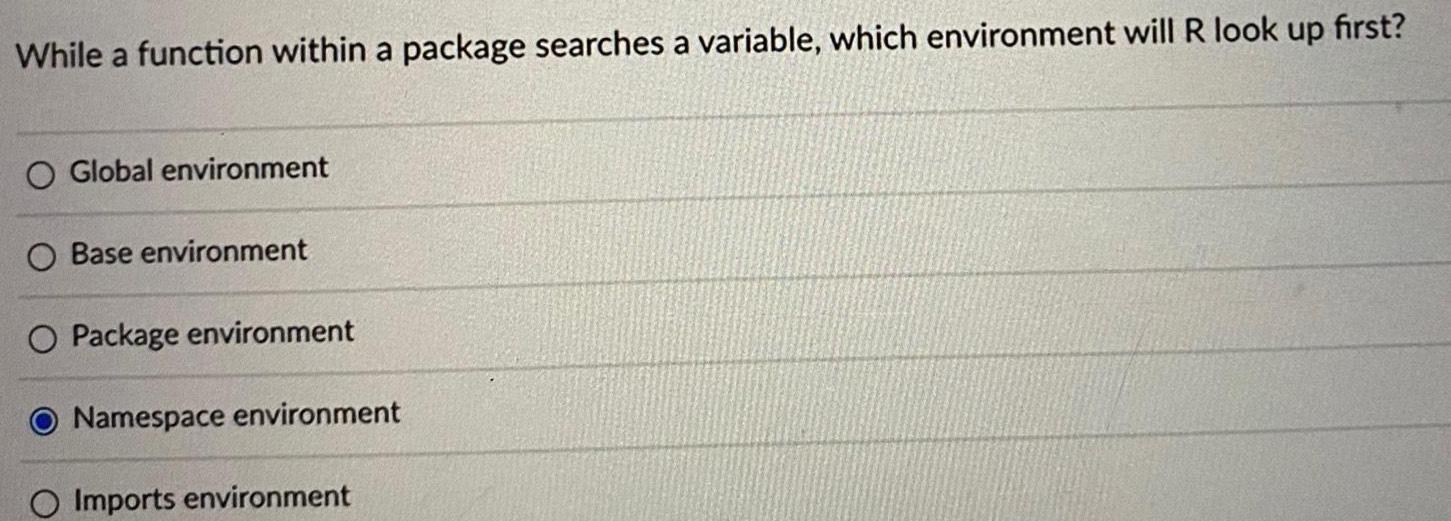
StatisticsWhile a function within a package searches a variable which environment will R look up first Global environment Base environment O Package environment Namespace environment O Imports environment
Statistics
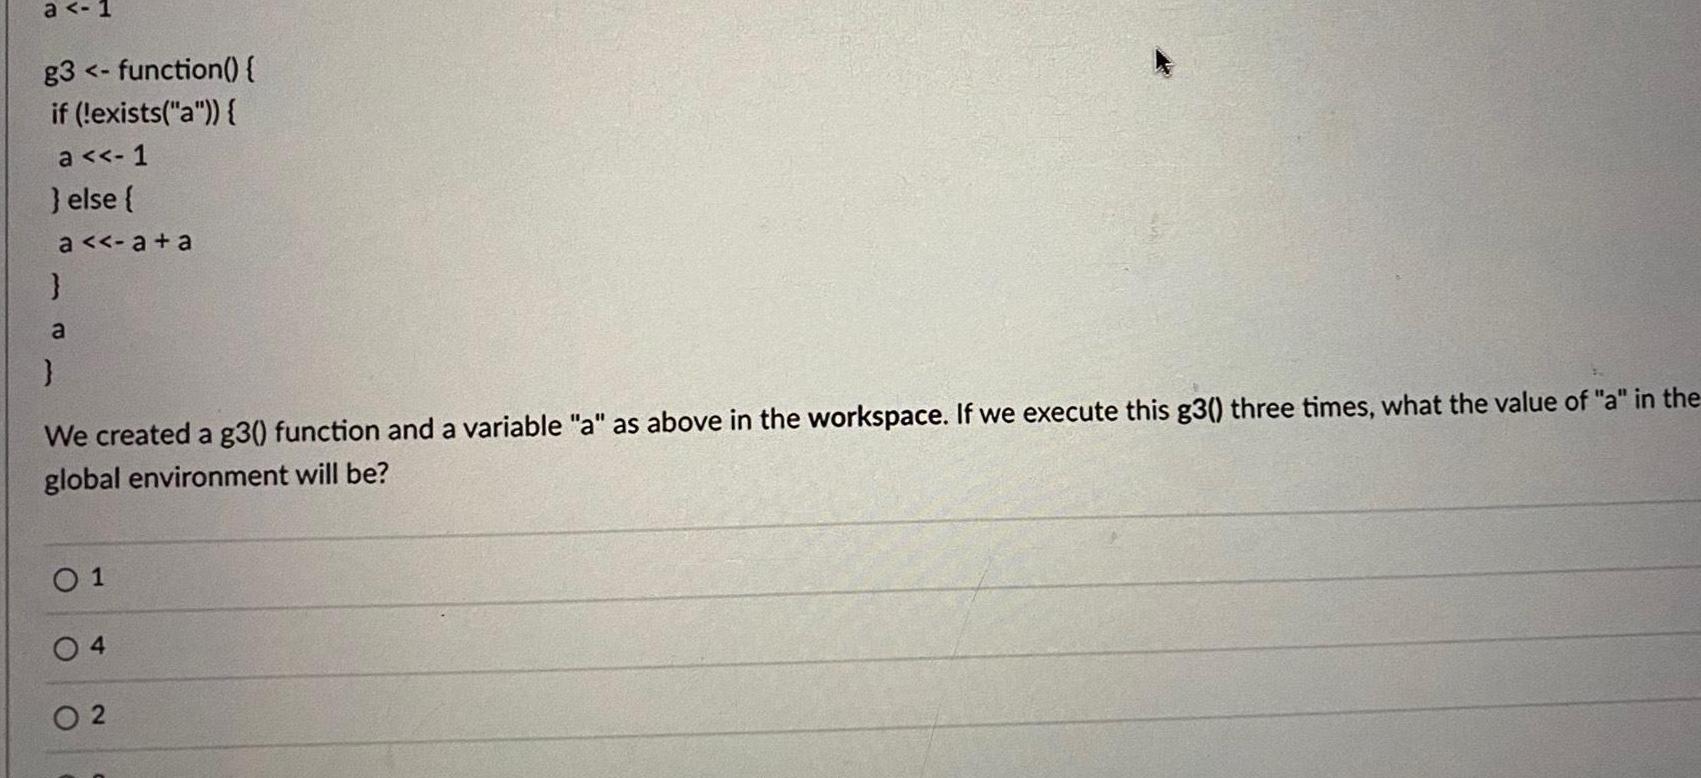
Probabilitya 1 g3 function if exists a a 1 else a a a a We created a g3 function and a variable a as above in the workspace If we execute this g3 three times what the value of a in the global environment will be 01 04 02
Statistics
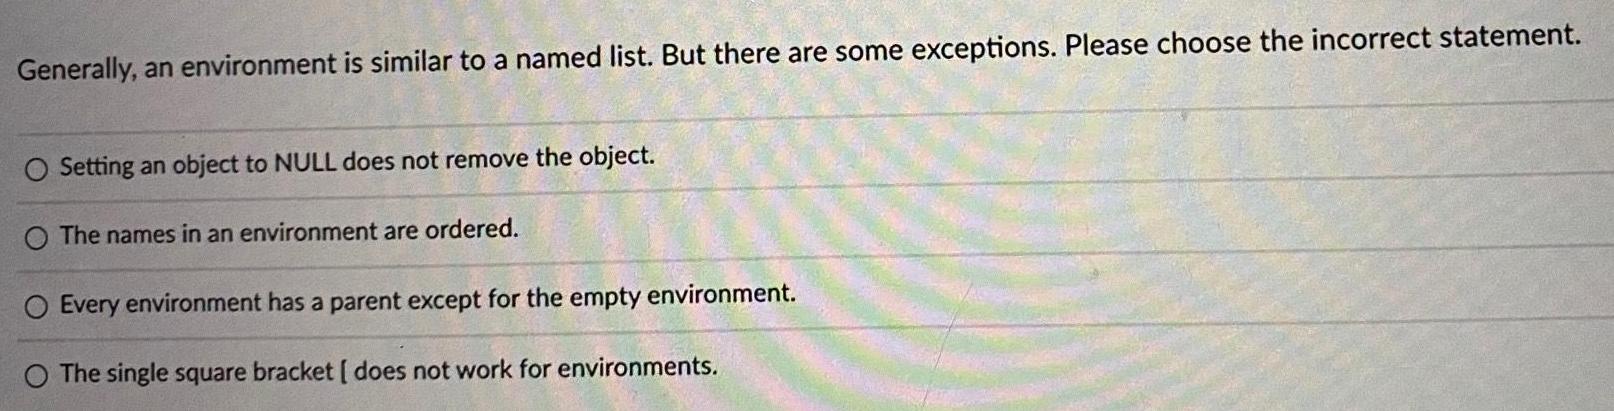
ProbabilityGenerally an environment is similar to a named list But there are some exceptions Please choose the incorrect statement O Setting an object to NULL does not remove the object O The names in an environment are ordered O Every environment has a parent except for the empty environment O The single square bracket does not work for environments
Statistics
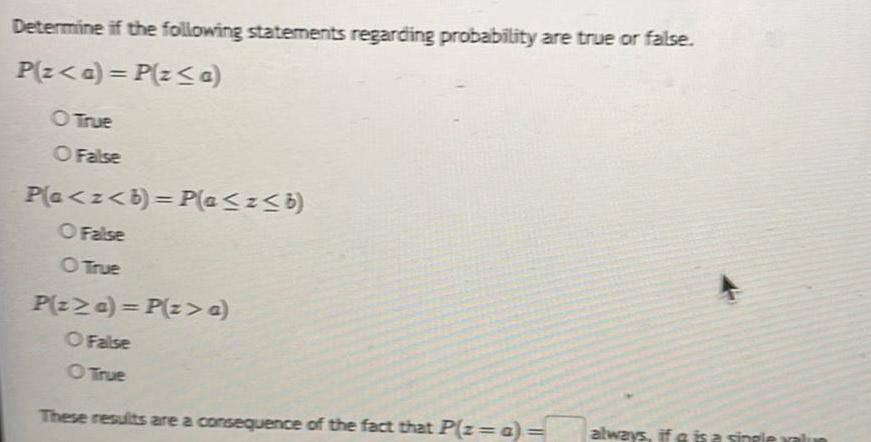
StatisticsDetermine if the following statements regarding probability are true or false P z a P z a O True O False Pla z b P a z b O False O True P z a P z a O False O True These results are a consequence of the fact that P z a always if a is a single
Statistics
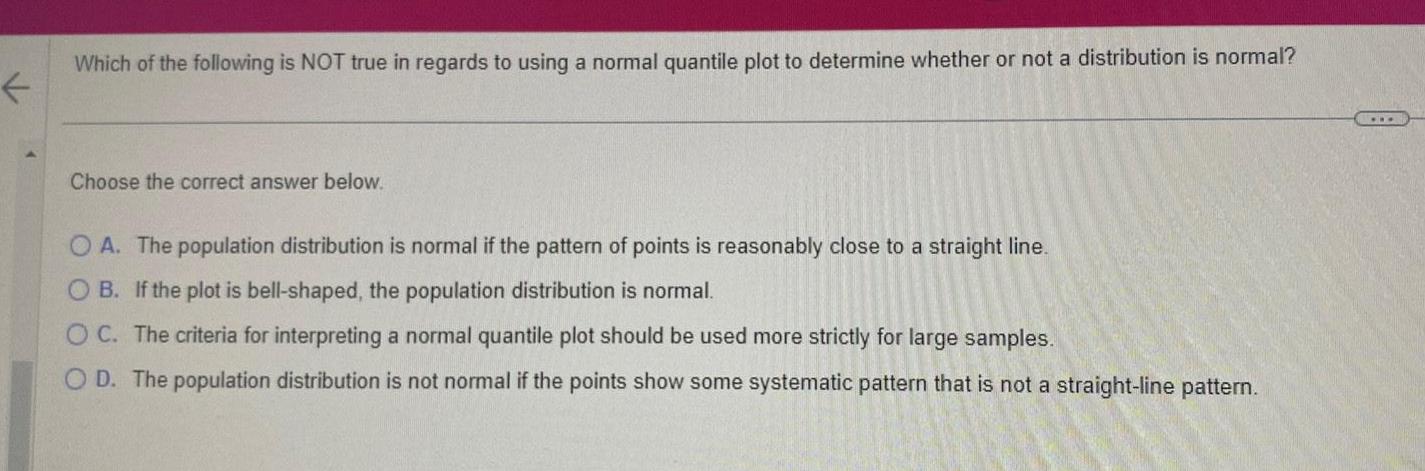
StatisticsWhich of the following is NOT true in regards to using a normal quantile plot to determine whether or not a distribution is normal Choose the correct answer below OA The population distribution is normal if the pattern of points is reasonably close to a straight line OB If the plot is bell shaped the population distribution is normal OC The criteria for interpreting a normal quantile plot should be used more strictly for large samples OD The population distribution is not normal if the points show some systematic pattern that is not a straight line pattern
Statistics
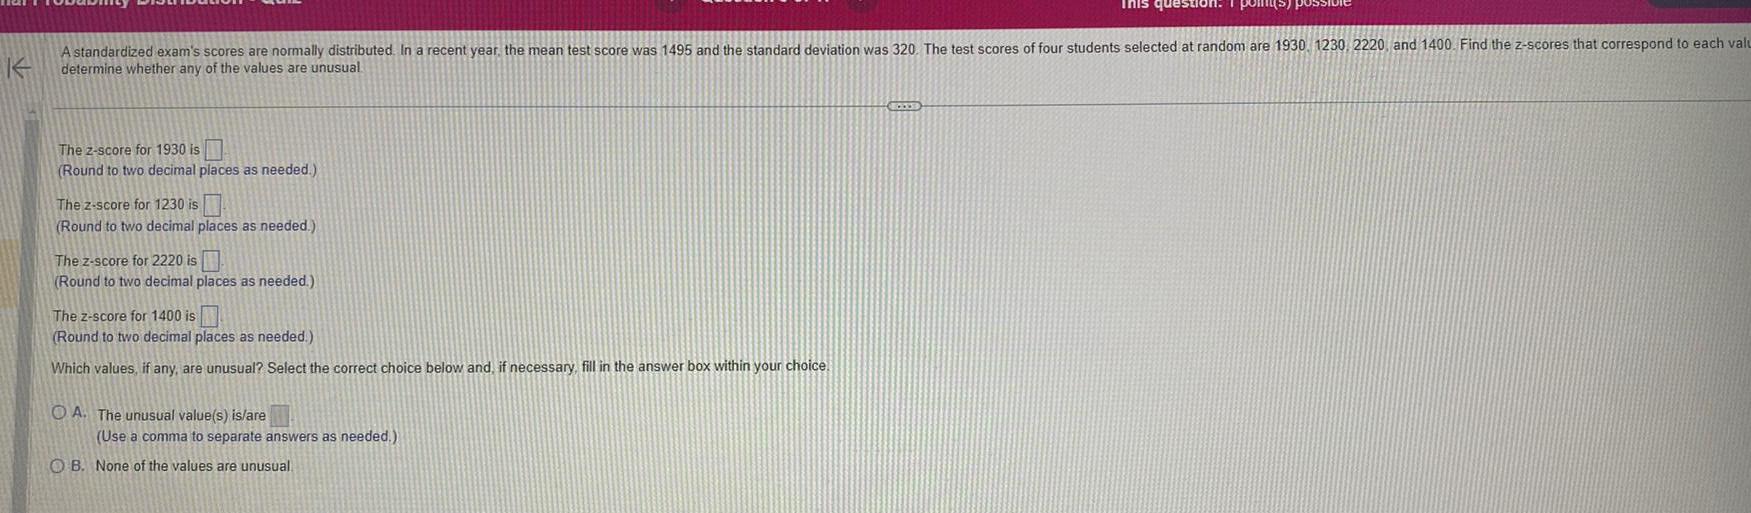
StatisticsK A standardized exam s scores are normally distributed In a recent year the mean test score was 1495 and the standard deviation was 320 The test scores of four students selected at random are 1930 1230 2220 and 1400 Find the z scores that correspond to each valu determine whether any of the values are unusual The 2 score for 1930 is Round to two decimal places as needed The z score for 1230 is Round to two decimal places as needed The z score for 2220 is Round to two decimal places as needed The z score for 1400 is Round to two decimal places as needed Which values if any are unusual Select the correct choice below and if necessary fill in the answer box within your choice OA The unusual value s is are Use a comma to separate answers as needed This question 1 point OB None of the values are unusual
Statistics
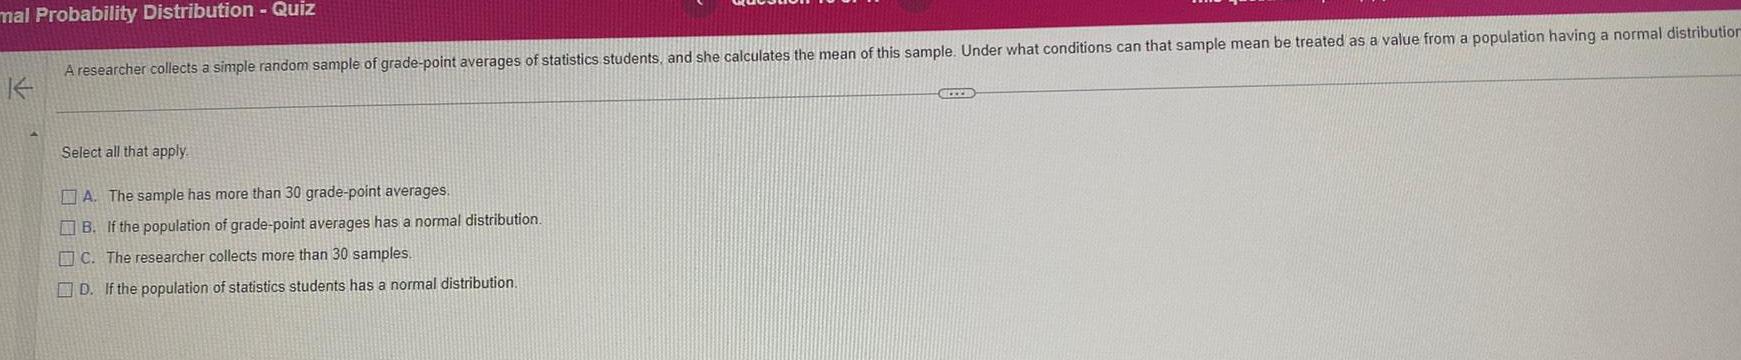
Statisticsmal Probability Distribution Quiz A researcher collects a simple random sample of grade point averages of statistics students and she calculates the mean of this sample Under what conditions can that sample mean be treated as a value from a population having a normal distribution Select all that apply A The sample has more than 30 grade point averages B If the population of grade point averages has a normal distribution C The researcher collects more than 30 samples D If the population of statistics students has a normal distribution CHEE
Statistics
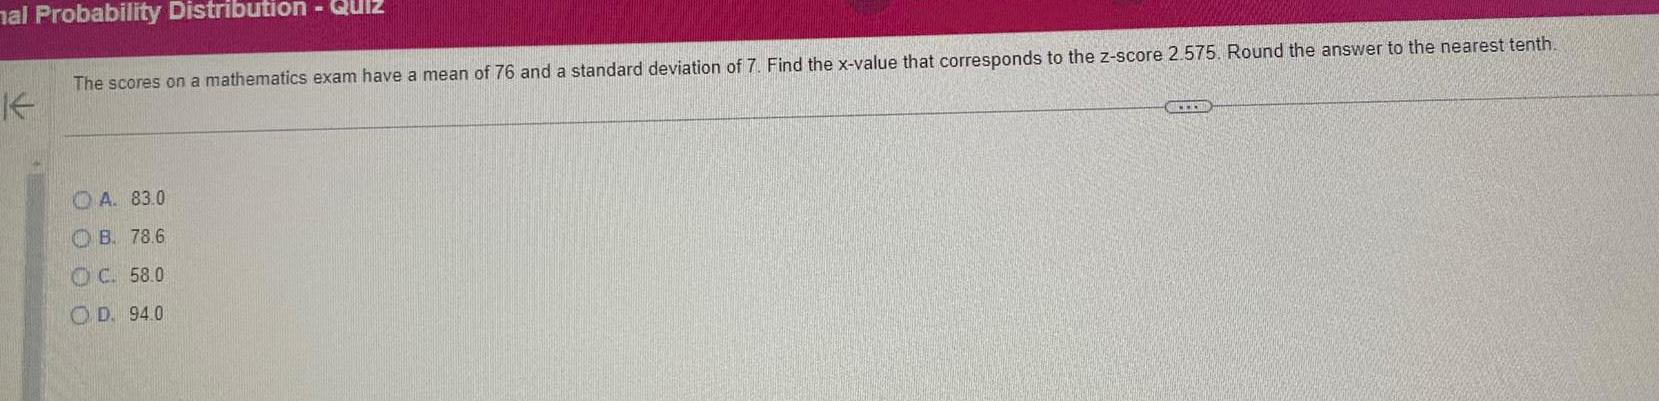
Statisticsmal Probability Distribution Quiz K The scores on a mathematics exam have a mean of 76 and a standard deviation of 7 Find the x value that corresponds to the z score 2 575 Round the answer to the nearest tenth A 83 0 B 78 6 OC 58 0 OD 94 0
Statistics
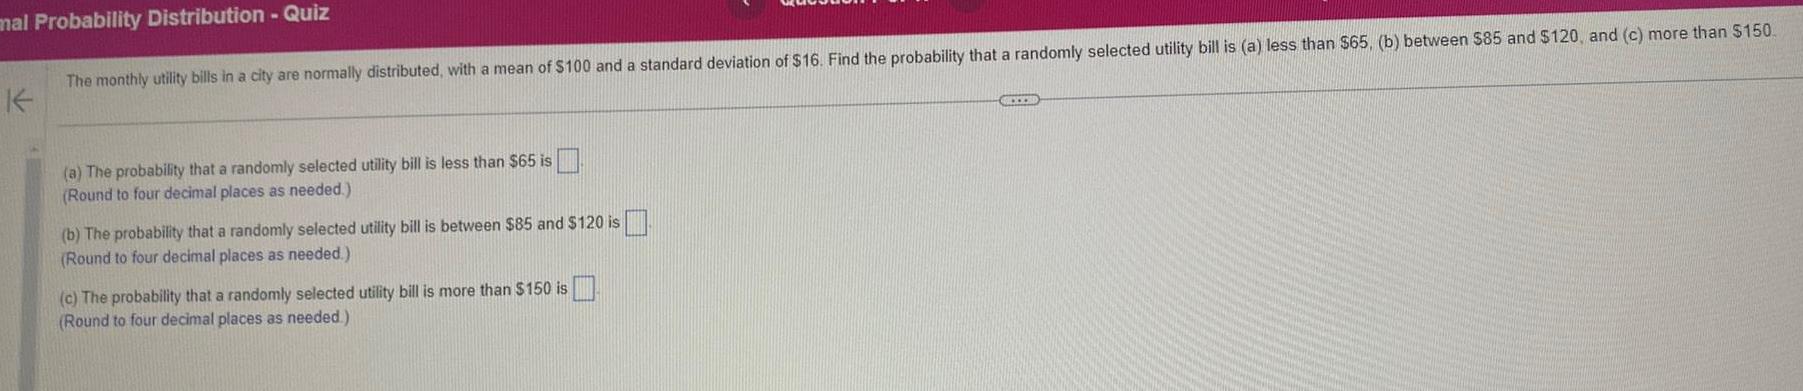
Statisticsmal Probability Distribution Quiz The monthly utility bills in a city are normally distributed with a mean of 100 and a standard deviation of 16 Find the probability that a randomly selected utility bill is a less than 65 b between 85 and 120 and c more than 150 a The probability that a randomly selected utility bill is less than 65 is Round to four decimal places as needed b The probability that a randomly selected utility bill is between 85 and 120 is Round to four decimal places as needed c The probability that a randomly selected utility bill is more than 150 is Round to four decimal places as needed CCXX
Statistics
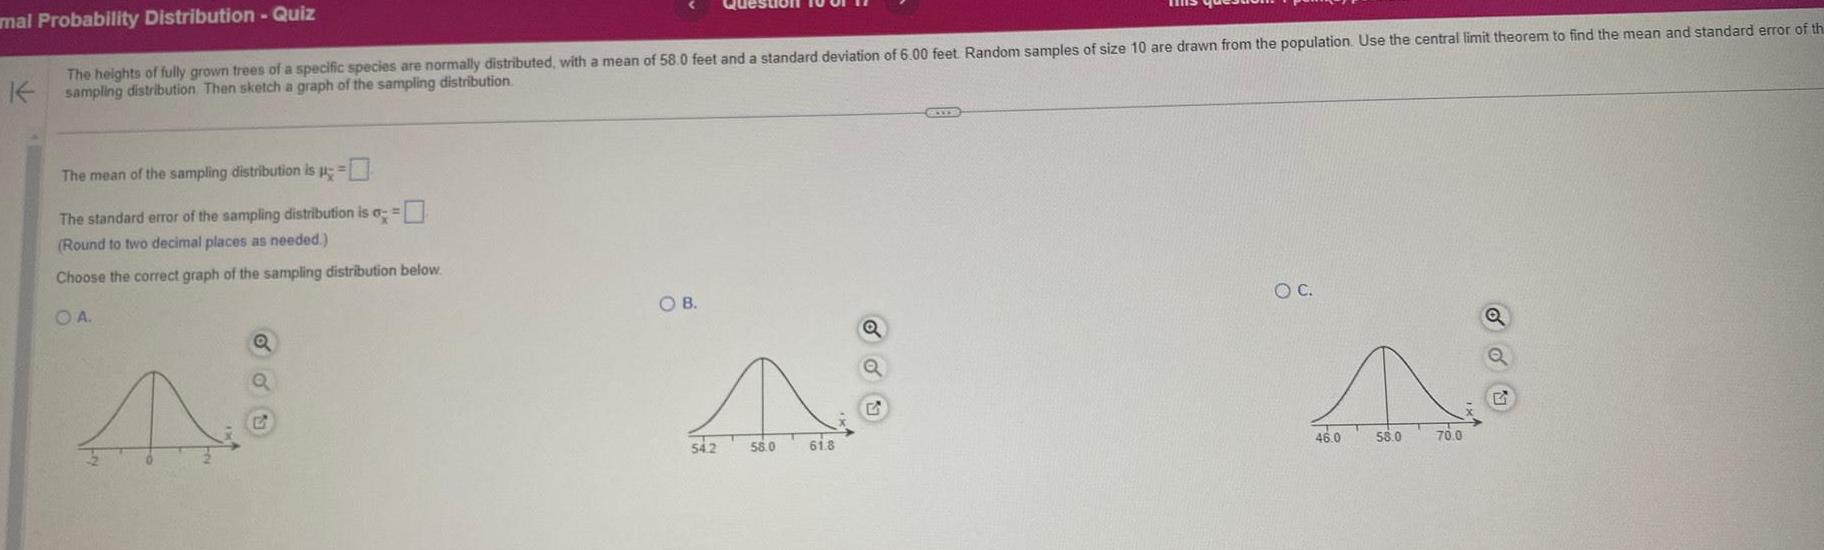
Statisticsmal Probability Distribution Quiz The heights of fully grown trees of a specific species are normally distributed with a mean of 58 0 feet and a standard deviation of 6 00 feet Random samples of size 10 are drawn from the population Use the central limit theorem to find the mean and standard error of th Ksampling distribution Then sketch a graph of the sampling distribution The mean of the sampling distribution is The standard error of the sampling distribution is a Round to two decimal places as needed Choose the correct graph of the sampling distribution below OA A Q Q OB A 54 2 58 0 61 8 O C N 58 0 70 0 46 0
Statistics
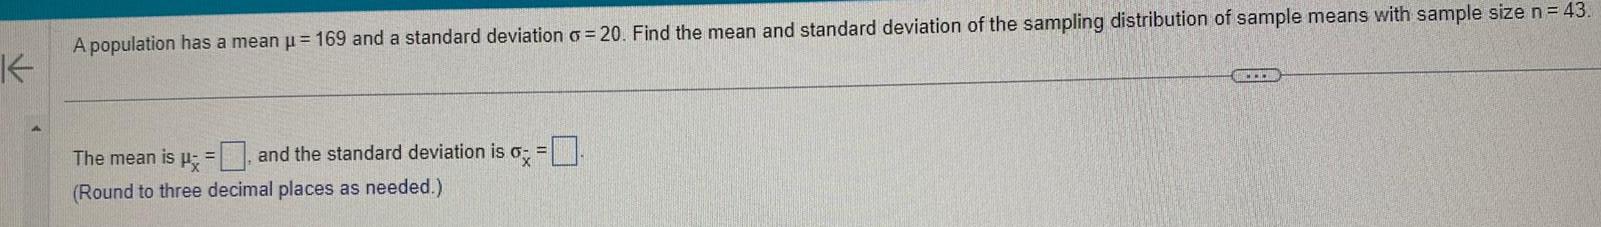
StatisticsA population has a mean 169 and a standard deviation 20 Find the mean and standard deviation of the sampling distribution of sample means with sample size n 43 K 6x The mean is and the standard deviation is Round to three decimal places as needed
Statistics
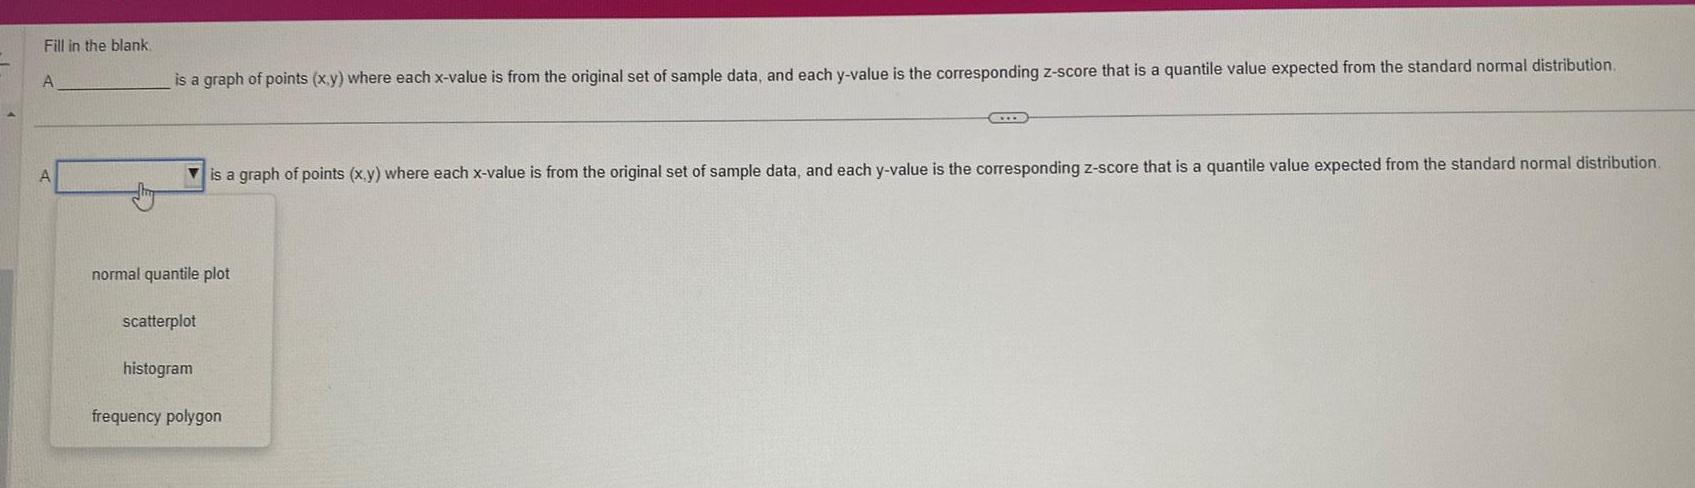
StatisticsFill in the blank A A is a graph of points x y where each x value is from the original set of sample data and each y value is the corresponding z score that is a quantile value expected from the standard normal distribution normal quantile plot scatterplot histogram is a graph of points x y where each x value is from the original set of sample data and each y value is the corresponding z score that is a quantile value expected from the standard normal distribution C frequency polygon

Statistics
StatisticsA population has a mean 84 and a standard deviation o 29 Find the mean and standard deviation of a sampling distribution of sample means with sample size n 259 H Part 1 of 2 Simplify your answer