Statistics Questions
The best high school and college tutors are just a click away, 24×7! Pick a subject, ask a question, and get a detailed, handwritten solution personalized for you in minutes. We cover Math, Physics, Chemistry & Biology.

Statistics
StatisticsSuppose the maximum and minimum values are removed from a data set The value of the median O will increase O remains unchanged O will be equal to the mean O will decrease

Statistics
Statisticsnich of the following characteristics does a box and whisker plot not show O center of the data O mode of the data O skew of the data O spread of the data

Statistics
StatisticsThe value of the first quartile for a data set is 32 This means that O 25 of the values in the data set are smaller than 32 O 32 of the values in the data set are smaller than 25 O 75 of the values in the data set are smaller than 32 O 50 of the values in the data set are smaller than 32

Statistics
StatisticsThe standard deviation is always measured in O the square root units of the original data O positive numbers greater than zero O the original data units squared O the same units as the original data

Statistics
StatisticsThe standard deviation of a data set is O calculated by squaring the variance O always larger than the variance O never negative O always smaller than the variance 15

Statistics
StatisticsQuestion 10 of 10 10 Given the observed table below calculate the expected frequency of individuals classified into category 3 of both variables when conducting a test of homogeneity Category 1 2 3 1 2 15 20 22 25 16 24 Answer 3 25 23 20 Round your answer to the nearest hundredths Continue Reset answer

Statistics
StatisticsChoose the correct answer below OA A small x test statistic leads us to conclude that there is not a good fit with the assumed distribution OB The test statistic is based on differences between the observed and expected values OC If the observed and expected frequencies are not close the x test statistic will be large and the P value will be sm

Statistics
StatisticsK Winning team data were collected for teams in different sports with the results given in the accompanying table Use a 0 05 significance level to test the claim that home visitor wins are independent of the sport Given that among the four sports included here baseball is the only sport in which the home team can modify field dimensions to favor its own players does it appear that baseball teams are effective in using this advantage Click the icon to view the data table Determine the null and alternative hypotheses Choose the correct answer below OA Ho Basketball games are not more likely to win at home than any other sport H Basketball games are more likely to win at home than any other sport OB Ho The home visitor win is independent of the sport H The home visitor win is not independent of the sport OC Ho The home visitor win is dependent on the ort H The home visitor win is not dependent on the sport GELB O D Ho Basketball games are more likely to win at home than any other sport H Basketball games are not more likely to win at home than any other sport Winning Team and Sports Data Home Team Wins Visiting Team Wins Basketball Baseball Hockey 123 51 53 67 50 40 Football 59 44 X

Statistics
StatisticsWhich of the following is NOT true Choose the correct answer below O A When testing for equality of three population means do not use multiple hypothesis tests with two samples at a time B If the decision from ANOVA is to reject the equality of the three population means the particular mean that differs from the others is known OC As the number of tests of significance increase the risk of finding a difference by chance alone increases O D The F test statistic is very sensitive to sample means even though it is obtained through two different estimates of the common population variance

Statistics
Probability3 The sign test is a nonparametric test used to compare two population medians True OFalse Continue Reset answer

Statistics
StatisticsQuestion 5 of 5 5 Given the observed table below calculate the chi square test statistic when conducting a test of homogeneity Category 1 2 3 1 12 Answer 10 14 2 16 22 24 3125 10 Round your answer to the nearest hundredths

Statistics
ProbabilityQuestion 2 of 10 2 A random sample of 50 individuals are classified into one of six categories If it is believed that the proportion of individuals that would be classified in category 5 is 0 20 what is the expected number of individuals to be classified out of 50 into category 5 Answer Continue Reset answer

Statistics
Statistics1 Arandom sample of individuals from a large population are categorized by two variables If the first variable has four different categories and the second variable has five different categories how many degrees of freedom does the chi square test statistic have when conducting a test of independence between the two variables Continue Reset answer

Statistics
StatisticsQuestion 2 of 5 2 A random sample of 400 individuals from a large population are categorized by two variables gender and smoking 220 of the 400 individuals are male 140 of the 400 individuals are smokers and 72 of the 400 individuals are male smokers How many male smokers would you expect when conducting a test of independence between the two variables gender and smoking assuming the null hypothesis is true Answer Continue Reset answer

Statistics
ProbabilityQuestion 4 of S 4 Given the observed table below calculate the expected frequency of individuals classified in category 3 of both variables when conducting a test of homogeneity Category 1 2 3 Do not round your answer Answer 1 2 17 21 24 26 15 3 24 28 21 24

Statistics
StatisticsUsing Pivot Tables find the mean and standard deviation of sales by region in the data provided Click the icon to view the data Complete the table below Type integers or decimals rounded to two decimal places as needed Average of Amount StdDev of Amount 38 265 50 358 63 506 20 537 20 28143 32 3663 East North South West Grand Total 95 67179 2 8703 3 05419 46 2537 North North West South 5 6 7 8 West 9 South 10 North 11 East 12 West 13 South 14 East 15 South 16 East 17 East 18 South 19 South 20 East 21 West 22 South 23 West 24 South 25 East 26 West 23 19 24 18 23 23 19 17 21 21 18 19 18 162 22 24 21 17 15 16 21 20 1

Statistics
Probability9 6 pts Find the six trigonometric functions of 8 if the given point 8 15 is on the terminal side of 0 In other words the point is the end of the hypotenuse from the origin and is the reference angle

Statistics
Statistics5 points Extra Credit A Bernoulli random variable X is a random variable that takes valu with probability and value 0 with probability 1 p Compute the expected value of a Bernoulli random variable Compute the standard deviation of a Bernoulli random variable

Statistics
Statistics5 points The average daily high temperature in June in a city is 79 F with a stand eviation of 7 F Suppose that the temperatures in June closely follow a normal distributi a 5 points What statistic would best measure the center of the data in this scena Why b 5 points What is the probability of observing an 88 temperature or higher in the during a randomly chosen day in June c 5 points How cool are the coldest 10 of the days days with lowest average high perature during June in the city

Statistics
Probability20 points Emma decides to play a game where she rolls two dice Below is a table displaying all of the possible combinations of rolling two dice Note that the two dice are independent of each other Also note 2 1 means the first roll was a 2 while the second roll was a 1 2 3 4 5 6 1 1 1 2 1 3 1 4 1 5 1 6 1 2 1 2 2 2 3 2 4 2 5 2 6 2 A 3 1 3 2 3 3 3 4 3 5 3 6 3 4 1 4 2 4 3 4 4 4 5 4 6 4 5 1 5 2 5 3 5 4 5 5 5 6 5 6 1 6 2 6 3 6 4 6 5 6 6 6 a 5 points What is the probability that they roll an odd number on either of the dice b 5 points What is the probability exactly both dice land on the same number c 5 points What is the probability that the sum of both dice is greater than 3 d 5 points What is the probability of getting a sum of 1

Statistics
Statisticsquality control expert at LIFE batteries wants to test their new batteries The design engineer claims they have a variance of 8464 with a mean life of 886 minutes f the claim is true in a sample of 145 batteries what is the probability that the mean battery life would differ from the population mean by less than 13 4 minutes Round your answer to four decimal places

Statistics
Probability20 points Let C and D be independent events with P C 0 35 P D 0 55 a 6 points What is P Cn D b 4 points Are C and D two disjoint events Why or why not c 6 points What is P CUD d 4 points Suppose there is a third event E that is independent from both C and D The P E 15 Do C D and E make a valid probability distribution

Statistics
StatisticsA case control or retrospective study was conducted to investigate a relationship between the colors of helmets worn by motorcycle drivers and whether they are injured or killed in a crash Results are given in the accompanying table Using a 0 05 significance level test the claim that injuries are independent of helmet color Color of Helmot 9 Black White Yellow 491 33 203 8 Controls not injured Cases Injured or killed Click here to view the chi square distribution table 352 106 VA Mo injunes and neimet color are independent H Injuries and helmet color are dependent OB Ho Whether a crash occurs and helmet color are dependent H Whether a crash occurs and helmet color are independent OC Ho Injuries and helmet color are dependent H Injuries and helmet color are independent Compute the test statistic Red 160 68 OD Ho Whether a crash occurs and helmet color are independent H Whether a crash occurs and helmet color are dependent Round to three decimal places as needed Find the critical value s Blue 75 36 Round to three decimal places as needed Use a comma to separate answers as needed What is the conclusion based on the hypothesis test

Statistics
StatisticsA poll was conducted to investigate opinions about global warming The respondents who answered yes when asked if there is solid evidence that the earth is getting warmer were then asked to select a cause of global warming The results are given in the accompanying data table Use a 0 01 significance level to test the claim that the sex of the respondent is independent of the choice for the cause of global warming Do men and women appear to agree or is there a substantial difference Human activity Natural patterns Don t know 50 47 Male 159 162 Female Click here to view the chi square distribution table 307 285 Identify the null and alternative hypotheses and Compute the test sitafisfic 0 Round to three decimal places as needed Find the critical value s Hp There and to agree are Round to three decimal places as needed Use a comma to separate answers as needed What is the conclusion based on the hypothesis test are sufficient evidence to warrant rejection of the claim that the sex of the respondent is independent of the choice for the cause of global warming Men and women

Statistics
StatisticsA certain statistics Instructor participates in triathlons The accompanying table lists times in minutes and seconds he recorded while riding a bicycle for five laps through each mile of a 3 loop Use a 0 05 significance level to test the claim that it takes the same time to ride each of the miles Does one of the miles appear to have a hill Click the icon to view the data table of the riding times Riding Times minutes and seconds Determine the null and alternative hypotheses Ho H Find the F test statistic Mile 1 Mile 2 Mile 3 3 14 3 23 3 24 3 22 3 20 3 19 3 21 3 22 3 16 3 19 3 34 3 31 3 28 3 30 3 29 Note when pasting the data into your technology each mile row will have separate columns for each minute and second entry You will need to convert each minute second entry into seconds only F Round to four decimal places as needed Find the P value using the F test statistic P value Round to four decimal places as needed What is the conclusion for this hypothesis test OA Fail to reject Ho There is sufficient evidence to warrant rejection of the claim that the three different mi OB Reject Ho There is sufficient evidence to warrant rejection of the claim that the three different miles have the same mean ride time OC Fail to reject Ho There is insufficient evidence to warrant rejection of the claim that the three different miles have the same mean ride time OD Reject Ho There is insufficient evidence to warrant rejection of the claim that the three different miles have the same mean ride time Print Does one of the miles appear to have a hill OA Yes these data suggest that the third and first miles appear to take longer and a reasonable explanation is that they both have hills OB Yes these data suggest that the first mile appears to take longer and a reasonable explanation is that it has a hill OC No these data do not suggest that any of the miles have a hill Done

Statistics
StatisticsControl or retrospective study was conducted to investigate a relationship between the colors of helmets worn by motorcycle drivers and whether they are injured or killed in a crash Results are given in the accompanying table Using a 0 05 significance level test the claim that injuries are independent of helmet color Color of Helmet Black White Yellow 491 352 33 203 106 8 Controls not Injured Cases Injured or killed Click here to view the chi square distribution table Identify the null and alternative hypotheses Choose the correct answer below OA Ho Injuries and helmet color are independent H Injuries and helmet color are dependent OB Ho Whether a crash occurs and helmet color are dependent H Whether a crash occurs and helmet color are independent C Ho Injuries and helmet color are dependent H Injuries and helmet color are independent Red 160 68 Compute the test statistic OD Ho Whether a crash occurs and helmet color are independent H Whether a crash occurs and helmet color are dependent Round to three decimal places as needed Find the critical value s Blue 75 36 Round to three decimal places as needed Use a comma to separate answers as needed What is the conclusion based on the hypothesis test CE T

Statistics
StatisticsRandomly selected birth records were obtained and categorized as listed in the table to the right Use a 0 01 significance level to test the reasonable claim that births occur with equal freque different days of the week How might the apparent lower frequencies on Saturday and Sunday be explained Day Number of Births Sun 38 Calculate the P value H At least one day has a different frequency of births than the other days Calculate the test statistic 9 334 Round to three decimal places as needed Mon 57 P value 0 1556 Round to four decimal places as needed What is the conclusion for this hypothesis test Tues 62 How might the apparent lower frequencies on Saturday and Sunday be explained Wed 58 OA Fail to reject Ho There is sufficient evidence to warrant rejection of the claim that births occur with equal frequency on the different days of the week B Reject Hp There is insufficient evidence to warrant rejection of the claim that births occur with equal frequency on the different days of the week OC Fail to reject Ho There is insufficient evidence to warrant rejection of the claim that births occur with equal frequency on the different days of the week OD Reject Hp There is sufficient evidence to warrant rejection of the claim that births occur with equal frequency on the different days of the week OA Induced or Caesarean section births are scheduled on weekends whenever possible Thurs 56 Fri 57 Sat 42

Statistics
Statisticsdisplayed results and use a 0 05 significance level What do you conclude Click the loon to view the date and two way analysis of variance results If appropriate determine the proper conclusion at the 0 05 significance level Choose the correct answer below OA Fall to reject Ho There is insufficient evidence to support the alternative hypothesis Gender does not appear to have an effect on distance between pupils B Reject Ho There is sufficient evidence to support the alternative hypothesis Gender appears to have an effect on distance between pupils OC Fall to reject Ho There is insufficient evidence to support the alternative hypothesis Handedness does not appear to have an effect on distance between pupils D Reject Ho There is sufficient evidence to support the altemative hypothesis Handedness appears to have an effect on distance between pupils OE This test is not appropriate due to the results of the test for Interaction between the two factors Data and Two Way ANOVA Results If appropriate test for an effect from the column factor Choose the correct answer below OA H Left handed people and right handed people have different population mean distances betw H Left handed people and right handed people have the same population mean distance betw OB Ho Men and women have the same population mean distance between pupils H Men and women have different population mean distances between pupils OC He Left handed people and right handed people have the same population mean distance betw H Left handed people and right handed people have different population mean distances betwe D H Men and women have different population mean distances between pupils H Men and women have the same population mean distance between pupils OE This test is not appropriate due to the results of the test for interaction between the two factors Source Interaction Row Variable Column Variable Female Male DF 1 1 1 Right Handed 65 64 60 59 55 66 64 67 68 69 SS 31 25 68 45 22 05 Print MS 31 25 68 45 22 05 Left Handed 70 62 63 69 62 68 68 63 67 66 Test Stat F 3 12500 6 84500 2 20500 Done Critical F 4 49401 4 49401 4 49401 I P Valu 0 0961 0 0187 0 1570

Statistics
StatisticsView the data and two way analysis of variance results If appropriate test for an effect from the row factor Choose the correct answer below OA Ho Left handed people and right handed people have different population mean distances between pupils H Left handed people and right handed people have the same population mean distance between pupils OB Ho Men and women have the same population mean distance between pupils H Men and women have different population mean distances between pupils OC Ho Men and women have different population mean distances between pupils H Men and women have the same population mean distance between pupils D Ho Left handed people and right handed people have the same population mean distance H Left handed people and right handed people have different population mean distances OE This test is not appropriate due to the results of the test for interaction between the two fact If appropriate determine the test statistic Select the correct choice below and if necessary fill in th OA The test statistic is www Round to two decimal places as needed OB This test is not appropriate due to the results of the test for interaction between the two fact If appropriate determine the P value Select the correct choice below and if necessary fill in the a Data and Two Way ANOVA Results Source Interaction Row Variable Column Variable Female Male DF 1 1 1 Right Handed 65 64 60 59 55 66 64 67 68 69 SS 31 25 68 45 22 05 Print MS 31 25 68 45 22 05 Left Handed 70 62 63 69 62 68 68 63 67 66 C 4 49401 Test Stat F Critical F 3 12500 6 84500 2 20500 4 49401 4 49401 Done P Value 0 09616 0 01871 0 15700

Statistics
StatisticsIn a study of high school students at least 16 years of age researchers obtained survey results summarized in the accompanying table Use a 0 05 significance level to test the claim of independence between texting while driving and driving when drinking alcohol Are those two risky behaviors independent of each other Click the icon to view the table of survey results Determine the null and alternative hypotheses Ho H Determine the test statistic x Round to two decimal places as needed Determine the P value of the test statistic P value Round to three decimal places as needed Do the results suggest that texting while driving and driving while drinking are related OA Reject the null hypothesis There is sufficient evidence at a 0 05 significance level to warrant rejection of the claim of Independence between texting while driving and driving while drinking alcohol Those two risky behaviors appear to be somehow related OB Fail to reject the null hypothesis There is not sufficient evidence to warrant rejection of the claim that texting while driving happens 95 of the time when driving while drinking alcohol OC Fail to reject the null hypothesis There is not sufficient evidence at a 0 05 significance level to warrant rejection of the claim of independence between texting while driving and driving while drinking alcohol Those two risky behaviors are not related OD Reject the null hypo Survey Results Drove When Drinking Alcohol Yes No D X 5 of the time when driving while drinking alcohol d

Statistics
StatisticsClick the loon to view the data and two way analysis of variance results First test for an interaction between the two OA Ho Distances between pupils are n H Distances between pupils are a OB Ho Distances between pupils are n H Distances between pupils are a OC Ho Distances between pupils are a H Distances between pupils are n OD Ho Distances between pupils are n H Distances between pupils are a Determine the test statistic The test statistic is Round to two decimal places as needed Determine the P value Data and Two Way ANOVA Results Source Interaction Row Variable Column Variable Female Male DF 1 1 1 Right Handed 65 64 60 59 55 66 64 67 68 69 SS 31 25 68 45 22 05 Print The P value is Round to three decimal places as needed Determine the proper conclusion at the 0 05 significance level Choose the correct answer below MS 31 25 68 45 22 05 Left Handed 70 62 63 69 62 68 68 63 67 66 Test Stat F Critical F 4 49401 3 12500 6 84500 2 20500 Done 4 49401 4 49401 P Value 0 09616 0 01871 0 15700 X

Statistics
StatisticsA data set includes the counts of chocolate chips from three different types of Chips Ahoy cookies The accompanying StatCrunch display shows results from analysis of variance used with those three types of cookies Use a 0 05 significance level to test the claim that the three different types of cookies have the same mean number of chocolate chips ANOVA table Source DF Columns Error Total Ho Determine the null hypothesis H SS MS F Stat P value 998 9875 499 49375 60 4511 0 0001 Determine the alternative hypothesis 2 77 636 23333 8 2627705 79 1635 2208 Determine the test statistic The test statistic is Round to two decimal places as needed Determine the P value There The P value is Round to three decimal places as needed What can you conclude pooking baya sufficient evidence at a 0 05 significance level to warrant rejection of the claim that the three different types of chocolate chip of

Statistics
StatisticsFirst test for an interaction between the two factors Determine the null and alternative hypotheses Choose the correct answer below OA Ho Distances between pupils are not affected by handedness H Distances between pupils are affected by handedness OB Ho Distances between pupils are not affected by gender H Distances between pupils are affected by gender and De OC Ho Distances between pupils are affected by an interaction between gender and handedness H Distances between pupils are not affected by an Interaction between gender and handedness De O D Ho Distances between pupils are not affected by an interaction between gender and handedness H Distances between pupils are affected by an interaction between gender and handedness Data and Two Way ANOVA Results De analysis of variance results Source Interaction Row Variable Female Male DF 1 1 Right Handed 65 64 60 59 55 66 64 67 68 69 SS 31 25 68 45 MS 31 25 68 45 Left Handed 70 62 63 69 62 68 68 63 67 66 Test Stat F 3 12500 6 84500 Critical F 4 49401 4 49401 P Value 0 09616 0 01871 X
Statistics
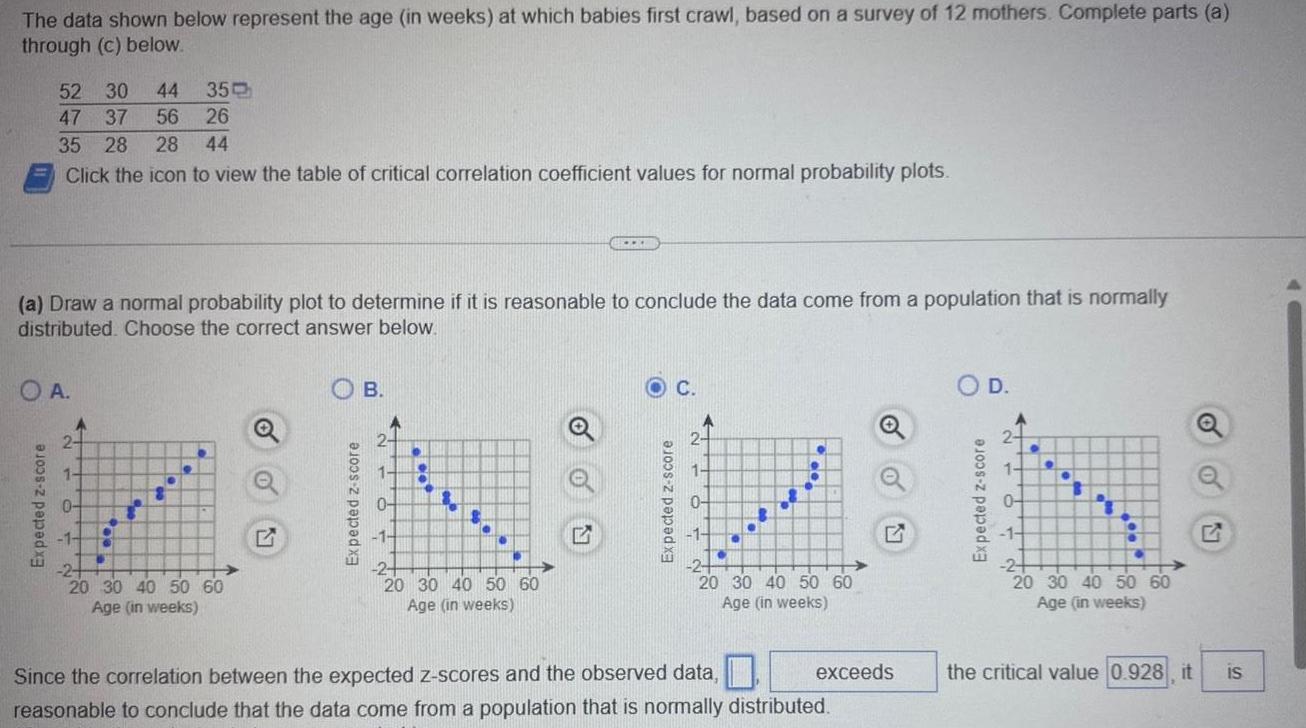
StatisticsThe data shown below represent the age in weeks at which babies first crawl based on a survey of 12 mothers Complete parts a through c below 52 30 44 35 47 37 56 26 35 28 28 44 Click the icon to view the table of critical correlation coefficient values for normal probability plots a Draw a normal probability plot to determine if it is reasonable to conclude the data come from a population that is normally distributed Choose the correct answer below O A 2 1 0 1 2 20 30 40 50 60 Age in weeks O B 20 30 40 50 60 Age in weeks C 20 30 40 50 60 Age in weeks exceeds Since the correlation between the expected z scores and the observed data reasonable to conclude that the data come from a population that is normally distributed D 20 30 40 50 60 Age in weeks the critical value 0 928 it o O IS 3279

Statistics
Probability2 A statistics student observed 80 random numbers generated from a computer of which eighteen were twos If it is believed that the expected proportion of twos generated is 0 20 what is the expected number of twos Answer Continue Reset answer

Statistics
Statistics6 Assume that cans of Coke are filled so that the actual amounts have a mean of 12 00 oz and a standard deviation of 0 14 oz a Find the standard error of x when the sample size is n 49 cans Answer b Find probability that a sample of 49 cans will have a mean amount of at least 12 06 oz Answer cl Find yo such that P 11 95 0 99


Statistics
Statistics8 Many studies have been conducted to test the effects of marijuana use on mental abilities In one such study groups of light and heavy users of marijuana in college were tested for memory recall with the summary results given below Marijuana Light Use Heavy Use Answer H 0 Value Rejection Region P value Conclusion n n 65 n 65 a Use a 0 01 significance level to test the claim that the population of heavy marijuana users has a lower mean than the light users Fill in the expressions below H Mean Keep H 0 1 53 3 51 3 Standard Deviation S 3 6 4 5 Test statistics Critical Reject H 0 b Which confidence level is appropriate here to construct a confidence interval for the difference between the two population means

Statistics
Statistics3 Select the answer using one of the four options presented below During one recent year U S consumers redeemed 6 52 billion manufacturers coupons and saved themselves 2 16 billion Calculate and interpret the mean savings per coupon A The average savings was 301 9 cents per coupon B Half of all coupons were worth more than 0 33 in savings C Half of all coupons were worth more than 301 9 cents in savings D The average savings was 0 33 per coupon

Statistics
Statistics5 The width of a confidence interval for a population mean of Venture Capital Investments is 20 billion dollars a Determine the margin of error b If the sample mean is 60 billion dollars obtain the confidence interval

Statistics
Probability2 A survey was conducted to determine how people feel about the quality of sports programming available on television Respondents were asked to rate the overall quality from 0 no quality at all to 100 extremely good quality The stem and leaf display of the data is shown below Stems Leaves 689 7 3 4 5 01135567 6 0234456789 7 0001589 8 0135679 9 5899 What percentage of the responders rated overall quality as very good rating of 80 or more

Statistics
Statistics7 Farmers have discovered that the more domestic chickens peck at objects placed in their environment the healthier and more productive the chickens seem to be White string has been found to be a particularly attractive pecking stimulus In one experiment 72 chickens were exposed to a string stimulus Instead of white string blue colored string was used The number of pecks each chicken took at the blue string over a specified time interval was recorded Summary statistics for the 72 chickens were 1 13 pecks s 2 21 pecks Applied Animal Behavior Science October 2000 a Estimate the population mean number of pecks made by chickens pecking at blue string using a 99 confidence interval b Previous research has shown that u 7 5 pecks if chickens are exposed to white string Based on the results part a is there evidence that chickens are more apt to peck at white string than blue string

Statistics
Statistics1 Circle your answer using one of the three options presented below and draw a sketch of a Pareto plot for these data Chart of PARTY O

Statistics
Probability4 A financial service has 500 clients enrolled and the upper management wants to know whether the service it provides to affluent clients differs from the service it provides to lower income clients Each client is asked to rate his or her contact person at this financial institution The classification of the service provided is A outstanding A average and A under 2 poor The income categories of the clients are B 50 000 B 50 000 to under 100 000 and B 100 000 2 or more The results are shown in the table below Answer the following items a Complete the table b P BB c P B A d Are A and B independent events YES NO 3 Why

Statistics
Statistics4 Given the observed table below calculate the expected frequency of category 4 if each category is hypothesized to be equally likely Category 1 2 3 4 5 Frequency 10 9 14 12 15 Answer Continue Reset answer

Statistics
Statistics1 A random sample of individuals from a large population are categorized into 8 categories If a chi square goodness of fit test is conducted to test the observed frequency distribution against a hypothesized frequency distribution what is the degrees of freedom of the test statistic Answer Continue Reset answer

Statistics
Statisticsthe weights lb and highway fuel consumption amounts mi gal of the 48 cars listed in the accompanying data set one gets this regression equation y 58 9 0 00749x where x represents weight Complete parts a through d Click the icon to view the car data Cine slope is 58 9 and the y intercept is U UU 49 D The slope is 0 00749 and the y intercept is 58 9 c What is the predictor variable A The predictor variable is weight which is represented by x B The predictor variable is weight which is represented by y OC The predictor variable is highway fuel consumption which is represented by x OD The predictor variable is highway fuel consumption which is represented by y d Assuming that there is a significant linear correlation between weight and highway fuel consumption what is the best predicted value for a car that weighs 3008 lb The best predicted value of highway fuel consumption of a car that weighs 3008 lb ismi gal Round to one decimal place as needed

Statistics
StatisticsSketch a direction field for dy 2t y Use the direction field to sketch a solution curve for the initia condition y 0 1 dx

Statistics
ProbabilityA single die is rolled one time Find the probability of rolling a number at most 4 or a prime number 4 6 02 6 3 6 05 6

Statistics
ProbabilityThe life expectancy at birth of a person born in year x is approximated by the function f x 14 5 12 3 In x where x 0 corresponds to the year 1910 If this function remains accurate when will life expectancy at birth be 72 9 years O In the year 2034 O In the year 2030 O In the year 2026 O In the year 2038