Statistics Questions
The best high school and college tutors are just a click away, 24×7! Pick a subject, ask a question, and get a detailed, handwritten solution personalized for you in minutes. We cover Math, Physics, Chemistry & Biology.

Statistics
StatisticsA test consists of 10 multiple choice questions each with five possible answers one of which is correct To pass the test a student must get 60 or better on the test If a student randomly guesses what is the probability that the student will pass the test 0 0 006 O 0 205 0060

Statistics
StatisticsA manager wishes to determine the relationship between the number of miles in hundreds of miles the manager s sales representatives travel per month and the amount of sales in thousands of dollars per month Find the test statistic Miles traveled x Sales y O 1 89 632 22 062 2 23 31 3 c 22 000 15 3 1 120

Statistics
Statisticssuperintendent of a school district wants to understand the link between tendance and grade point average or GPA The GPA is out of 4 0 points with 0 being the highest possible The percent attendance and GPA of 10 randomly ampled students from the superintendent s district were collected This sample data is reproduced in the table below Calculate the correlation coefficient Round to two decimal places 3 5 2 38 116 3 83 3 28 3 69 3 46 3 87 3 69 3 75 Attendance 91 74 80 97 59 78 90 98 94 87 GPA

Statistics
StatisticsA nurse at a local hospital is interested in estimating the birth weight of infants How large a sample must she select if she desires to be 99 confident that the true mean is within 2 ounces of the sample mean The standard deviation of the birth weights is known to be 7 ounces O 10 O 81 82

Statistics
StatisticsA researcher claims that 62 of voters favor gun control Assuming that a hypothesis test of the claim has been conducted and that the conclusion is failure to reject the null hypothesis state the conclusion in nontechnical terms There is not sufficient evidence to warrant rejection of the claim that 62 of voters favor gun control There is sufficient evidence to support the claim that more than 62 of voters favor gun control There is not sufficient evidence to support the claim that 62 of voters favor gun control There is sufficient evidence to warrant rejection of the claim that 62 of voters favor gun control

Statistics
StatisticsThe distribution of cholesterol levels in teenage boys is approximately normal with m 170 and s 30 Source U S National Center for Health Statistics Levels above 200 warrant attention Find the probability that a teenage boy has a cholesterol level greater than 200 O 0 8413 00 3419 00 2138

Statistics
StatisticsWith 95 confidence interval and n 12 Find right critical value for Zinterval O2 201 O 1 796 01 96

Statistics
ProbabilityHypothesis testing concepts For a test of Ho p 0 60 the test statistic is determined to be z 2 11 a If the alternative hypothesis is Ha p 0 60 The P value is 0 0174 four decimal places b If the alternative hypothesis is Ha p 0 60 The P value is 0 0174 four decimal places c For a test of Ho p0 60 the P value is places round to round to round to four decimal d Do either of the P values in b or c give significant evidence against Ho using a significance level of 5 O Both of the P values give significant evidence against Ho Neither of the P values suggest that the null hypothesis is plausible One of the P values gives significant evidence against Ho and the other P value indicates that the null hypothesis is plausible ONeither of the P values gives significant evidence against Ho Both of the P values indicate that the null hypothesis is plausible

Statistics
StatisticsTest the claim that the mean GPA of night students is smaller than 3 5 at the 0 10 significance level The null and alternative hypotheses would be Ho 3 5 Ho p 0 875 Ho 3 5 Ho p 0 875 Ho 3 5 Ho p 0 875 H 3 5 H p 0 875 H 3 5 H p0 875 H 3 5 H p 0 875 O O The test is two tailed right tailed left tailed Based on a sample of 35 people the sample mean GPA was 3 48 with a standard deviation of 0 06 The p value is The significance level is Based on this we O Reject the null hypothesis Fail to reject the null hypothesis to 3 decimals to 2 decimals

Statistics
StatisticsIn a poll Australians were asked if they thought unemployment would increase At that time 284 out of 605 said that they thought unemployment would increase Estimate the proportion of Australians who believed unemployment would increase using a 99 confidence interval Round to three decimal places With that Australians who believed unemployment would increase is between and confidence we can conclude that the true proportion of defects

Statistics
ProbabilityK The acceptable level for insect filth in a certain food item is 3 insect fragments larvae eggs body parts and so on per 10 grams A simple random sample of 50 ten gram portions of the food item is obtained and results in a sample mean of x 3 2 insect fragments per ten gram portion Complete parts a through c below a Why is the sampling distribution of x approximately normal OA The sampling distribution of x is assumed to be approximately normal B The sampling distribution of x is approximately normal because the sample size is large enough OC The sampling distribution of x is approximately normal because the population is normally distributed OD The sampling distribution of x is approximately normal because the population is normally distributed and the sample size is large enough b What is the mean and standard deviation of the sampling distribution of x assuming 3 and a 3 Hx Round to three decimal places as needed Round to three decimal places as needed of c What is the probability a simple random sample of 50 ten gram portions of the food item results in a mean of at least 3 2 insect fragments P x 3 2 Round to four decimal places as needed Is this result unusual OA This result is not unusual because its probability is large OB This result is unusual because its probability is small OC This result is unusual because its probability is large O D This result is not unusual because its probability is small What might we conclude A Since this result is unusual it is not reasonable to conclude that the population mean is higher than 3 OB Since this result is not unusual it is not reasonable to conclude that the population mean is higher than 3 OC Since this result is not unusual it is reasonable to conclude that the population mean is higher than 3 OD Since this result is unusual it is reasonable to

Statistics
ProbabilityAssume that the heights of of adult males in a certain region are normally distributed The heights in inches of 20 randomly selected adult males from this region are listed below 70 72 71 70 69 73 69 68 70 71 67 71 70 74 69 68 71 71 71 72 Use this sample data and construct a 98 confidence interval for the population standard deviation

Statistics
ProbabilityThe recommended hours of sleep per night for adults is 8 hours A doctor who works at a sleep study facility believes the average number of hours of sleep per night for adults is more than the recommended 8 hours To test this claim at 5 significance level the doctor collects the following data on a sample of 25 adults at a sleep study facility and records their amount of sleep the following is the data from this study sample size 25 adults sample mean 8 5 hours sample standard deviation 0 9 hours Identify the null and alternative hypothesis for this study by filling in the blanks with correct symbol Hop Select Ha p Select 8

Statistics
StatisticsAn economist wondered if people who go to the movies on weekdays go more or less often on Fridays than any other day She figured that if it were truly random 20 of these movie goers would go on Fridays She randomly sampled 50 people who go to movies on weekdays and asked them on which d y they attend movies most frequently Of those sampled 14 indicated that they go on Fridays more often than other days The economist conducts a one proportion hypothesis test at the 5 significance level to test whether the true proportion of weekday movie goers who go most frequently on Fridays is different from 20 For this test Ho p 2 Ha p 2 Find the test statistic Find the p value Round to three decimal places Found to three decimal places

Statistics
StatisticsAccording to a recent study the mean number of hours college students spent studying per month was 75 hours with a population standard deviation of 25 hours Two weeks before final exams were scheduled to begin 100 college students were randomly selected Use a calculator and central limit theorem to find the probability that the mean number of hours spent studying is less than 70 hours Round your answer to three decimal places if necessary 14x

Statistics
ProbabilitySuppose that the delivery times for a local pizza delivery restaurant are normally distributed with an unknown mean and standard deviation A random sample of 24 deliveries is taken and gives a sample mean of 27 minutes and sample standard deviation of 6 minutes The confidence interval is 24 47 29 53 Find the margin of error for a 95 confidence interval estimate for the population mean

Statistics
Probabilityhe pages per book in a library are normally distributed with an unknown opulation mean A random sample of books is taken and results in a 95 confidence interval of 237 293 pages What is the correct interpretation of the 95 confidence interval O We estimate with 95 confidence that the sample mean is between 237 and 293 pages O We estimate that 95 of the time a book is selected there will be between 237 and 293 pages O We estimate with 95 confidence that the true population mean is between 237 and 293 pages

Statistics
StatisticsThe diameters of apples from a certain farm follow the normal distribution with mean 4 inches and standard deviation 0 4 inch Apples can be size sorted by being made to roll over mesh screens First the apples are rolled over a screen with mesh size 3 5 inches This separates out of all the apples with diameters less than 3 5 inches Second the remaining apples are rolled over a screen with mesh size 4 3 inches During that first step what proportion of apples have a diameter of less than 3 5 inches Round your answer to four decimal places

Statistics
ProbabilityIn a large city s recent mayoral election 131 506 out of 309 153 registered voters actually turned out to vote If 20 registered voters are randomly selected find the probability that 7 of them voted in the mayoral election Use TI 84 plus calculator to find the binomial probability Round your answer to three decimal places

Statistics
ProbabilityA basketball player has a 0 654 probability of making a free throw If the player shoots 13 free throws what is the probability that she makes less than 6 of them Insert the correct symbol to represent this probability U P X Select V 5

Statistics
StatisticsThe amount of time it takes Emma to wait for the train is continuous and Uniformly distributed between 4 minutes and 11 minutes What is the probability that it take Emma more than 5 minutes to wait for the train O3 14 5 14 O 4 7 O 5 7 O 6 7

Statistics
ProbabilityA casino features a game in which a weighted coin is tossed several times The table shows the probability of each payout amount To the nearest dollar what is the expected payout of the game round to the nearest whole dollar Payout Amount 150 0 161 2800 0 03 105000 0 0006 Probability

Statistics
StatisticsThe city council conducts a survey of the city s residents to determine which services are most used by the community 60 of the residents say that they use the library and 35 of the residents say they use the library and the recycling center What is the probability that a resident uses the recycling center given that they use the library Express your answer as a decimal rounded to three decimal places

Statistics
ProbabilitySuppose A and B are mutually exclusive events and that P A 0 13 and P B 0 85 Find P A or B 0 98

Statistics
StatisticsSarah has two tests at school next week a math test and a physics test Let A represent the event that she passes her math test and B represents the event that she passes her physics test If A and B are independent events with P A 0 30 and P A and B 0 21 find P B Give your answer as a decimal rounded to two decimal places

Statistics
StatisticsThe owner of a radio station wants to determine how much airtime songs take up The owner collects the song length in seconds of 10 population songs The data are reproduced in the table below Calculate the mode s using a TI 83 TI 83 plus or Tl 84 graphing calculator 279 219 298 134 206 293 165 227 230 212 O There are two modes The modes are 134 and 298 O There is one mode The mode is 223 O There is one mode The mode is 298 O There is no mode

Statistics
Statistics34 According to a recent report customers who shop at a certain online store spend on average 1 500 a year at the store To investigate whether the mean amount spent was greater than the reported average an economist obtained the mean and standard deviation of the amount spent in the past year by a random sample of 120 customers who shop at the store With all conditions for inference met the economist conducted the appropriate hypothesis test and obtained a p value of 0 25 Which of the following statements is the most appropriate conclusion for the investigation A There is convincing statistical evidence that the mean amount of money spent each year by all customers who shop at the store is 1 500 B There is convincing statistical evidence that the mean amount of money spent each year by all customers who shop at the store is greater than 1 500 C There is convincing statistical evidence that the mean amount of money spent each year by all customers who shop at the store is less than 1 500 D There is not convincing statistical evidence that the mean amount of money spent each year by all customers who shop at the store is greater than 1 500 E There is not convincing statistical evidence that the mean amount of money spent each year by any sample of 120 customers who shop at the store is greater than 1 500

Statistics
Statisticsestion 6 Dollar General has increased their number of stores tremendously over t decade In 2020 there were 17 266 Dollar General stores this total was up 30 from the number of stores in 2016 Use this information to calculate the number of Dollar General stores in 2016 How many Dollar General stores were added from 2016 to 2020 3984 stores 7400 stores 5180 stores 30 stores 5179 stores al of 110 minutes of rain Ch

Statistics
StatisticsStatistics students believe that the mean score on a first statistics test is 65 The instructor thinks that the mean score is higher She samples 10 statistics students and obtains the scores Grades 64 3 62 7 83 2 88 61 9 96 64 3 74 4 69 65 Test grades are believed to be normally distributed Use a significance level of a 5 critical value to to 05 1 8331 A State the alternative hypothesis HA O 65 O 65 O 65

Statistics
StatisticsHypothesis testing concepts For a test of Ho p 0 60 the test statistic is determined to be z 2 11 a If the alternative hypothesis is Ha p 0 60 The P value is four decimal places b If the alternative hypothesis is Ha p 0 60 The P value is four decimal places round to round to

Statistics
StatisticsA scientist claims that in a population of fish at least 54 are female A test is conducted to test the claim Identify the null hypothesis Ho O 0 0 54 Identify the alternative hypothesis 20 0 54 Par HA

Statistics
StatisticsPart 1 o A sociologist claims the probability that a person picked at random in Times Square in New York City is visiting the area is no less than 0 67 Maji wants to test the claim Identify the null hypothesis H 0 67 Identify the alternative hypothesis H 0 0 67

Statistics
StatisticsHo p 0 84 H p 0 84 Your sample consists of 51 subjects with 45 successes Calculate the test statistic rounded to 2 decima places Z
Statistics
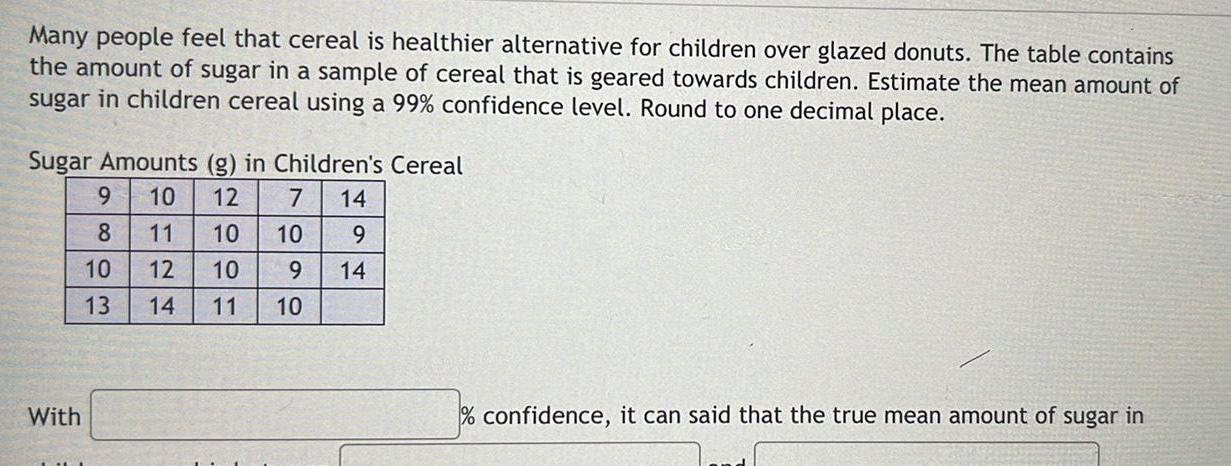
StatisticsMany people feel that cereal is healthier alternative for children over glazed donuts The table contains the amount of sugar in a sample of cereal that is geared towards children Estimate the mean amount of sugar in children cereal using a 99 confidence level Round to one decimal place Sugar Amounts g in Children s Cereal 10 12 7 14 9 14 With 9 803 10 H2H 11 10 10 12 00 10 9 13 14 11 10 confidence it can said that the true mean amount of sugar in

Statistics
StatisticsContinuous is the type of quantitative data that is the result of measuring O True False


Statistics
StatisticsA random sample of house sizes in major city has a sample mean of 1204 9 square feet and a sample standard deviation of 124 6 square feet Use the Empirical rule to determine the approximate percentage of house sizes that lie between 955 7 and 1454 1 square feet Round your answer to the nearest whole number percent

Statistics
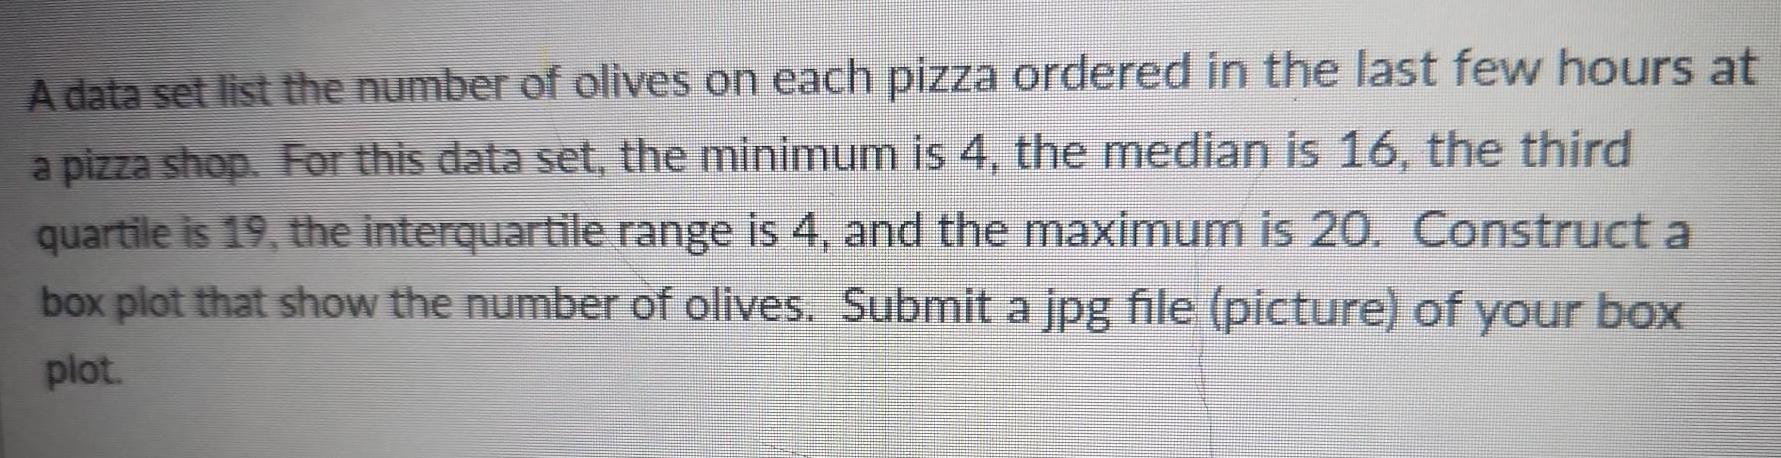
StatisticsA data set list the number of olives on each pizza ordered in the last few hours at a pizza shop For this data set the minimum is 4 the median is 16 the third quartile is 19 the interquartile range is 4 and the maximum is 20 Construct a box plot that show the number of olives Submit a jpg file picture of your box plot

Statistics
StatisticsSuppose you compute a 99 confidence interval What will happen to the confidence interval if you change the confidence level to 95 The confidence interval will become Select an answer if the confidence level is changed from 99 to 95 Select an answer Next Question narrower wider

Statistics
StatisticsWhen considering different sampling methods cluster sampling includes the steps O Identify individuals of the poulation that are easily accessible obtain data from these individuals O list the members of the population use simple random sampling to select a starting point in the population let k number of individuals in the population number of individuals needed in the sample choose every kth individual in the list starting with the one that was randomly selected O divide the population into groups use simple random sampling to identify a proportionate number of individuals form each group use simple random sampling to select a set of groups every individual in the chosen groups is included in the sample

Statistics
StatisticsTimothy wants to estimate the mean number of siblings for each student in his school He records the number of siblings for each 75 randomly selected students in the school What is the statistic O the mean number of siblings for the randomly selected students O the specific number of siblings for each randomly selected student O the 75 randomly selected students the mean number of siblings for all students in the school all the students in the school

Statistics
StatisticsAccording to a study conducted by a statistical organization the proportion of people who are satisfied with the way things are going in their lives is 0 74 Suppose that a random sample of 100 people is obtained Complete parts a through e below a Suppose the random sample of 100 people is asked Are you satisfied with the way things are going in your life Is the response to this question qualitative or quantitative Explain CIXD OA The response is quantitative because the number of people satisfied can be counted OB The response is qualitative because the number of people satisfied can be counted OC The response is qualitative because the responses can be classified based on the characteristic of being satisfied or not OD The response is quantitative because the responses can be classified based on the characteristic of being satisfied or not b Explain why the sample proportion p is a random variable What is the source of the variability OA The sample proportion p is a random variable because the value of p varies from sample to sample The not be responding to the question truthfully vari is due to the fact that people OB The sample proportion p is a random variable because the value of p varies from sample to sample The variability is due to the fact that different people feel differently regarding their satisfaction OC The sample proportion p is a random variable because the value of p repr sents a random person included in the sample The variability is due to the fact that people may not be responding to the question truthfully OD The sample proportion p is a random variable because the value of p represents a random person included in the sample The variability is due to the fact that different people feel differently regarding their satisfaction c Describe the sampling distribution of p the proportion of people who are satisfied with the way things are going in their life Be sure to verify the model requirements Since the sample size is than 5 of the population size and np 1 P 21 10 the distribution of p is and G P with th Hp Round to three decimal places as needed d In the sample obtained in part a what is the probability that the proportion who are satisfied with the way things are going in their life exceeds 0 78 The probability that the proportion who are satisfied with the way things are going in their life exceeds 0 78 is Round to four decimal places as needed e Using the distribution from part c would it be unusual for a survey of 100 people to reveal that 68 or fewer people in the sample are satisfied with their lives The probability that 68 or fewer people in the sample are satisfied is which probability less than Round to four decimal places as needed unusual because this

Statistics
StatisticsOn each blank below write in the probability that corresponds to the problem number in the tree diagram 1pt each 12 0 68 13 0 32 15 044 16 0 18 14 0 49 17 0 82 18 Use the tree diagram to calculate the probability that the Eagles win the game when going for it on 4th down Total probability to win the game when they Go for it If the Eagles have a 0 68 probability of successfully gaining 1 or more yards is going for it a good strategy 3 pts USE PROBABILITY NOTH TION 19 What does it mean to have a value of 0 367 win probability in this context 3 pts 20 If there is a 0 68 probability of being successful on 4th down and 1 yard to go should teams always go for

Statistics
ProbabilityMatch each term with the correct definition given on the right 1 pt ea 1 Probability 2 Mutually Exclusive 3 Conditional Probability 4 Independent 5 Complement Rule 6 In 2014 15 Stephen Curry led the Golden State Warriors to their first NBA championship in forty years Curry was named the MVP of the league that year making over 44 of his 3 point attempts Here is a two way table summarizing the association between distance and outcome this Curry s shots during that year Suppose we select one of his shots at random Outcome of shot Made Missed Total At rim 218 99 317 a The event that a certain event does not happen b A number between 0 and 1 that describes the relative frequency of an event in a very large number of repetitions c Describes the probability that an event occurs given that another event is known to have occurred d If knowing the outcome of one even doesn t change the probability of another event e When two events cannot occur together 3 to 10 81 103 184 Distance from basket feet 10 to 16 55 68 123 16 to 3 point 115 164 279 3 point 386 493 879 7 What is the probability that Curry scored 2 pts USE PROBABILITY NOTATION Total 855 927 1782 8 What is the probability that Curry attempted a 3 point shot and made it 2 pts USE PROBABILITY NOTATIO 9 What is the probability that Curry attempted a shot from 10 to 16 feet or that he scored 2 pts

Statistics
Probability10 What is the probability that Curry attempted a shot at the rim given that he made the shot 2 pts USE PROBABITY NOTATION 11 If a shot taken was from 2 point range what was the probability that Curry made it 2 pts USE PROBABILITY NATATION denan And Go for it 12 The Philadelphia Eagles won Super Bowl LII 41 33 beating the New England Patriots Although the Eagles le for much of the game New England took a 1 point lead 33 32 in the fourth quarter During the next Eagles drive head coach Doug Pederson was faced with a difficult decision His team had the ball on their own 45 yard line with 5 39 left on the clock but it was 4th down and 1 yard to go NFL teams in this context have a wir probability of 0 367 If the Eagles chose to go for it and succeeded they would keep possession of the ball If the Eagles failed they would give the Patriots the ball in a favorable field position Coach Pederson made the decision to go for it Historically NFL teams succeed in converting 68 of all 4th and 1 attempts If Pederson and the Eagles chose to go for it and succeeded their probability to go on and win the game would be about 0 51 However if Pederson chose to go for it on 4th down and failed the Eagles would only have about a 0 18 probability to win the game SUCCESS Gain 1 Yard FAIL smer 14 15 16 yunluda207 F Win Game Lose Game Win Game latake

Statistics
StatisticsRate 2 1 3 4 6 5 below a Calculate the coefficient of correlation r 2 sses the unemployment rate decreases Please note that this data is graphed b Using the coefficient of correlation describe the strength and direction of this relationship 2 c Using the least squares regression the following was calculated a 0 3167 b 634 35 Plot this line of best fit on your scatter plot 2 d Based on this model what would you predict the unemployment rate to be in 1998 1 Year 1990 1991 1992 1993 1994 1995 1996 1997 15948 Unemployment Rate 5 3 3 4 2 9 2 7 2 7 3 2 5 2 1 24 6 x 3960100 3964081 3968064 3972049 3976036 3980025 3984016 3988009 31792380 y xy 28 09 10547 11 56 6769 4 8 41 5776 8 7 29 5381 1 7 29 5383 8 9 5985 6 25 4990 4 41 4193 7 82 3 49026 8 Unemployment Rate 0 1990 1991 1992 1993 1994 1995 1996 1997 1998

Statistics
StatisticsA group on campus will make and sell bracelets to benefit a charity The profit from selling the bracelets will go to the charity The group members are trying to decide how much to charge x for each bracelet so they took a survey to find out how many bracelets f x they would sell when the price per bracelet was x dollars Here is what their data shows X f x 500 375 350 225 150 2 4 5 5 7 5 9 A Write a linear equation for f x according to the values in the table y 2 pts B Fill in the blanks to explain the meaning of the slope in the context of the bracelet sales When the increases by x one dollar the number of bracelets by 3 pts C Explain the meaning of the y intercept in the context of the

Statistics
Probability4 In the bottom of the ninth inning in a tie game the leadoff batter for the home team hits a double According to researcher Tom Tango teams in this situation have a win probability of 0 807 Because the home team only needs 1 run to win the game some managers will choose to have the next player attempt a sacrifice bunt which allows the runner on second base to reach third base while the hitter is thrown out If the sacrifice bunt is successful then the home team has a runner on third base with 1 out and a win probability of 0 830 However if the sacrifice bunt is unsuccessful and the runner is thrown out at third the home team has a runner on first with 1 out and a win probability of 0 637 Assume that the hitter is able to bunt the ball and doesn t strike out walk etc a Interpret the value of 0 807 in the context of this problem b Create a tree diagram for a sacrifice bunt attempt using the possible outcomes of the attempt as the first set of branches and the possible outcomes of the game as the second set of branches Assume that the hitter has a 0 75 probability of successfully executing the sacrifice bunt

Statistics
ProbabilityPart 2 Development issues Write your answer to the development questions in the space provided below clearly specifying your rating and including an appropriate justification Show all the details of your calculations 1 In winter in North America snow owl migrate south every four years in greater numbers The body size of snow owl follows a normal distribution with an average of 61 5 cm and a standard deviation of 4 75 cm A 5 points What is the probability that the size of a snow owl will be greater than 52 Cr B 5 points If we randomly select 10 snow oxen from this population what is the expected number of snow oxen in the sample whose size is between 46 3 cm and 52 cm