Statistics Questions
The best high school and college tutors are just a click away, 24×7! Pick a subject, ask a question, and get a detailed, handwritten solution personalized for you in minutes. We cover Math, Physics, Chemistry & Biology.

Statistics
Probability4 The one child policy is an official program launched in the late 1970s by the Chinese central government with the aim of limiting the number of children per family to one child We consider a family composed of the husband wife and an adult child and Let X be the number of smokers in this family The possible values of X are 0 1 2 3 Suppose that the probability mass function of X is given as follows F x c 4 x 0 5 pointe Fir For x 0 1 2 3 inotion

Statistics
Probability2 Many baseball pitchers can throw 3 different types of pitches fastball curve and change up A certain pitcher throws his fastball 55 of the time curveball 30 of the time and change up the remaining times The pitcher gets the batter out 70 of the time when he throws a fastball 60 of the time when he throws a curveball and 75 of the time when he throws a change up Randomly select one batter during a game a Express the provided information using probability notation b Display the provided information using a tree diagram Then calculate the probabilities of each of the 6 possible outcomes using the multiplication rule c Calculate the probability that the batter is not out d Given that the batter was out what is the probability that the pitcher threw a fastball 3 Candice loves to go bowling and she rolls a strike in 21 of her frames Assume the outcome of Candace s rolls are independent a What is the probability that Candace does not get a strike in a frame b What is the probability that Candace does not get a strike in 4 frames c What is the probability that Candace gets at least 1 strike in 4 frames

Statistics
Probabilityi 1 In 2018 quarterback Drew Brees had the highest statistical passer rating of any quarterback in the NFL The two way table summarizes the association between the quarter of the game and outcome of his pass attempts Suppose we select one pass attempt at random Quarter First 83 32 115 Second 115 44 159 Third 77 18 Fourth 80 29 109 Outcome Complete of pass attempt Incomplete Total a What is the probability that the pass attempt was in the first quarter 95 Total 355 123 478 b What is the probability that the pass attempt was after the first quarter c What is the probability that the pass attempt was in the first quarter and complete d What is the probability that the pass attempt was in the first quarter or complete e What is the probability that the pass attempt was in the first quarter given that it was complete f What is the probability that the pass attempt was complete given that it was in the first quarter g What is the probability that the pass attempt was complete given that it was after the first quarter h Explain what it means to say that the events Attempt was in the first quarter and Attempt was complete are independent Based on your previous answers are the events Attempt was in the first quarter and Attempt was complete independent Explain your reasoning

Statistics
ProbabilityQuestion 22 Which of the following could be the value of x if x 2 A B C D WSSISIWNIH q S x 29 9 9 5 9 x 18

Statistics
ProbabilityQuestion 15 What is 0 8749 rounded to the nearest hundredth have A 0 87 B 0 875 C 0 88 D 0 884 tenths hundredths thou


Statistics
StatisticsSection 1 Arithmetic Question 7 Bob deposits 20 of 140 into a savings account what is the amount of his deposit Q 10 T R 16 S 20 T 28

Statistics
ProbabilityThe perimeter of the trapezoid below is 42 cm What is its area A 576 cm B 112 cm C 48 cm D 24 cm 2 6 cm 12 cm 8 cm

Statistics
StatisticsIn a stadium the ratio of home fans to visiting fans in a crowd is 11 1 Which of the following could be the total number of fans in the stadium I 12 324 J 42 326

Statistics
StatisticsA football team had 20 000 to spend on supplies The team spent 15 000 on new balls New sport shoes cost 140 each Which of the following inequalities represent th number of new shoes the team can purchase U 140x 15 000 20 000 V 140x 15 000 20 000 W 15 000x 140 20 000 X 15 000x 140 20 000

Statistics
ProbabilitySection 1 Arithmetic Question 12 15 of what number is equal to 90 A 8 64 B 36 C 300 D 600

Statistics
StatisticsIon 18 What is 720 756 rounded to the nearest hundredth A 720 B 720 75 C 720 76 D 721

Statistics
StatisticsQuestion 28 If 4x y 25 and x 2z 24 what is the value of x A 0 B 5 C 10 D It cannot be determined from the information given

Statistics
StatisticsIf 60 of x equal to 30 of 20 then what is the value of x 5 A 25 25 B 26 C 26 01 D 225

Statistics
ProbabilityQuestion 23 The perimeter of a rectangular yard is 84 meters What is its length if its width is twi ts length E 14 meters F 18 meters G 20 meters H 24 meters


Statistics
StatisticsThe ratio of boys and girls in a class is 3 8 If there are 55 students in the class how m more boys should be enrolled to make the ratio 1 1 Y 6 Z 18 AA 20 BB 25 0002 20 140 20 000 20 000

Statistics
Statisticstive Reasoning Algebra And Statistics Question 29 dvem The average of 6 numbers is 15 The average of 4 of those numbers is 10 What is the average of the other two numbers Q 10 R 12 S 14 T 25 000 00 0000025


Statistics
ProbabilityQuestion 32 What is the average of circumference of figure A and area of figure B 3 A 54 B 53 C 52 D 51 TO ST 16 Figure A 12 Figure B 5

Statistics
ProbabilityA swimming pool holds 3 500 cubic feet of water The swimming pool is 25 feet long and 10 feet wide How deep is the swimming pool A 2 B 4 C 6 D 14 01 3

Statistics
ProbabilityHow many tiles of 8 cm is needed to cover a floor of dimension 6 cm by 24 cm A 6 B 18 C 55 D 65

Statistics
ProbabilityQuestion 37 aujais mm 3 If the perimeter of the following figure be 23 what is the value of x A 4 B 6 C 8 D 11 3 X 5 5 X 3

Statistics
ProbabilityIf a b is divisible by 3 which of the following expression must also be divisible by 3 A 3a b B a 3b C a b D 4x axb

Statistics
StatisticsQuestion 38 Michelle and Alec can finish a job together in 100 minutes If Michelle can do the job by herself in 5 hours how many minutes does it take Alec to finish the job A 190 cm B 180 cm C 160 cm D 150 cm

Statistics
ProbabilitySection 2 Quantitative Reasoning Question 36 If 1 6 then 25 A 25 A CC 5 DD 4 EE 25 FF 30

Statistics
Statisticscrivez votre r ponse aux questions d veloppement dans l espace pr vu ci dessous en pr cisant clairement votre notation et en incluant une justification appropri e Montrez tous les d tails de vos calculs 1 En hiver en Am rique du Nord les harfangs des neiges migrent vers le sud tous les quatre ans en plus grand nombre La taille du corps des harfangs des neiges suit une distribution normale avec une moyenne de 61 5 cm et un cart type de 4 75 cm a 5 points Quelle est la probabilit que la taille d un harfang des neiges soit sup rieure 52 cm b 5 points Si nous s lectionnons au hasard 10 harfangs des neiges dans cette population quel est le nombre attendu de harfangs des neiges dans l chantillon dont la taille est comprise entre 46 3 cm et 52 cm

Statistics
StatisticsIn the probability distribution to the right the random variable X represents the number of hits a baseball player obtained in a game over the course of a season Complete parts a through 1 below O A Probability 0 4 0 34 0 2 0 1 0 44 0 1 2 3 4 5 Number of Hits Q O B Probability 0 4 0 3 0 2 0 1 ol 0 1 2 3 4 5 Number of Hits Q O C Probability Describe the shape of the distribution The distribution has one mode and is c Compute and interpret the mean of the random variable X Hx 1 6285 hits Type an integer or a decimal Do not round Which of the following interpretations of the mean is correct 0 4 0 3 0 24 0 1 0 1 2 3 4 5 Number of Hits Probability 02 0 1 1 X 0 0 1 2 0 41 0 3 Q 3 4 5 10 P x D 0 3 Type an integer or a decimal Do not round f What is the probability that in a randomly selected game the player got more than 1 hit 0 1661 0 3357 0 2878 0 1492 0 0364 0 0248 0 1 2 3 4 5 Number of Hits 57 OA The observed number of hits per game will be equal to the mean number of hits per game for most games OB In any number of games one would expect the mean number of hits per game to be the mean of the random variable OC Over the course of many games one would expect the mean number of hits per game to be the mean of the random variable D The observed number of hits per game will be less than the mean number of hits per game for most games d Compute the standard deviation of the random variable X Ox 1 175 hits Round to three decimal places as needed e What is the probability that in a randomly selected game the player got 2 hits
Statistics
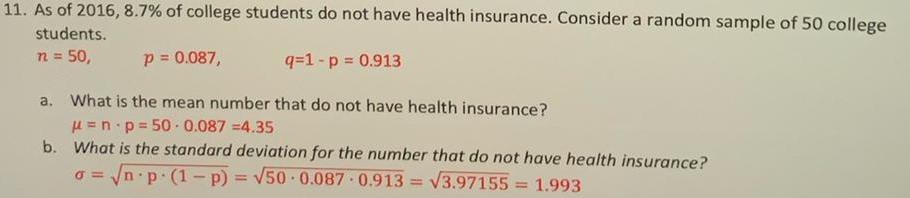
Statistics11 As of 2016 8 7 of college students do not have health insurance Consider a random sample of 50 college students n 50 p 0 087 q 1 p 0 913 a What is the mean number that do not have health insurance n p 50 0 087 4 35 b What is the standard deviation for the number that do not have health insurance 0 n p 1 p 50 0 087 0 913 3 97155 1 993

Statistics
StatisticsHow many weeks of data must be randomly sampled to estimate the mean weekly sales of a new line of athletic footwear We want 90 confidence that the sample mean is within 400 of the population mean and the population standard deviation is known to be 1 200 1 645 1200 2 400 n n 24 4 n 25 weeks

Statistics
ProbabilityA nutritionist wants to determine how much time nationally people spend eating and drinking Suppose for a random sample of 1079 people age 15 or older the mean amount of time spent eating or drinking per day is 1 22 hours with a standard deviation of 0 59 hour Complete parts a through d below a A histogram of time spent eating and drinking each day is skewed right Use this result to explain why a large sample size is needed to construct a confidence interval for the mean time spent eating and drinking each day OA Since the distribution of time spent eating and drinking each day is not normally distributed skewed right the sample must be large so that the distribution of the sample mean will be approximately normal OB The distribution of the sample mean will never be approximately normal OC Since the distribution of time spent eating and drinking each day is normally distributed the sample must be large so that the distribution of the sample mean will be approximately normal OD The distribution of the sample mean will always be approximately normal b There are more than 200 million people nationally age 15 or older Explain why this along with the fact that the data were obtained using a random sample satisfies the requirements for constructing a confidence interval OA The sample size is greater than 10 of the population B The sample size is greater than 5 of the population OC The sample size is less than 5 of the population D The sample size is less than 10 of the population c Determine and interpret a 95 confidence interval for the mean amount of time Americans age 15 or older spend eating and drinking each day Select the correct choice below and fill in the answer boxes if applicable in your choice Type integers or decimals rounded to three decimal places as needed Use ascending order OA The nutritionist is 95 confident that the mean amount of time spent eating or drinking per day is between and hours OB The nutritionist is 95 confident that the amount of time spent eating or drinking per day for any individual is hours between and OC There is a 95 probability that the mean amount of time spent eating or drinking per day is between hours OD The requirements for constructing a confidence interval are not satisfied d Could the interval be used to estimate the mean amount of time a 9 year old spends eating and drinking each day Explain and OA No the interval is about individual time spent eating or drinking per day and cannot be used to find the mean time spent eating or drinking per day for specific age OB Yes the interval is about the mean amount of time spent eating or drinking per day for people people age 15 or older and can be used to find the mean amount of time spent eating or drinking per day for 9 year olds OC No the interval is about people age 15 or older The mean amount of time spent eating or drinking per day for 9 year olds may differ OD Yes the interval is about individual time spent eating or drinking per day and can be used to find the mean amount of time a 9 year old spends eating and drinking each day E A confidence interval could not be constructed in part c

Statistics
Statisticspoint s possible In a survey conducted by a reputable marketing agency 268 of 1000 adults 19 years of age or older confessed to bringing and using their cell phone every trip to the bathroom confessions included texting and answering phone calls Complete parts a through f below Click here to view the standard normal distribution table page 1 Click here to view the standard normal distribution table page 2 a What is the sample in this study What is the population of interest Determine the sample in this study Select the correct choice below and if necessary fill in the answer box within your choice A The sample is the 268 adults 19 years of age or older Type a whole number OB The sample is all adults OC The sample is all adults with a cell phone OD The sample is all adults 19 years of age or older Determine the population of interest Select the correct choice below and if necessary fill in the answer box within your choice OA The population is all adults OB The population is all adults with a cell phone OC The population is the adults 19 years of age or older Type a whole number OD The population is all adults 19 years of age or older b What is the variable of interest in this study Is it qualitative or quantitative The variable of interest is because Submit test c Based on the results of this survey obl who bring their cell phone every trip to the p 1000 Round to three decimal places as needed in point estimate found in This variable is numerical measures of individuals are provided individuals are classified based on a characteristic or olde it is th

Statistics
ProbabilityClayton Kershaw of the Los Angeles Dodgers is one of the premier pitchers in baseball His most popular pitch is a four seam fastball The accompanying data represent the pitch speed in miles per hour for a random sample of 15 of his four seam fastball pitches Complete parts a through f Click here to view the data table Click here to view the standard normal distribution table page 1 Click here to view the standard normal distribution table page 2 Click here to view the table of critical t values Click here to view a table of critical values for the correlation coefficient d Are the requirements for constructing a confidence interval for the mean pitch speed of Clayton Kershaw s four seam fastball satisfied An interval be constructed because the data e Construct and interpret a 95 confidence interval for the mean pitch speed of Clayton Kershaw s four seam fastball Select the correct choice below and if necessary fill in the answer boxes to complete your choice approximately normal and there O A There is a 95 probability that the mean pitch speed of Kershaw s four seam fastball is between miles per hour Round to two decimal places as needed Use ascending order OB 95 of Kershaw s four seam fastballs are between and miles per hour Round to two decimal places as needed Use ascending order OC One can be 95 confident that the mean pitch speed of Kershaw s four seam fastball is between miles per hour Round to two decimal places as needed Use ascending order OD The interval cannot be found The interval for all pitchers in a league would be and f Do you believe that a 95 confidence interval for the mean pitch speed of four seam fastballs for all major league pitchers would be narrower or wider Why and than the variability between pitches for one pitcher because the variability between pitchers is most likely

Statistics
Statistics11 12 13 14 7 CALLE 8 15 16 10 17 18 19 20 9 21 24 22 AVEN 23 25 6 4 5 2 3 You can use your graphical calculator Excel or other software to analyze the data Upload the completed document in the third assignment of the project question 1 Weekday Mean Standard Deviation Weekend day Mean 26 Standard Deviation 27 28 2 3 1 2 3 1 4 4 5 8 9 100 6 7 Breakfast calories Lunch calories 389 389 389 389 389 368 368 368 565 368 398 2 59 5293 Breakfast calories Lunch calories 539 47 684 565 458 75 281 6645 320 699 780 699 699 1668 1189 870 740 710 837 4 360 3641 470 1700 350 543 765 75 627 8951 Dinner calories 830 470 660 470 510 648 707 351 391 444 548 1 154 6447 Dinner Calories 700 257 800 700 614 25 242 7871 Snack calories 276 Snack Calories 175 680 175 175 175 769 175 87 699 338 6 265 1483 330 0 0 186 258 101 8234 Total Calories for the day 1815 1732 2509 1733 1773 2859 3033 1764 1783 2221 2238 8 577 2134 Total Calories for the day 2039 2004 1834 1994 1967 75 91 2300 Only Wee 11 Me Sta W M Sta

Statistics
StatisticsClayton Kershaw of the Los Angeles Dodgers is one of the premier pitchers in baseball His most popular pit a four seam fastball The accompanying data represent the pitch speed in miles per hour for a random sample of 15 of his four seam fastball pitches Complete parts a through f Click here to view the data table Click here to view the standard normal distribution table page 1 Click here to view the standard normal distribution table page 2 Click here to view the table of critical t values Click here to view a table of critical values for the correlation coefficient Since the absolute value of the correlation coefficient between the expected z scores and the ordered observed data is reasonable to conclude that the data come from a 0 994 the critical value 0 514 it exceeds population that is normally distributed Round to three decimal places as needed c Draw a boxplot to verify the data set has no outliers Which boxplot below represents the data OA OB 90 95 Speed mph 100 An interval Q 90 95 Speed mph 100 E be constructed because the data O C OD The interval cannot be found 90 OB 95 of Kershaw s four seam fastballs are between 95 Speed mph 100 The interval for all pitchers in a league would be Q O D d Are the requirements for constructing a confidence interval for the mean pitch speed of Clayton Kershaw s four seam fastball satisfied 90 approximately normal and there e Construct and interpret a 95 confidence interval for the mean pitch speed of Clayton Kershaw s four seam fastball Select the correct choice below and if necessary fill in the answer boxes to complete your choice OA There is a 95 probability that the mean pitch speed of Kershaw s four eam fastball is between miles per hour Round to two decimal places as needed Use ascending order than the variability between pitches for one pitcher 95 100 Speed mph miles per hour and Round to two decimal places as needed Use ascending order OC One can be 95 confident that the mean pitch speed of Kershaw s four seam fastball is between miles per hour Round to two decimal places as needed Use ascending order Q and f Do you believe that a 95 confidence interval for the mean pitch speed of four seam fastballs for all major league pitchers would be narrower or wider Why and because the variability between pitchers is most likely

Statistics
StatisticsA certain drug can be used to reduce the acid produced by the body and heal damage to the esophagus due to acid reflux The manufacturer of the drug claims that more than 92 of patients taking the drug are healed within 8 weeks In clinical trials 215 of 232 patients suffering from acid reflux disease were healed after 8 weeks Test the manufacturer s claim at the x 0 1 level of significance Because npo 1 Po Round to one decimal place as needed What are the null and alternative hypotheses Ho versus H Type integers or decimals Do not round Find the test statistic Zo Zo 10 the sample size is Find the P value 5 of the population size and the sample satisfied the requirements for testing the hypothesis Round to two decimal places as needed P value Round to three decimal places as needed Choose the correct conclusion below O A Reject the null hypothesis There is sufficient evidence to conclude that more than 92 of patients taking the drug are healed within 8 weeks O B Do not reject the null hypothesis There is sufficient evidence to conclude more than 92 of patients taking the drug are healed within 8 weeks OC Reject the null hypothesis There is insufficient evidence to conclude that more than 92 of patients taking the drug are healed within 8 weeks O D Do not reject the null hypothesis There is insufficient evidence to conclude that more than 92 of patients taking the drug are healed within 8 weeks

Statistics
StatisticsA credit score is used by credit agencies such as mortgage companies and banks to assess the creditworthiness of Individuals Values range from 300 to 850 with a credit score over 700 considered to be a quality credit risk According to a survey the mean credit score is 707 2 A credit analyst wondered whether high income individuals incomes in excess of 100 000 per year had higher credit scores He obtained a random sample of 33 high income individuals and found the sample mean credit score to be 725 3 with a standard deviation of 80 9 Conduct the appropriate test to determine if high income individuals have higher credit scores at the a 0 05 level of significance State the null and alternative hypotheses H i H H P Type integers or decimals Do not round Identify the t statistic to Round to two decimal places as needed Identify the P value P value Round to three decimal places as needed Make a conclusion regarding the hypothesis the null hypothesis There of high income individuals is sufficient evidence to claim that the mean credit score

Statistics
StatisticsTotal Sugar Total Sodium 173 5 1542 105 9 5 145 100 3 625 106 5 145 114 6 355 161 4 996 117 3 407 107 2 066 67 3 366 89 2 255 7000 6000 5000 4000 3000 2000 1000 0 0 2 1542 5 145 Find the correlation coefficient r for the previous problem Round to two decimal places Is this a weak moderate or strong correlation Scatter Plot 3 625 If it is a weak correlation speculate as to why their ion and sodium consumption has a 5 145 173 5 105 9 100 106 114 161 117 4 8 6 355 6 4 996 Total Sugar Total Sodium 3 407

Statistics
StatisticsA book claims that more hockey players are born in January through March than in October through December The following data show the number of players selected in a draft of new players for a hockey league according to their birth month Is there evidence to suggest that hockey players birthdates are not uniformly distributed throughout the year Use the level of significance 0 01 Click the icon to view the table Determine the null and alternative hypotheses Choose the correct answer below O A Ho The distribution of hockey players birth months is uniformly distributed H The distribution of hockey players birth months is not uniformly distributed OB Ho The distribution of hockey players birth months is uniformly distributed H More hockey players are born in the first half of the year than the second half OC Ho The distribution of hockey players birth months is uniformly distributed H More hockey players are born in January March than October December O D Ho The distribution of hockey players birth months is not uniformly distributed H The distribution of hockey players birth months is uniformly distributed Compute the expected counts for each birth month The total number of hockey players is 182 Round to two decimal places as needed Observed Count Expected Count Birth Month January March April June July September October December What is the test statistic 63 52 36 31 x Round to two decimal places as needed What is the P value of the test P value Round to three decimal places as needed Based on the results is the null hypothesis rejected Use the level of significance 0 01 OA No because the calculated P value is greater than the given a level of significance OB Yes because the calculated P value is less than the given a level of significance Oc Yes because the calculated P value is greater than the given a level of significance On No because the calculated P value is less than the given a level of significance

Statistics
StatisticsClayton Kershaw of the Los Angeles Dodgers is one of the premier pitchers in baseball His most popular pitch is K a four seam fastball The accompanying data represent the pitch speed in miles per hour for a random sample of 15 of his four seam fastball pitches Complete parts a through f Click here to view the data table Click here to view the standard normal distribution table page 1 Click here to view the standard normal distribution table page 2 Click here to view the table of critical t values Click here to view a table of critical values for the correlation coefficient a Is pitch speed a quantitative or qualitative variable Why is it important to know this when determining the type of confidence interval you may construct The variable pitch speed is a 10 qualitative data with b Draw a normal probability plot Then determine whether pitch speed could come from a population that is normally distributed by using the correlation coefficient of the normal probability plot 3 Which normal probability plot below represents the data OA O B 90 are constructed on quantitative data while confidence intervals for a A 100 Speed mph Q Q 95 100 Speed mph 90 variable This is important to know because confidence intervals for a Y are constructed on Speed mph Which boxplot below represents the data A B 90 that is normally distributed Round to three decimal places as needed c Draw a boxplot to verify the data set has no outliers 100 95 Speed mph Q 100 O C 3 O C 95 90 105 Speed mph Using the correlation coefficient of the normal probability plot is it reasonable to conclude that the population is normally distributed Since the absolute value of the correlation coefficient between the expected z scores and the ordered observed data reasonable to conclude that the data come from a population the critical value it 95 Q Q D 100 0 2 3 90 ma O D 90 100 Speed mph Q 95 5

Statistics
StatisticsThe acceptable level for insect filth in a certain food item is 3 insect fragments larvae eggs body parts and so on per 10 grams A simple random sample of 40 ten gram portions of the food item is obtained and results in a sample mean of x 3 2 insect fragments per ten gram portion Complete parts a through c below a Why is the sampling distribution of x approximately normal OA The sampling distribution of x is approximately normal because the population is normally distributed OB The sampling distribution of x is approximately normal because the population is normally distributed and the sample size is large enough OC The sampling distribution of x is assumed to be approximately normal O D The sampling distribution of x is approximately normal because the sample size is large enough b What is the mean and standard deviation of the sampling distribution of x assuming 3 and 3 HX Round to three decimal places as needed ox Round to three decimal places as needed c What is the probability a simple random sample of 40 ten gram portions of the food item results in a mean of at least 3 2 insect fragments P x2 3 2 Round to four decimal places as needed Is this result unusual OA This result is unusual because its probability is small OB This result is not unusual because its probability is large OC This result is unusual because its probability is large OD This result is not unusual because its probability is small What might we conclude OA Since this result is not unusual it is reasonable to conclude that the population mean is higher than 3 OB Since this result is not unusual it is not reasonable to conclude that the population mean is higher than 3 OC Since this result is unusual it is not reasonable to conclude that the population mean is higher than 3 OD Since this result is unusual it is reasonable to conclude that the population mean is higher than 3

Statistics
StatisticsAccording to flightstats com American Airlines flights from Dallas to Chicago are on time 80 of the time Suppose 25 flights are randomly selected and the number of on time flights is recorded a Explain why this is a binomial experiment b Determine the values of n and p c Find and interpret the probability that exactly 15 flights are on time d Find and interpret the probability that fewer than 15 flights are on time e Find and interpret the probability that at least 15 flights are on time f Find and interpret the probability that between 13 and 15 flights inclusive are on time SITE a Identify the statements that explain why this is a binomial experiment Select all that apply A The probability of success is different for each trial of the experiment B The experiment is performed until a desired number of successes are reached C The experiment is performed a fixed number of times D Each trial depends on the previous trial E There are three mutually exclusive possible outcomes arriving on time arriving early and arriving late F The probability of success is the same for each trial of the experiment G The trials are independent H There are two mutually exclusive outcomes success or failure b Using the binomial distribution determine the values of n and p Type an integer or a decimal Do not round Type an integer or a decimal Do not round n p c Using the binomial distribution the probability that exactly 15 flights are on time is Round to four decimal places as needed Interpret the probability In 100 trials of this experiment it is expected that about will result in exactly 15 flights being on time Round to the nearest whole number as needed d Using the binomial distribution the probability that fewer than 15 flights are on time is Round to four decimal places as needed Interpret the probability In 100 trials of this experiment it is expected that about will result in fewer than 15 flights being on time Round to the nearest whole number as needed e Using the binomial distribution the probability that at least 15 flights are on time is Round to four decimal places as needed Interpret the probability In 100 trials of this experiment it is expected that about will result in at least 15 flights being on time Round to the nearest whole number as needed f Using the binomial distribution the probability that between 13 and 15 flights inclusive are on time is Round to four decimal places as needed

Statistics
StatisticsIn a survey conducted by a reputable marketing agency 268 of 1000 adults 19 years of age bringing and using their cell phone every trip to the bathroom confessions included texting and answering phone calls Complete parts a through f below Click here to view the standard normal distribution table page 1 Click here to view the standard normal distribution table page 2 ACCES d Explain why the point estimate found in part c is a statistic Explain why it is a random variable What is the source of variability in the random variable Why is the point estimate found in part c a statistic OA Its value may change depending on the individuals in the survey OB It is information obtained from a survey OC It is being used to make inferences OD The sample size is large OE Its value is based on a sample Why is the point estimate found in part c a random variable OA The sample size is large OB Its value may change depending on the individuals in the survey OC It is information obtained from a survey OD Its value is based on a sample OE It is being used to make inferences What is the source of variability in the random variable OA The sample size OB Random errors OC The question asked in the survey OD The individuals selected to be in the study e Construct and interpret a 95 confidence interval for the population proportion of adults 19 years of age or older who bring their cell phone every trip to the bathroom Select the correct choice below and fill in any answer boxes within your choice Type integers or decimals rounded to three decimal places as needed Use ascending order OA There is a probability the proportion of adults 19 years of age or older who bring their cell phone every and trip to the bathroom is between OB We are confident the proportion of adults 19 years of age or older who bring their cell phone every trip and to the bathroom is between f What ensures that the results of this study are representative of all adults 19 years of age or older OA The large sample size from adults 19 years of age or older

Statistics
ProbabilityIn the probability distribution to the right the random variable X represents the number of hits a baseball player obtained in a game over the course of a season Complete parts a through f below a Verify that this is a discrete probability distribution This is a discrete probability distribution because and the of the probabilities is Type whole numbers Use ascending order b Draw a graph of the probability distribution Describe the shape of the distribution Graph the probability distribution Choose the correct graph below OA 0 4 0 3 0 2 0 1 0 9 012345 Number of Hits Q Q The distribution O B 0 4 0 3 0 2 0 1 04 012345 Number of Hits Describe the shape of the distribution Q O C 0 4 0 3 0 2 0 1 and is c Compute and interpret the mean of the random variable X Hx hits Type an integer or a decimal Do not round Which of the following interpretations of the mean is correct off 012345 Number of Hits Q Q G OD 0 4 0 3 X 0 between and inclusive 0 24 0 1 0 0x Round to three decimal places as needed e What is the probability that in a randomly selected game the player got 2 hits P x D 0 1661 0 3357 0 2878 1 2 3 0 1492 4 0 0364 5 0 0248 012345 Number of Hits Q Q OA The observed number of hits per game will be equal to the mean number of hits per game for most games B In any number of games one would expect the mean number of hits per game to be the mean of the random variable OC Over the course of many games one would expect the mean number of hits per game to be the mean of the random variable OD The observed number of hits per game will be less than the mean number of hits per game for most games d Compute the standard deviation of the random variable X hits

Statistics
ProbabilityThe shape of the distribution of the time required to get an oil change at a 10 minute oil change facility is unknown However records indicate that the mean time is 10 6 minutes and the standard deviation is 3 1 minutes a To compute probabilities regarding the sample mean using the normal model what size sample would be required The sample size needs to be greater than 30 The normal model cannot be used if the shape of the distribution is unknown The sample size needs to be less than 30 Any sample size could be used b The probability that a random sample of n 42 oil changes results in a sample mean time less than 10 minutes is approximately Round to 4 decimal places c Suppose the manager agrees to pay each employee a 50 bonus if they meet a certain goal On a typical Saturday the oil change facility will perform 45 oil changes between 10 A M and 12 P M Treating this as a andom sample at what mean oil change time would there be a 9 chance of being at or below This will e the goal established by the manager here would be a 9 chance of being at or below minutes Round to the nearest 1

Statistics
StatisticsSuppose that the efficacy of a certain drug is 0 64 Consider the sampling distribution sample size n 102 for the proportion of patients cured by this drug What is the mean of this distribution What is the standard deviation of this distribution Round answer to four decimal places

Statistics
ProbabilityLet X denote the life length in hours of a battery Suppose X is known to be normally distributed with standard deviation o 2 25 hours A random sample of 12 batteries has an average life of x 51 3 hours We are interested in determining whether there is evidence to support the claim that mean battery life exceeds 50 hours Using a level of significance of 0 05 answer the following questions Part a 4 points State the null and alternative hypothesis for the appropriate hypothesis test Mo u S50hrs M 750 hrs z el Part b 5 points Identify the test statistic and p value teast statistic JJ If P 2 0 05 Pr value reject Part c 3 points State the conclusion of the test in the problem context is less equal M vahe we D is fo 2 score 51 3 50 2 25 112 Li reject greater we Ho than 2 0014 than If fail on 40 1

Statistics
Statistics38 Adding computerized medical images to a database promises to provide great resources for physicians However there are other methods of obtaining such information so the issue of efficiency of access needs to be investigated The article The Comparative Effectiveness of Conventional and Digital Image Libraries J of Audiovisual Media in Medicine 2001 8 15 reported on an experiment in which 13 computer proficient medical professionals were timed both while retrieving an image from a library of slides and while retrieving the same image from a computer database with a Web front end Subject Slide Digital Difference 1 2 3 30 35 40 25 16 15 5 19 25 Subject Slide Digital 8 9 10 62 40 51 16 15 13 Difference 46 25 4 25 15 10 11 25 11 38 14 5 828 2923 20 10 10 12 42 19 6 7 30 35 20 7 10 28 13 33 19 14 a Construct a comparative boxplot of times for the two types of retrieval and comment on any interesting features b Estimate the difference between true average times for the two types of retrieval in a way that conveys infor mation about precision and reliability Be sure to check the plausibility of any assumptions needed in your analysis Does it appear plausible that the true average times for the two types of retrieval are identical Why or why not 40 Refer to Exercise 38 What is B for the test when true average DNA content is identical for three of the diets and falls below this common value by 1 standard devia tion fad for

Statistics
Probability20 General data analysis skills a Explain the difference between quantitative and qualitative data b Explain the difference between independent variable and dependent variable c Where do each of these go on a graph d List the 5 essential parts of a graph e Be able to graph data and read a graph
Statistics
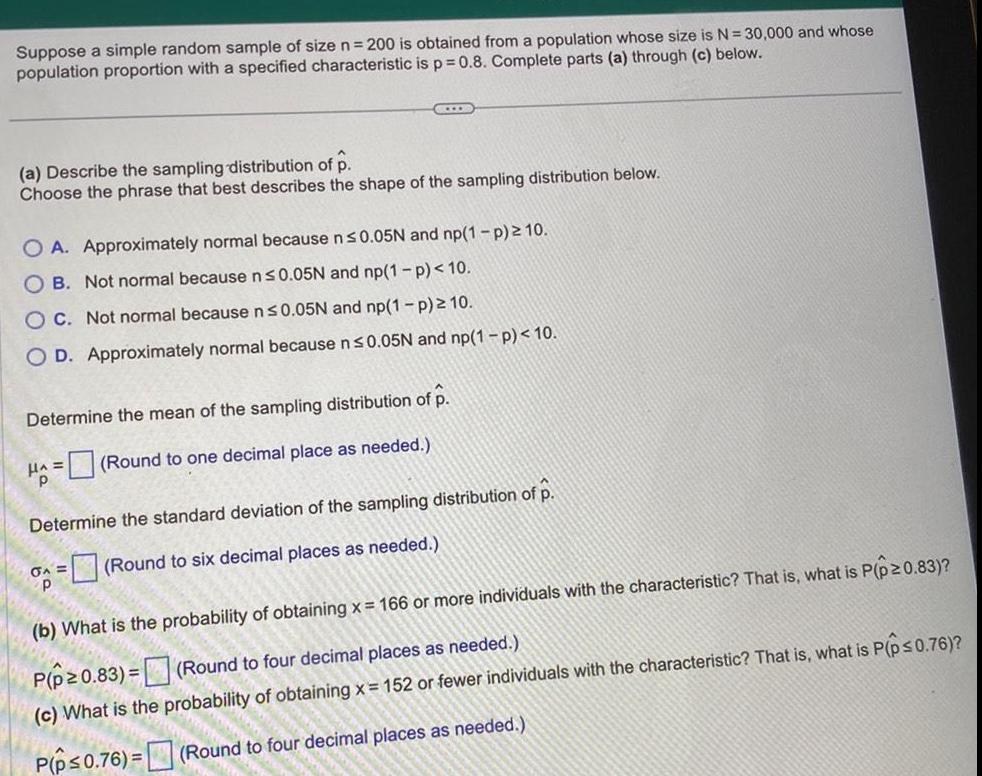
StatisticsSuppose a simple random sample of size n 200 is obtained from a population whose size is N 30 000 and whose population proportion with a specified characteristic is p 0 8 Complete parts a through c below L a Describe the sampling distribution of p Choose the phrase that best describes the shape of the sampling distribution below O A Approximately normal because n 0 05N and np 1 p 10 OB Not normal because n 0 05N and np 1 p 10 OC Not normal because n 0 05N and np 1 p 10 O D Approximately normal because n 0 05N and np 1 p 10 Determine the mean of the sampling distribution of p HA Round to one decimal place as needed Determine the standard deviation of the sampling distribution of p A Round to six decimal places as needed b What is the probability of obtaining x 166 or more individuals with the characteristic That is what is P p 0 83 P p 0 83 Round to four decimal places as needed c What is the probability of obtaining x 152 or fewer individuals with the characteristic That is what is P p 0 76 P p 0 76 Round to four decimal places as needed