Statistics Questions
The best high school and college tutors are just a click away, 24×7! Pick a subject, ask a question, and get a detailed, handwritten solution personalized for you in minutes. We cover Math, Physics, Chemistry & Biology.

Statistics
ProbabilityAmerican Airlines flights from Fort Lauderdale to New York are on time 70 of the time Suppose 10 flights are randomly selected and the number on time flights is recorded Determine the following probabilities Round solutions to four decimal places if necessary The probability that exactly 8 flights are on time is P z 8 The probability that at most 7 flights are on time is P z 7 The probability that at least 4 flights are on time is DO

Statistics
StatisticsFind the value of each of the following expressions 10 11 11 10 11 6 11 6 11C6 10C6 11C10 11P6 11P10

Statistics
StatisticsRead the following plan for a study Draw any conclusions about how the statistics produced could be misleading Tony is a high school math teacher He wants to do a study on what his previous math students have been doing since they graduated high school He made a survey with questions like What year did you graduate high school and What was your major in college He used the student home addresses on file with the guidance office to send the surveys He included a return envelope with the school address so that the surveys would remain anonymous UPLOAD

Statistics
ProbabilitySuppose that probability that a randomly selected IRSC students is at least 19 years old is 0 55 Round solutions to three decimal places if necessary What is the probability that a randomly selected IRSC student is less than 19 years old P the student is less than 19 years old Suppose two IRSC students are selected at random and calculate the following probabilities P Both students are at least 19 years old P Both students are less than 19 years old P the first student is at least 19 years old and the second student is less than 19 years old

Statistics
Probability4 4 A A As shown above a classic deck of cards is made up of 52 cards Suppose one card is selected at random and calculate the following probabilities Round solutions to three decimal places if necessary The probability that a 6 of Diamonds is selected is The probability that a Spade or Diamond is selected is The probability that a number smaller than 4 counting the ace as a 1 is selected is

Statistics
ProbabilityA boy owns 5 pairs of pants 5 shirts 5 ties and 5 jackets How many different outfits can he wear to school if he must wear one of each item He can wear different outfits

Statistics
Statisticsof time adults spend watching television is closely monitored by firms to determine advertising pricing for commercials Complete parts a through ret this probability Select the correct choice below and fill in the answer box w 3 d to the nearest integer as needed If 1000 different random samples of size n 55 individuals from a population mean is assumed to be 2 35 hours is obtained we would expect a sample m or more in about of the samples If 1000 different random samples of size n 55 individuals from a population mean is assumed to be 2 35 hours is obtained we would expect a sample me exactly 2 01 in about of the samples If 1000 different random samples of size n 55 individuals from a population w mean is assumed to be 2 35 hours is obtained we would expect a sample me or less in about of the samples

Statistics
Statisticshe amount of time adults spend watching television is closely monitored by firms bec elps to determine advertising pricing for commercials Complete parts a through d One consequence of the popularity of the Internet is that it is thought to reduce tele tching Suppose that a random sample of 55 individuals who consider themselves to ernet users results in a mean time of 2 01 hours watching television on a weekday likelihood of obtaining a sample mean of 2 01 hours or less from a population whos sumed to be 2 35 hours e likelihood is Round to four decimal places as needed

Statistics
Statisticsmount of time adults spend watching television is closely monitored by firms becau to determine advertising pricing for commercials Complete parts a through d www you think the variable weekly time spent watching television would be lly distributed If not what shape would you expect the variable to have The variable weekly time spent watching television is likely skewed right not nor distributed The variable weekly time spent watching television is likely uniform not normally distributed The variable weekly time spent watching television is likely skewed left not norm distributed The variable weekly time spent watching television is likely normally distributed The variable weekly time spent watching television is likely symmetric but not no distributed


Statistics
Statisticse graph in the figure represents a normal distribution with mean 10 and standard deviation o 2 The other graph represents a mal distribution with mean 14 and standard deviation o 2 ermine which graph is which and explain how you know d 10 14 14 ose the correct answer below Graph A has a mean of 10 and graph B has a mean of 14 because a larger shifts the graph to the right Graph A has a mean of 14 and graph B has a mean of 10 because a larger shifts the graph to the left Graph A has a mean of 14 and graph B has a mean of 10 because a larger shifts the graph to the right Graph A has a mean of 10 and graph B has a mean of 14 because a larger shifts the graph to the left

Statistics
StatisticsSelect the terms that best complete the statement A nationwide chain of cooking schools gives all students a test at the end of training The mean score is 89 7 with a and the standard deviation of 20 3 If 60 students are sampled the mean of the sampling distribution is standard deviation of the sampling distribution is O

Statistics
StatisticsThe data shown below is collected from a sample 74 75 78 70 71 71 74 75 72 73 69 77 68 69 75 73 72 To determine how much the sample mean differs from the population mean of 70 what is the t value O 1 34 O 1 38 O 3 92 6 61

Statistics
StatisticsSuppose we toss a fair coin three times and define the random variable X to be our winnings on a single play of a game where a we win x if the first heads is on the xth toss for x 1 2 3 b and we lose 1 if we get no heads in all three tosses Draw a probability distribution table and compute the standard deviation of winnings

Statistics
StatisticsUsing the accompanying Rin s Gym data find the sample covariances and correlations among height weight and calculated BMI Click the icon to view the Rin s Gym data Find the sample covariances among height weight and calculated BMI Complete the following table Round to two decimal places as needed Sample Covariance Height and Weight BMI Calculation and Height BMI Calculation and Weight 2 3 4 5 6 7 8 9 10 11 12 13 14 15 16 17 18 19 20 21 92 29 29 28 29 23 12 35 73 21 16 22 5 24 13 18 54 21 38 30 42 23 4 25 09 19 84 21 79 22 8 24 22 18 3 116 210 213 185 235 112 148 145 108 149 206 145 165 105 135 150 164 110 61 71 73 75 68 61 68 65 64 70 69 66 68 61 66 68 69 65

Statistics
StatisticsThe following are the lengths of stay in days for a random sample of 15 patients discharged from a particular hospital 13 9 5 11 6 3 12 9 9 9 5 5 5 12 12 Send data to calculator Draw the frequency polygon for these data using an initial class boundary of 2 5 an ending class boundary of 14 5 and 4 classes of equal width Note that you can add or remove classes from the figure Label each class with its midpoint Frequency 12 1 0

Statistics
StatisticsQuesti n 2 675 2 Suppose three random samples are drawn having sample sizes of 20 22 and 22 respectively If an ANOVA test is conducted to test HO 3 versus H1 at least one population mean differs from another what is the numerator degrees of freedom of the F test statistic Answer

Statistics
StatisticsQuestion 3 of 6 3 Suppose a random sample of 18 individuals is drawn from a population that is approximately normally distributed If the sample variance is found to be 6 484 what is the critical value when testing H0 02 4 vs H1 02 4 at the a 0 05 level of significance Round your answer to the nearest thousandths Answer Previous Answer 29 709

Statistics
ProbabilityGiven in the table are the BMI statistics for random samples of men and women Assume that the two samples are independent simple random samples selected from normally distributed populations and do not assume that the population standard deviations are equal Complete parts a and b below Use a 0 01 significance level for both parts a Test the claim that males and females have the same mean body mass index BMI What are the null and alternative hypotheses OA Ho H H H 4 OC Ho 2 H H1 H The test statistic t is Round to two decimal places as needed The P value is Round to three decimal places as needed State the conclusion for the test GEDEE b Construct a confidence interval suitable for testing the claim that males and fernales have the same mean BMI DH HL Round to three decimal places as needed Does the confidence interval support the conclusion of the test because the confidence interval contains OB Ho H H2 OD Ho H H H H H OA Reject the null hypothesis There is not sufficient evidence to warrant rejection of the claim that men and women have the same mean BMI OB Reject the null hypothesis There is sufficient evidence to warrant rejection of the claim that men and women have the same mean BMI OC Fail to reject the null hypothesis There is sufficient evidence to warrant rejection of the claim that men and women have the same mean BMI OD Fail to reject the null hypothesis There is not sufficient evidence to warrant rejection of the claim that men and women have the same mean BMI Male BMI Female BMI P 44 H n X 27 8884 s 8 242445 1 44 26 1997 4 670266


Statistics
StatisticsQuestion 6 of 6 6 Two independent samples of size 25 and 30 respectively are drawn from normal populations If the two sample variances are observed to be 16 46 and 12 48 respectively what is the numerator degrees of freedom of the test statistic as constructed in the lecture notes when testing whether the two population variances are different Answer Continue Reset answer

Statistics
StatisticsIdentify the type I error and the type II error that corresponds to the given hypothesis The proportion of people who write with their left hand is equal to 0 28 Which of the following is a type I error www O A Reject the claim that the proportion of people who write with their left hand is 0 28 when the proportion is actually different from 0 28 OB Fail to reject the claim that the proportion of people who write with their left hand is 0 28 when the proportion is actually 0 28 OC Reject the claim that the proportion of people who write with their left hand is 0 28 when the proportion is actually 0 28 O D Fail to reject the claim that the proportion of people who write with their left hand is 0 28 when the proportion is actually different from 0 28 Which of the following is a type Il error OA Fail to reject the claim that the proportion of people who write with their left hand is 0 28 when the proportion is actually different from 0 28 OB Reject the claim that the proportion of people who write with their left hand is 0 28 when the proportion is actually different from 0 28 OC Reject the claim that the proportion of people who write with their left hand is 0 28 when the proportion is actually 0 28 OD Fail to reject the claim that the proportion of people who write with their left hand is 0 28 when the

Statistics
StatisticsUse the Wording of Final Conclusion flow chart interactive to answer the following question When testing the claim that the mean weight of African elephants is greater than 2000 kg there is not sufficient evidence to reject the null hypothesis What is the correct wording of the final conclusion Choose the correct answer below There is not sufficient evidence to reject the claim that the mean weight of African elephants is greater than O A 2000 kg There is not sufficient evidence to support the claim that the mean weight of African elephants is greater than O B 2000 kg There is sufficient evidence to reject the claim that the mean weight of African elephants is greater than 2000 OC kg There is sufficient evidence to support the claim that the mean weight of African elephants is greater than OD 2000 kg

Statistics
StatisticsUse the Hypothesis Testing Procedure for Hypothesis Tests flow chart interactive to answer the following question In conducting a hypothesis test of the claim that p 0 4 the critical value is z 2 33 and the test statistic is 2 88 Which one of the following is the correct decision stated in nontechnical terms Choose the correct answer below O A There is not sufficient evidence to support the claim that p 0 4 O B There is not sufficient evidence to reject the claim that p 0 4 OC There is sufficient evidence to support the claim that p 0 4 OD There is sufficient evidence to reject the claim that p 0 4

Statistics
ProbabilityE and F are disjoint events then P E or F P E and F P F P E P F P E P F P E and F

Statistics
ProbabilityAmong 29 to 34 year olds 29 say they have called a talk show while under the influence of alcohol Suppose four 29 to 34 year olds are selected at random Complete parts a through d below a What is the probability that all four have called a talk show while under the influence of alcohol Round to four decimal places as needed b What is the probability that at least one has not called a talk show while under the influence of alcohol Round to four decimal places as needed c What is the probability that none of the four have called a talk show while under the influence of alcohol Round to four decimal places as needed d What is the probability that at least one has called a talk show while under the influence of alcohol Round to four decimal places as needed

Statistics
StatisticsThe probability that a randomly selected 3 year old male stink bug will live to be 4 years old is 0 95119 a What is the probability that two randomly selected 3 year old male stink bugs will live to be 4 years old b What is the probability that six randomly selected 3 year old male stink bugs will live to be 4 years old c What is the probability that at least one of six randomly selected 3 year old male stink bugs will not live to be 4 years old Would it be unusual if at least one of six randomly selected 3 year old male stink bugs did not live to be 4 years old COLLE a The probability that two randomly selected 3 year old male stink bugs will live to be 4 years old is Round to five decimal places as needed b The probability that six randomly selected 3 year old male stink bugs will live to be 4 years old is Round to five decimal places as needed c The probability that at least one of six randomly selected 3 year old male stink bugs will not live to be 4 years old is Round to five decimal places as needed Would it be unusual if at least one of six randomly selected 3 year old male stink bugs did not live to be 4 years old because the probability of this happening is 0 05 less than equal to

Statistics
StatisticsIn a certain game of chance a wheel consists of 52 slots numbered 00 0 1 2 50 To play the game a metal ball is spun around the wheel and is allowed to fall into one of the numbered slots Complete parts a through c below COLOR The probability that the metal ball falls into the slot marked 4 is Round to four decimal places as needed Interpret this probability Select the correct choice below and fill in the answer box within your choice Type a whole number OA If the wheel is spun 1000 times it is expected that about OB If the wheel is spun 1000 times it is expected that exactly 4 c Determine the probability that the metal ball lands in an odd slot Interpret this probability The probability that the metal ball lands in an odd slot is Round to four decimal places as needed of those times result in the ball landing in slot 4 of those times result in the ball not landing in slot Interpret this probability Select the correct choice below and fill in the answer box within your choice Type a whole number OA If the wheel is spun 100 times it is expected that exactly odd number OB If the wheel is spun 100 times it is expected that about number of those times result in the ball not landing on an of those times result in the ball landing on an odd

Statistics
StatisticsQuestion 5 of 6 5 Two independent samples are drawn from normal populations with sample variances 12 46 and 16 48 respectively To test if the two population variances are different what is the test statistic as constructed in the lecture notes Round your answer to the nearest thousandths Answer

Statistics
ProbabilityOnce a woman won 1 million in a scratch off game from a lottery Some years later she won 1 million in another scratch off game In the first game she beat odds of 1 in 4 2 million to win In the second she beat dds of 1 in 805 600 a What is the probability that an individual would win 1 million in both games if they bought one scratch off ticket from each game b What is the probability that an individual would win 1 million twice in the second scratch off game a The probability that an individual would win 1 million in both games if they bought one scratch off ticket from each game is Use scientific notation Use the multiplication symbol in the math palette as needed Round to the nearest tenth as needed b The probability that an individual would win 1 million twice in the second scratch off game is Use scientific notation Use the multiplication symbol in the math palette as needed Round to the nearest tenth as needed

Statistics
Probabilitypoint s possible ccording to a survey the probability that a randomly selected worker primarily drives a car to work is 0 751 The robability that a randomly selected worker primarily takes public transportation to work is 0 080 Complete parts a hrough d a What is the probability that a randomly selected worker primarily drives a car or takes public transportation to work worker drives a car or takes public transportation to work Type an integer or decimal rounded to three decimal places as needed b What is the probability that a randomly selected worker primarily neither drives a car nor takes public transportation work worker neither drives a car nor takes public transportation to work Type an integer or decimal rounded to three decimal places as needed c What is the probability that a randomly selected worker primarily does not drive a car to work P worker does not drive a car to work Type an integer or decimal rounded to three decimal places as needed d Can the probability that a randomly selected worker primarily walks to work equal 0 25 Why or why not OA Yes The probability a worker primarily drives walks or takes public transportation would equal 1 OB No The probability a worker primarily drives walks or takes public transportation would be greater than 1 O C No The probability a worker primarily drives walks or takes public transportation would be less than 1 Yon If owerk

Statistics
StatisticsAn essay test has 10 questions Students are required to answer 8 of the 10 questions How many different sets of questions could be answered There are different sets of questions that could be answered

Statistics
ProbabilityHow many different simple random samples of size 4 can be obtained from a population whose size is 51 The number of simple random samples which can be obtained is Type a whole number

Statistics
ProbabilityFour members from a 33 person committee are to be selected randomly to serve as chairperson vice chairperson secretary and treasurer The first person selected is the chairperson the second the vice chairperson the third the secretary and the fourth the treasurer How many different leadership structures are possible There are possible different leadership structures Type an integer or fraction Simplify your answer

Statistics
StatisticsQuestion 1 of 6 1 Suppose a random sample of 20 individuals is drawn from a population that is approximately normally distributed If the sample standard deviation is found to be 2 24 what is the value of the test statistic when testing H0 2 6 vs H1 2 6 Round your answer to the nearest thousandths Answer

Statistics
Statisticshe data below are the final exam scores of 10 randomly selected history students and the number of hours they slept e night before the exam Find the equation of the regression line for the given data What would be the predicted score or a history student who slept 15 hours the previous night Is this a reasonable question Round your predicted score the nearest whole number Round the regression line values to the nearest hundredth Hours x 35 2 8 2 4 4 5 6 3 Scores y 65 80 60 88 66 78 85 90 90 71 A 5 04x 56 11 132 Yes it is reasonable B y 5 04x 56 11 20 No it is not reasonable Fifteen hours is well outside the scope of the model C y 5 04x 56 11 132 No it is not reasonable Fifteen hours is well outside the scope of the model D y 5 04x 56 11 20 Yes it is reasonable

Statistics
StatisticsWhich of the following are properties of the linear correlation coefficient Select all that apply The linear correlation coefficient is always between 1 and 1 That is 1 srs1 If r 1 then a perfect negative linear relation exists between the two variables A linear correlation of 0 742 suggests a stronger negative association between two variables than a linear correlation of 0 472 A linear correlation of 0 639 suggests a stronger linear relation between two variables than a linear correlation 0 639 If r is close to 0 then little or no evidence of any relation between the explanatory or response variable exists The correlation coefficient is resistant

Statistics
ProbabilityThe distribution of Bachelor s degrees conferred by a university is listed in the table Assume that a student majors in only one subject What is the probability that a randomly selected student with a Bachelor s degree majored in Physics or Philosophy Round your answer to three decimal places OA 0 251 OB 0 527 OC 0 222 0 470 Major Frequency Physics Philosophy Engineering Business Chemistry 230 204 86 176 222

Statistics
ProbabilityA club elects a president vice president and secretary treasurer How many sets of officers are possible if there are 12 members and any member can be elected to each position No person can hold more than one office OA 11 880 OB 660 OC 1 320 OD 440

Statistics
StatisticsThe manager of a used car lot took inventory of the automobiles on his lot and constructed the following table based on the age of his car and its make foreign or domestic A car was randomly selected from the lot Given that the car selected was a foreign car what is the probability that it was older than 2 years Give your answer as a simplified fraction OA O C 31 60 19 60 Age of Car in years Make 0 2 3 5 6 10 over 10 Total 19 100 25 100 44 200 Foreign Domestic 42 38 28 15 22 11 Total 80 50 26 OB OD 31 50 19 50 0

Statistics
StatisticsWhich of the following is true of the least squares regression line y b x bo Select all that apply A The predicted value of y y is an estimate of the mean value of the response variable for that particular value of the explanatory variable B The least squares regression line minimizes the sum of squared residuals C The sign of the linear correlation coefficient r and the sign of the slope of the least squares regression line b are the same D The least squares regression line maximizes the sum of squared residuals E The least squares regression line always contains the point 0 0 OF The predicted value of y y is an estimate of the mean value of the explanatory variable for that particular value of the response variable G The least squares regression line always contains the point x y

Statistics
StatisticsQuestion 5 of 5 5 What is the slope of the least squares regression line for the data 1 4 2 7 3 5 4 8 5 6 Answer

Statistics
ProbabilityThe managers of a corporation were surveyed to determine the background that leads to a successful manager Each manager was rated as being either a good fair or poor manager by his her boss The manager s educational background was also noted The data appear below Given that a manager is only a fair manager what is the probability that this manager has no college background Give your answer as a simplified fraction H S Degree Some College College Degree Master s or Ph D Totals Good Fair Poor Totals OA O C 5 87 5 17 3 5 9 17 2 17 7 26 24 42 8 74 O B O D 1 32 99 160 10 2 13 23 10 39 87 34 43 160

Statistics
Probabilityn 5 card poker played with a standard 52 card deck 2 598 960 different hands are possible If there are 624 different ways a four of a kind can be dealt find the probability of not being dealt a four of a kind Express the probability as a Fraction but do not simplify 625 OA 2 598 960 624 OB 2 598 960 O C OD 2 598 336 2 598 960 1248 2 598 960

Statistics
StatisticsUse the given data to complete parts a and b below X yo 2 2 4 4 1 5 3 3 6 4 7 4 9 a Draw a scatter diagram of the data Choose the correct answer below OA OB O C Ay 6 4 2 0 0 2 Q Ay 6 4 2 0 0 2 4 Q Ay 2 0 0 2 4 6 Q O D 4 Ay 2 0 0 2 Compute the linear correlation coefficient The linear correlation coefficient for the four pieces of data is
Statistics
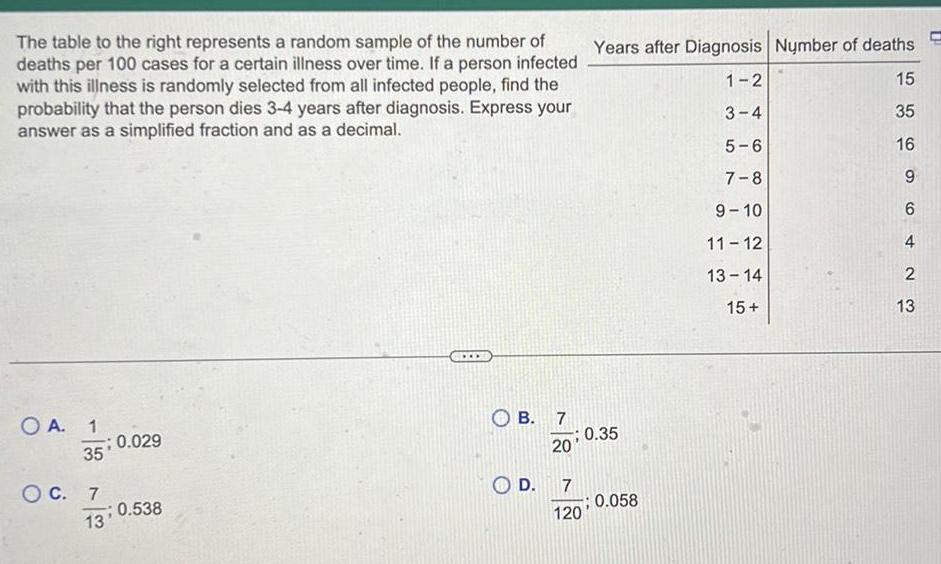
ProbabilityThe table to the right represents a random sample of the number of deaths per 100 cases for a certain illness over time If a person infected with this illness is randomly selected from all infected people find the probability that the person dies 3 4 years after diagnosis Express your answer as a simplified fraction and as a decimal OA 1 35 O C 7 0 029 0 538 13 B 7 D 20 7 120 Years after Diagnosis Number of deaths 15 35 0 35 0 058 1 2 3 4 5 6 7 8 9 10 11 12 13 14 15 16 9 6 4 2 13

Statistics
StatisticsUse the given data to complete parts a and b below yo 4 4 1 5 3 3 6 4 7 4 9 X 2 2 Compute the linear correlation coefficient with the additional data point The linear correlation coefficient for the pieces of data is Round to three decimal places as needed Comment on the effect the additional data point has on the linear correlation coefficient OA The additional data point does not affect the linear correlation coefficient OB The additional data point weakens the appearance of a linear association between the data points O C The additional data point strengthens the appearance of a linear association between the data points Explain why correlations should always be reported with scatter diagrams O A The scatter diagram is needed to determine if the correlation is positive or negative OB The scatter diagram can be used to distinguish between association and causation rrelation coefficient is being affected by the presence of or

Statistics
ProbabilityThe age distribution of members of a gymnastics association is shown in the table A member of the association is selected at random Find the probability that the person selected is between 26 and 35 inclusive Round your answer to three decimal places OA 0 047 OB 251 OC 0 231 D 0184 Age years Under 21 21 25 26 30 31 35 Over 35 Total Frequency 412 400 200 51 25 1 088

Statistics
ProbabilityIf a fair coin is tossed 10 times what is the probability of getting all heads Express the probability as a simplified fraction 1 OA 512 1 OB O C O D 1 1024 1 2048

Statistics
Probabilitysingle 6 sided die is rolled twice The set of 36 equally likely outcomes is 1 1 1 2 1 3 1 4 1 5 1 6 2 1 2 2 3 2 4 2 5 2 6 3 1 3 2 3 3 3 4 3 5 3 6 4 1 4 2 4 3 4 4 4 5 4 6 5 1 5 2 5 3 4 5 5 5 6 6 1 6 2 6 3 6 4 6 5 6 6 Find the probability of getting two numbers whose sum is greater an 10 A 3 OB O C 1 12 5 18