Statistics Questions
The best high school and college tutors are just a click away, 24×7! Pick a subject, ask a question, and get a detailed, handwritten solution personalized for you in minutes. We cover Math, Physics, Chemistry & Biology.

Statistics
Statistics6 A researcher randomly samples 150 adults and finds the sample proportion of individuals with the characteristic of interest to be 0 25 Conduct a hypothesis test H0 p 0 30 vs H1 p 0 30 using the p value approach at the c 0 05 level of significance Do you have sufficient data to reject the null hypothesis OYes ONO Continue Reset answer

Statistics
Statistics3 Will the critical value of the hypothesis H0 p20 50 vs H1 p 0 50 be posit or negative OPositive ONegative Continue Reset answer
Statistics
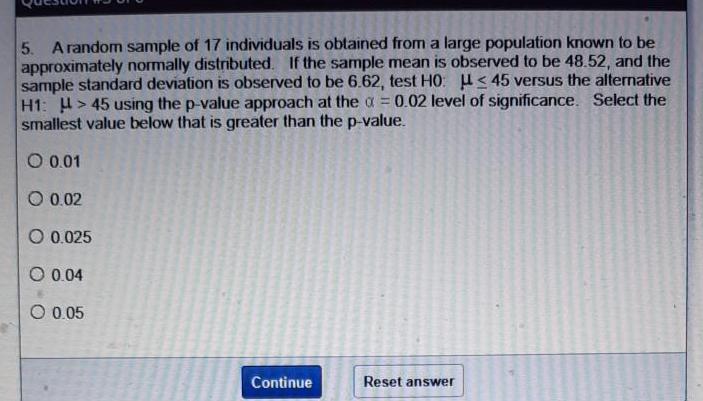
Probability5 A random sample of 17 individuals is obtained from a large population known to be approximately normally distributed If the sample mean is observed to be 48 52 and the sample standard deviation is observed to be 6 62 test HO 45 versus the alternative H1 45 using the p value approach at the 0 02 level of significance Select the smallest value below that is greater than the p value O 0 01 O 0 02 O 0 025 O 0 04 O 0 05 Continue Reset answer

Statistics
Probability4 A random sample of 32 individuals is obtained from a large population If the sample mean is observed to be 8 92 and the sample standard deviation is observed to be 3 46 test H0 10 versus the alternative H1 10 using the classical approach at the a 0 02 level of significance What is the critical value of the test Round your answer to the nearest thousandths Answer Continue Reset answer

Statistics
ProbabilityQuestion 1 of 6 1 A random sample of 28 individuals is obtained from a large population known to be approximately normally distributed If the sample mean is observed to be 16 9 and the sample variance is observed to be 8 2 test H0 18 versus the alternative H1 18 using the confidence interval approach at the 0 05 level of significance What is the left endpoint of this interval Round your answer to the nearest hundredths Answer

Statistics
ProbabilityCollege students are randomly selected and arranged in groups of three The random variable x is the number in the group who say that they take one or more online courses Determine whether a probability distribution is given If a probability distribution is given find its mean and standard deviation If a probability distribution is not given identify the requirements that are not satisfied Does the table show a probability distribution Select all that apply A Yes the table shows a probability distribution B No not every probability is between 0 and 1 inclusive C No the sum of all the probabilities is not equal to 1 D No the random variable x is categorical instead of numerical E No the numerical values of the random variable x are not associated with probabilities Find the mean of the random variable x Select the correct choice below and if necessary fill in the answer box to complete your choice OA SCCOR students Round to one decimal place as needed OB The table does not show a probability distribution Find the standard deviation of the random variable x Select the correct choice below and if necessary fill in the answer box to complete your choice A G students Round to one decimal place as needed OB The table does not show a probability distribution X 0 1 2 3 P x 0 102 0 352 0 404 0 142 S

Statistics
StatisticsDetermine which of the four levels of measurement nominal ordinal interval ratio is most appropriate for the data below Class times measured in minutes Choose the correct answer below OA The nominal level of measurement is most appropriate because the data cannot be ordered OB The ordinal level of measurement is most appropriate because the data can be ordered but differences obtained by subtraction cannot be found or are meaningless OC The interval level of measurement is most appropriate because the data can be ordered differences obtained by subtraction can be found and are meaningful and there is no natural starting point OD The ratio level of measurement is most appropriate because the data can be ordered differences can be found and are meaningful and there is a natural starting zero point


Statistics
ProbabilityK Find the indicated z score The graph depicts the standard normal distribution with mean 0 and standard deviation 1 Click to view page 1 of the table Click to view page 2 of the table SEEEE

Statistics
StatisticsWhy does margin of error have no relevance for confidence interval estimates of o or o What is wrong with expressing the confidence interval of 7 2 bpm o 14 2 bpm as 10 7 bpm 3 5 bpm a Choose the correct answer below www A Like confidence interval estimates of p or confidence interval estimates of oor o are created using a distribution that is symmetric so there is no E as in confidence interval estimates of p or OB Unlike confidence interval estimates of p or confidence interval estimates of oor o are created using a distribution that is symmetric so there is no E as in confidence interval estimates of p or OC Unlike confidence interval estimates of p or confidence interval estimates of o or o are not created using a distribution that is symmetric so there is no E as in confidence interval estimates of p or OD Like confidence interval estimates of p or confidence interval estimates of o or o are not created using a distribution that is symmetric so there is no E as in confidence interval estimates of p or

Statistics
StatisticsA newspaper provided a snapshot illustrating poll results from 1910 professionals who interview job applicants The illustration showed that 26 of them said the biggest interview turnoff is that the applicant did not make an effort to learn about the job or the company The margin of error was given as 3 percentage points What important feature of the poll was omitted Choose the correct answer O The confidence interval O The confidence level O The point estimate O The sample size


Statistics
ProbabilityAmanda paid 15 54 for a 2 12 pound bag of shrimp at one store The following week she paid 33 89 for a 4 54 pound bag at another store Find the unit price for each bag Then state which bag is the better buy based on the unit price Round your answers to the nearest cent Unit price for the 2 12 pound bag Unit price for the 4 54 pound bag The better buy 0 34 per pound 0 47 per pound The 2 12 pound bag The 4 54 pound bag Neither They have the same unit price

Statistics
StatisticsART D From the scatterplot and correlation chart below write a conclusion that includes the following information A survey was conducted to determine the weight and Highway MPG of 20 cars 1 What is the explanatory and response variable 2 What is the equation of the regression line 3 What is the correlation coefficient and is it significant 4 Based on this scatter plot please provide an interpretation of the slope and the y intercept in one or two sentences If there is no valid interpretation please explain why MPG SHANDELS 40 35 30 25 20 15 10 5 0 1500 2000 Correlation 0 85369 Weight vs Highway MPG 2500 3000 Weight y 0 006x 47 942 R 0 7288 3500 4000 4500


Statistics
StatisticsThe boxplot below shows salaries for CPAS and Actuaries in a town CPA H Actuary 20 30 40 50 60 Salary thousands of 70 80 90 If a person is making the minimum salary for a CPA they are making less than of Actuaries

Statistics
StatisticsAs of July 8 2020 the national average price for a gallon of regular unleaded gasoline was 2 18 The prices for a sample of n 10 gas stations in the state of Illinois are provided 2 365 2 417 2 437 2 421 2 396 2 444 2 422 2 374 2 422 2 447 It is of interest to use this sample to compare the average gas price in Illinois to the national average Use the provided randomization distribution based on 1 000 samples to estimate the p value for this sample 4

Statistics
ProbabilityD In May 2012 President Obama made history by revealing his support of gay marriage Around that time the Gallup Organization polled 1 024 U S adults about their opinions on gay lesbian relations and gay marriage They found that 54 of those sampled viewed gay lesbian relations as morally acceptable and that 50 felt that gay marriage should be legal A 90 confidence interval for the proportion of American adults who support gay marriage is 0 475 0 524 Does this confidence interval provide evidence that the percentage of American adults who support gay marriage differs from 50 State the significance level you are using No significance level of 5 O No significance level of 10 O Yes significance level of 5 Yes significance level of 10

Statistics
StatisticsThe following figure shows a randomization distribution for the hypotheses Ho versus H The statistic used for each sample is D 1 2 Which of the two possible sample results provides the most evidence against Ho Ox 50 2 x 53 1 Ox1 56 5 Xx2 51 3 Frequency 100 2 60 40 20 Differences

Statistics
StatisticsThere are 24 students enrolled in an introductory statistics class at a small university As an in class exercise the students were asked how many hours of television they watch each week Their responses broken down by gender are summarized in the provided table Assume that the students enrolled in the statistics class are representative of all students at the university Male 3 1 12 12 0 4 10 4 5 5 2 10 10 Female 10 3 2 10 3 2 O 1 6 1 5 6 x 4 Define the appropriate parameter s and state the hypotheses for testing if this sample provides evidence that on average male students watch more television than female students at this university O Parameters mean number of hours of television per week for male students and television per week for female students Hypotheses Ho 1 versus Ha 1 M Parameters mean number of hours of television per week for male students and 2 television per week for female students Hypotheses Ho 1 2 versus Ha H O Parameters mean number of hours of television per week for male students and television per week for female students Hypotheses Ho 1 2 versus Ha 12 O Parameters mean number of hours of television per week for male students and 2 television per week for female students Hypotheses Ho 1 2 versus Ha M mean number of hours of mean number of hours of mean number of hours of mean number of hours of

Statistics
StatisticsA certain species of tree has an average life span of 130 years A researcher has noticed a large number of trees of this species washing up along a beach as driftwood She takes core samples from 27 of those trees to count the number of rings and measure the widths of the rings Counting the rings allows the researcher to determine the age of each tree The average age of the trees in the sample is approximately 120 years One of her interests is determining if this sample provides evidence that the average age of the driftwood is less than the 130 year life span expected for this type of tree If the average age is less than 130 years it might suggest that the trees have died from unusual causes such as invasive beetles or logging Define the appropriate parameter s and state the hypotheses for testing if this sample provides evidence that the average age of the driftwood along this beach is less than 130 years O Parameter O Parameter O Parameter O Parameter average age of driftwood trees along this beach Hypotheses Ho H 130 versus H 130 average age of driftwood trees along this beach Hypotheses Ho 130 versus H 130 average age of driftwood trees along this beach Hypotheses Ho 130 versus Ha 130 average age of driftwood trees along this beach Hypotheses Ho 130 versus Ha 130

Statistics
StatisticsMatch the given conclusion to the most appropriate p value 0 0001 0 0361 0 0735 0 6082 The result is significant at the 5 level but not at a 1 level 4 27

Statistics
StatisticsFype Il error occurs by O rejecting the null hypothesis when the null hypothesis is false O not rejecting the null hypothesis when the null hypothesis is fa O rejecting the null hypothesis when the null hypothesis is true O not rejecting the null hypothesis when the null hypothesis is tru

Statistics
StatisticsAccording to U S Census data 71 6 of Americans are age 21 and over The provided figure shows possible sampling distributions for the proportion of a sample age 21 and over for samples of size n 50 n 125 and n 250 0 54 0 60 0 66 0 72 0 78 0 84 Match the sample sizes n 50 n 125 and n 250 to their sampling distribution Sample C n Save for Later A 50 125 0 90 Attempts 0 of 1 used Submit Answer

Statistics
StatisticsThe sampling distribution shows sample means from samples of size n 50 59 61 63 65 67 69 71 Using the sampling distribution how likely is 68 7 O Reasonably likely to occur from a sample of this size O Unusual but might occur occasionally O Extremely unlikely to ever occur 4

Statistics
StatisticsIn a poll conducted before a Massachusetts city s mayoral election 134 of 420 randomly chosen likely voters indicated that they planned to vote for the Democratic candidate Suppose that an article describing the poll says that the margin of error for the statistic is 0 045 Use this information to find an interval estimate and interpret the confidence interval i to i Democratic candidate is between i We are 95 sure that the proportion of likely voters who plan to vote for the and i

Statistics
StatisticsConsider testing the hypotheses Ho p 0 4 versus Ha p 0 4 Match the statistic to its p value a p b p c p d p p value 0 72 V p value 0 293 p value 0 138 p value 0 019

Statistics
StatisticsA student in an introductory statistics course investigated if there is evidence that the proportion of milk chocolate M M s that are green differs from the proportion of dark chocolate M M s that are green She purchased a bag of each variety and her data are summarized in the following table Milk Chocolate Green Not Green Total Total 8 Dark Chocolate 4 12 33 38 71 41 42 83 Define the appropriate parameter s and state the hypotheses for testing if the proportion of green M M s differs for milk chocolate and dark chocolate M M s

Statistics
StatisticsA sample of 148 college students reports sleeping an average of 6 85 hours on weeknights with a margin of error of 0 35 hours Based on this information identify the following as plausible or not for the average amount of sleep college students get on weeknights 8 hours O Plausible O Not plausible

Statistics
ProbabilityThe sampling distribution shows sample proportions from samples of size n 35 0 42 0 49 0 56 0 63 0 70 0 77 0 84 0 91 If samples of size n 65 had been used instead of n 35 which of the following would be true O The sample statistics would be centered at roughly the same proportion O The sample statistics would be centered at a smaller proportion O The sample statistics would be centered at a larger proportion

Statistics
StatisticsIdentify whether the sample 20 20 20 20 20 is a possible bootstrap sample from the original sample 20 24 19 23 18 O Possible O Not Possible

Statistics
ProbabilityA sample of size 46 with a mean of 13 6 is to be used to construct a confidence interval for A bootstrap distribution based on 1 000 samples is created Where will the bootstrap distribution be centered O 46 13 6 0 0 1 000

Statistics
ProbabilityIt is of interest to test the hypotheses Ho P 0 8 versus H P 0 8 The sample outcome based on n 10 observations is P 0 7 and the randomization statistic to be calculated is p The p value for this test was found to be 0 322 If the test was performed correctly where should the randomization distribution be centered 0 322 O 0 7 0 8 O 10
Statistics
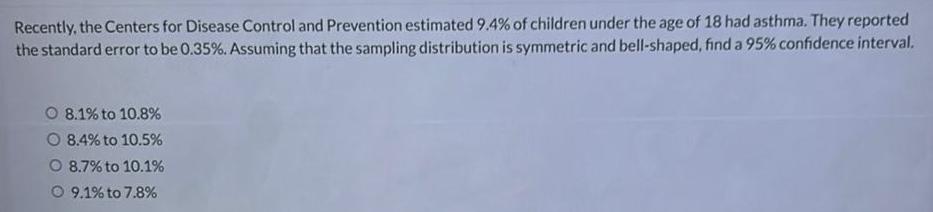
ProbabilityRecently the Centers for Disease Control and Prevention estimated 9 4 of children under the age of 18 had asthma They reported the standard error to be 0 35 Assuming that the sampling distribution is symmetric and bell shaped find a 95 confidence interval O 8 1 to 10 8 O 8 4 to 10 5 O 8 7 to 10 1 9 1 to 7 8

Statistics
StatisticsIdentify if the following statement is a proper interpretation of a 95 confidence interval 95 of the population values will fall within this interval O Correct O Incorrect

Statistics
ProbabilityIn a recent Gallup survey of 1 012 randomly selected U S adults age 18 and over 53 said that they were dissatisfied with the quality of education students receive in kindergarten through grade 12 They also report that the margin of sampling error is plus or minus 4 What is the sample being used O U S adults age 18 and over O 1 012 randomly selected U S adults O U S adults satisfied with K 12 education O U S adults dissatisfied with K 12 education 4

Statistics
ProbabilityAccording to ESPN com the average number of yards per game for all NFL running backs with at least 50 attempts in the 2011 season was 49 yards game A sample of 20 running backs from the 2011 season averaged 46 54 yards game Is 49 yards game a parameter or statistic O Parameter O Statistic


Statistics
ProbabilityA certain forum reported that in a survey of 2008 American adults 21 said they believed in astrology a Calculate a confidence interval at the 99 confidence level for the proportion of all adult Americans who believe in astrology Round your answers to three decimal places 0 233 0 187 Interpret the resulting interval We are 99 confident that the true population mean lies above this interval We are 99 confident that this interval contains the true population mean We are 99 confident that the true population mean lies below this interval We are 99 confident that this interval does not contain the true population mean b What sample size would be required for the width of a 99 CI to be at most 0 05 irrespective of the value of p Round your answer up to the nearest integer 441 X

Statistics
ProbabilityA sample of 11 joint specimens of a particular type gave a sample mean proportional limit stress of 8 42 MPa and a sample standard deviation of 0 77 MPa a Calculate and interpret a 95 lower confidence bound for the true average proportional limit stress of all such joints Round your answer to two decimal places X MPa 1 429 Interpret this bound O With 95 confidence we can say that the value of the true mean proportional limit stress of all such joints is greater than this value With 95 confidence we can say that the value of the true mean proportional limit stress of all such joints is less than this value O With 95 confidence we can say that the value of the true mean proportional limit stress of all such joints is centered around this value What if any assumptions did you make about the distribution of proportional limit stress We must assume that the sample observations were taken from a normally distributed population We must assume that the sample observations were taken from a uniformly distributed population We do not need to make any assumptions We must assume that the sample observations were taken from a chi square distributed population b Calculate and interpret a 95 lower prediction bound for proportional limit stress of a single joint of this type Round your answer to two decimal places X MPa 4 832 Interpret this bound If this bound is calculated for sample after sample in the long run 95 of these bounds will provide a lower bound for the corresponding future values of the proportional limit stress of single joint of this type If this bound is calculated for sample after sample in the long run 95 of these bounds will provide a higher bound for the corresponding future values of the proportional limit stress of single joint of this type If this bound is calculated for sample after sample in the long run 95 of these bounds will be centered around this value for the corresponding future values of the proportional limit stress of a single joint of this type

Statistics
Statistics20 Suppose a simple random sample of size 13 is selected from a normal population Find the right endpoint of the 95 confidence interval for the population variance if the sample variance is 7 82 Round your answer to the nearest thousandths Answer Continue Reset answer

Statistics
Probability1288002 quizzes 3605 A hospital has a patient population of 1000 of which 400 are male and 600 are female Of the male patients 60 have heart disease while only 30 of the female patients have heart disease Answer the following Express your answer as a decimal Round your answers to the nearest hundredth if applicable Hint You may want to consider organizing your information in a table look at your notes where probability has the word given so that you get the idea of how to set this up a If a patient is selected at random from the hospital what is the probability that the patient has heart disease b Calculate the probability that a patient has heart disease given they are male c Calculate the probability that a patient is male given they have heart disease d If a patient is selected at random what is the probability that

Statistics
Statistics16 Suppose x is a random variable that follows the chi square distribution with 5 degrees of freedom Use the chi square chart to approximate P x 1 610 Answer Continue Reset answer

Statistics
StatisticsOn May 2nd 2023 the Writer s Guild of America went on strike When the writer s advocated for their case regarding fair wages they published the Median salary of writers wages In at least 3 complete sentences explain why you believe the writers used the Median value instead of the Mean to advocate for themselves

Statistics
ProbabilityA hospital has a patient population of 1000 of which 400 are male and 600 are female Of the male patients 60 have heart disease while only 30 of the female patients have heart disease Answer the following Express your answer as a decimal Round your answers to the nearest hundredth if applicable Hint You may want to consider organizing your information in a table look at your notes where probability has the word given so that you get the idea of how to set this up a If a patient is selected at random from the hospital what is the probability that the patient has heart disease b Calculate the probability that a patient has heart

Statistics
Statistics12 A simple random sample of size 100 was selected from a large population and a 95 confidence interval for the population proportion was constructed Determine whether the confidence interval is valid if the sample proportion is 0 11 O Yes O No Continue Reset answer

Statistics
Probability11 Consider a large population in which 34 17 of individuals have a characteristic of interest If a random sample of size 70 is selected from this population what approximately is the standard deviation of the sample proportion Round your answer to the nearest thousandths Answer Continue Reset answer

Statistics
Probability7 A random sample of size 22 is selected from a large population with unknown mean and unknown standard deviation Find the left endpoint of a 95 confidence interval for the population mean given that the sample mean is 12 6 and the sample standard deviation is 3 8 Assume the use of the t distribution is appropriate Round your answer to the nearest hundredths Answer Continue Reset answer

Statistics
Probability4 Suppose a large population has an unknown mean and a known standard deviation 0 4 4 How many individuals should be randomly sampled from this population so that the sample mean is within 0 75 unit of with 95 confidence Answer Continue Reset answer

Statistics
Probability6 Use the t chart to find t when 0 08 13 0 2 Note If you do not use the t chart you will need to round your answer to the nearest thousandths Answer Continue Reset answer