Statistics Questions
The best high school and college tutors are just a click away, 24×7! Pick a subject, ask a question, and get a detailed, handwritten solution personalized for you in minutes. We cover Math, Physics, Chemistry & Biology.

Statistics
StatisticsData were collected for 455 birds from Indian River County The wingspan of the birds in mm is summarized in the table below Wingspan mm 100 109 110 119 120 129 130 139 140 149 150 159 160 169 Frequency 82 86 23 61 49 95 59 What is the class boundary between the third and fourth classes Class boundary Lower Class Limit MBUN What is the lower limit of the third class Midpoint What is the upper limit of the fourth class Upper Class Limit What is the midpoint of the second class

Statistics
StatisticsUse the data below to complete the following calculations 77 79 22 74 15 49 18 35

Statistics
StatisticsA survey of 600 randomly selected high school students determined that 565 play organized sports a What is the probability that a randomly selected high school student plays organized sports b Interpret this probability a The probability that a randomly selected high school student plays organized sports is 0 942 Round to the nearest thousandth as needed b Choose the correct answer below Type a whole number OA If 1 000 high school students were sampled it would be expected that about OB If 1 000 high school students were sampled it would be expected that exactly sports of them play organized spor of them play organized

Statistics
StatisticsIn a certain card game the probability that a player is dealt a particular hand is 0 48 Explain what this probability means If you play this card game 100 times will you be dealt this hand exactly 48 times Why or why not Choose the correct answer below OA The probability 0 48 means that exactly 48 out of every 100 dealt hands will be that particular hand Yes you will be dealt this hand exactly 48 times since the probability refers to long term behavior not short term OB The probability 0 48 means that exactly 48 out of every 100 dealt hands will be that particular hand Yes you will be dealt this hand exactly 48 times since the probability refers to short term behavior not long term OC The probability 0 48 means that approximately 48 out of every 100 dealt hands will be that particular hand No you will not be dealt this hand exactly 48 times since the probability refers to what is expected in the long term not short term O D The probability 0 48 means that approximately 48 out of every 100 dealt hands will be that particular hand No you will not be dealt this hand exactly 48 times since the probability refers to what is expected in the short term not long term


Statistics
ProbabilityWhat is the probability of an event that is impossible Suppose that a probability is approximated to be zero based on empirical results Does this mean that the event is impossible What is the probability of an event that is impossible 0 Type an integer or a decimal Suppose that a probability is approximated to be zero based on empirical results Does this mean that the event is impossible O No OYes
Statistics
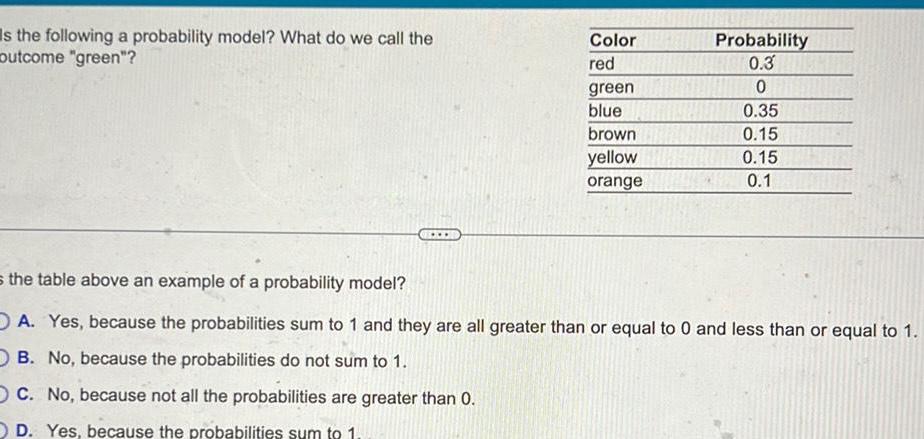
ProbabilityIs the following a probability model What do we call the outcome green Color red green blue brown yellow orange Probability 0 3 0 0 35 0 15 0 15 0 1 s the table above an example of a probability model OA Yes because the probabilities sum to 1 and they are all greater than or equal to 0 and less than or equal to 1 OB No because the probabilities do not sum to 1 OC No because not all the probabilities are greater than 0 D Yes because the probabilities sum to 1

Statistics
StatisticsWhat does it mean for an event to be unusual Why should the cutoff for identifying unusual events not always be 0 05 Choose the correct answer below O A An event is unusual if it has a probability equal to The choice of a cutoff should consider the context of the problem OB An event is unusual if it has a low probability of occurring The choice of a cutoff should consider the context of the problem OC An event is unusual if it has a high probability of occurring The choice of the cutoff should consider the context of the problem O D An event is unusual if it has a probability equal to 1 The choice of a cutoff should consider the context of the problem

Statistics
ProbabilitySuppose that events E and F are independent P E 0 4 and P F 0 8 What is the P E and F The probability P E and F is Type an integer or a decimal

Statistics
Probabilitybout 15 of the population of a large country is nervous around strangers If two people are randomly selected what is he probability both are nervous around strangers What is the probability at least one is nervous around strangers assume the events are independent a The probability that both will be nervous around strangers is Round to four decimal places as needed

Statistics
ProbabilityFor the fiscal year 2007 a tax authority audited 1 61 of individual tax returns with income of 100 000 or more Suppose this percentage stays the same for the current tax year What is the probability that two randomly selected returns with income of 100 000 or more will be audited The probability is Round to six decimal places as needed

Statistics
StatisticsThe average final exam score for the statistics course is 75 A professor wants to see in the average final exam score for students who are given colored pens on the first day of class is different The final exam scores for the 15 randomly selected students who were given the colored pens are shown below Assume that the distribution of the population is normal 68 76 63 85 61 52 53 56 64 87 63 54 56 67 79 What can be concluded at the the a 0 01 level of significance level of significance q B B B B 8 OF a For this study we should use t test for a population mean O b The null and alternative hypotheses would be Ho PE H 75 75

Statistics
StatisticsIn a survey 37 of the respondents stated that they talk to their pets on the telephone A veterinarian believed this result to be too high so she randomly selected 170 pet owners and discovered that 59 of them spoke to their pet on the telephone Does the veterinarian have a right to be skeptical Use the a 0 05 level of significance Click here to view the standard normal distribution table page 1 Click here to view the standard normal distribution table page 2 is given to be random Round to one decimal place as needed What are the null and alternative hypotheses p 0 37 Ho 0 37 versus H Type integers or decimals Do not round Determine the test statistic Zo Zo the requirements for testing the hypothesis p Round to two decimal places as needed are satisfied 8 0

Statistics
StatisticsDraw a normal curve with 55 and o 18 Label the mean and the inflection points Choose the correct graph of the normal curve below O A s 55 73 91 5 OB A 37 55 73 O C M 19 37 55 Q

Statistics
ProbabilitySuppose the lengths of human pregnancies are normally distributed with u 266 days and o 16 days Complete parts a and b below OB The probability that a randomly selected human pregnancy lasts less than 240 days is 0 9479 b The figure to the right represents the normal curve with 266 days and o 16 days The area between x 290 and x 305 is 0 0594 Provide two interpretations of this area Provide one interpretation of the area using the given values Select the correct choice below and fill in the answer boxes to complete your choice Type integers or decimals Use ascending order A The proportion of human pregnancies that last less than 290 or more than 350 days is 0 1406 OB The proportion of human pregnancies that last between and days is Provide a second interpretation of the area using the given values Select the correct choice below and fill in the answer boxes to complete your choice Type integers or decimals Use ascending order OA The probability that a randomly selected human pregnancy lasts less than OB The probability that a randomly selected human pregnancy lasts between or more than and C days is days is A 265 290 305

Statistics
StatisticsOne of the more popular statistics reported in the media is the president s job approval rating The approval rating is reported as the proportion of the population approve of the job that the sitting president is doing and is typically based on a random sample of registered voters where the sample size is the same week to week Complete parts a and b below b A poll showed the approval rating to be 0 49 49 A second poll based on 1500 randomly selected voters showed that 777 approved of the job the president was doing Do the results of the second poll indicate that the proportion of voters who approve of the job the president is doing is significantly higher than the original level Explain Assume the 0 05 level of significance Identify the null and alternative hypotheses for this test A Ho p 0 49 H p 0 49 D Ho p 0 49 H p 0 49 Find the test statistic for this hypothesis test Z Round to two decimal places as needed OB Ho p 0 49 H p 0 49 E Ho p 0 49 H p 0 49 OC Ho p 0 49 H p 0 49 F Ho p 0 49 H p 0 49 Clear all Check answer

Statistics
StatisticsThe following data were obtained from a repeated measures research study What is the value of Mp for these data Subject 1st 2nd 1 2 3 4 10 4 15 8 7 5 Mp 3 Mp 3 5 MD 4 Mp 4 5 6 11

Statistics
StatisticsConstruct a 95 confidence interval of the population proportion using the given information x 80 m 200 Click here to view the table of critical values The lower bound is The upper bound is Round to three decimal places as needed Table of critical values Level of Confidence 1 a 100 90 95 99 Area in Each Tail 0 05 0 025 0 005 C 2 Critical Value z 1645 1 96 2 575

Statistics
StatisticsFor an independent measures study the width of a confidence interval estimating does not depend on the size of the difference between M and M True False

Statistics
ProbabilityDetermine whether the distribution represents a probability distribution 3 1 4 7 0 3 0 4 0 2 X P X 0 1 Send data to Excel The distribution Choose one represents a probability distribution

Statistics
StatisticsThe Muller Lyer illusion is shown in the figure Although the two horizontal lines are the same length the line on the left appears to be much longer To examine the strength of this illusion Gillam and Chambers 1985 recruited 10 participants who reproduced the length of the horizontal line in the left panel of the figure The strength of the illusion was measured by how much longer the reproduced line was than the actual length of the line in the figure Below are data like those observed by the researchers Each value represents how much longer in millimeters the reproduced line was than the line in the figure Estimation error 2 08 0 49 2 7 3 42 1 59 3 82 3 91 To save your time the corresponding stats have already been calculated SS 10 59 and M 2 628 Show your work part of the steps have already been given fill in the blanks or make your own changes 2 04 2 87 a Use a one tailed hypothesis test with a 01 to demonstrate that the individuals in the sample significantly overestimate the true length of the line Step 1 Ho M Step 2 a 01 one tailed Step 3 estimation error 0 H 0 estimation error 3 36 p T T DIST RT Step 4 Reject Accept the null hypothesis b Calculate the estimated d to measure the size of this effect c Construct a 95 confidence interval for the population mean estimated length of the vertical line Tip for a 95 confidence interval use t 2 262 because t a 2

Statistics
StatisticsA sample of n 25 scores produces at statistic of t 2 052 If the researcher is conducting a two tailed hypothesis test which of the following is the correct statistical decision df 18 19 20 21 22 23 24 25 20 0 25 0 50 000 J 89J 0 688 0 687 0 686 0 686 0 685 0 685 0 684 0 60 U 014 0 10 0 20 3079 1 330 1 328 1 325 1 323 1 321 1 319 1 318 1 316 1316 1 282 Proportion in One Tail 0 05 Proportion in Two Tails Combined 0 10 6314 1 729 1 725 1 721 1 717 1 714 1 711 1 708 706 1 645 0 025 The researcher should reject the null hypothesis with a 05 but not with a 01 The researcher should reject the null hypothesis with either a 05 or a 01 The researcher should fail to reject the null hypothesis with either a 05 or a 01 This is impossible to determine based on the provided information 0 05 12 706 2 101 2 093 2 086 2 080 2 074 2 069 2 064 2 060 2 056 60 0 01 0 02 12 2 539 2 528 2 518 2 508 2 500 2 492 2 485 2 79 2 320

Statistics
Statistics3 On N 0 1 let W w 1 0 1 w Z w 1 0 1 w 1 1 3 w a Compute the covariance of W Z 5 marks b Are W and Z independent 10 marks

Statistics
StatisticsQ8 If z a ib Z c id then z 2 1 Z Z a acbd bc ad a c b d b ac bd bc ad a c b d c ac bd bc ad a c b d d ac bd bc ad a c b d

Statistics
StatisticsQ29 Differentiation of y 9l083 xy 19x1 xy is equal to x 0 dy a dx log x 9 x dx xy b dy dx 1 1 x 2x y logx 2yx y 1 2 y 1 1 x 2x2y log x c dy x dy d dx 9x 2yx y 1 x y x x2y 1 9 x 1 x 2x2y log x

Statistics
StatisticsWhat causes us to overeat Une surprising factor might be the material of the plate on which our food is served Williamson Block and Keller 2016 gave n 68 participants two donuts each and measured the amount of food that was wasted by each participant In an independent samples design participants received their donuts either on a disposable paper plate or on a reusable plastic plate Data like those observed by the authors are listed below Paper Plate Grams of Wasted Food Grams of Wasted Food 37 35 34 36 40 34 33 39 Step 1 H 0 H Paper Plastic Step 2 Use 05 one tailed Step 3 Test the hypothesis that participants who received donuts on a paper plate wasted more food than participants who were served donuts on a plastic reusable plate Use a 05 one tailed Show all steps part of the steps have already been given fill in the blanks or make your own changes Paper Plastic Plate p T Step 4 Reject Accept the null hypothesis 34 31 36 30 34 33 37 29 Plastic 0

Statistics
Statistics2 If X N 42 10 and X is computed from a random sample of size 16 what is th distribution of X 20 pt

Statistics
StatisticsHow many years are required for an investment to double in value if it is appreciating at the rate of 14 compounded continuously At 14 compounded continuously the investment doubles in Round to one decimal place as needed years

Statistics
ProbabilityA sample of size n 48 is drawn from a population whose standard deviation is o 23 Part 1 of 2 a Find the margin of error for a 95 confidence interval for u Round the answer to at least three decimal places The margin of error for a 95 confidence interval for u is 50 Part 2 of 2 b If the confidence level were 99 would the margin of error be larger or smaller because the confidence level is higher


Statistics
StatisticsQ35 If the value of the determinant 1 1 1 W 1 w 1 11 w W value of k k w w where w Then find t

Statistics
StatisticsQ23 Polar conversion of 3 7 is a 10 2 tan b 10 2n tan 10 7 c 10 tan d 10 2 tan 713 713

Statistics
StatisticsQ13 Solution of the differential equation a e y e x tan x x c b ey ex tanx ce c ey d none of these ex tanx x ce dy dx sec x 2xe x tan x 2yey2 x is

Statistics
ProbabilityMatch the following histogram to the appropriate boxplot Match each histogram to the boxplot that represents the same data set a 1 2 3

Statistics
Statistics300 150 250 100 0 0 3 1 1 0 A E 2 0 150 50 250 100 TTTT 0 1 1 4 1 B F 8 3 14 9 O 250 100 FTTT 50 0 C 150 50 200 100 150 O STT T 5 T 15 4 hich histogram s are approximately symmetric Select TRUE or FALSE 25

Statistics
ProbabilityIn 2018 the Boston Red Sox defeated the Los Angeles Dodges to become the champions of Major League Baseball Following are the salaries in millions of dollars of the players on each of these teams Red Sox 31 00 23 75 21 00 20 00 15 00 12 00 8 55 3 58 2 85 2 48 1 60 1 15 0 72 0 62 0 56 0 56 0 56 0 56 0 56 0 56 0 56 Dodgers 31 00 20 00 18 00 18 00 17 90 5 00 4 50 3 00 3 00 2 10 0 71 0 61 0 60 0 58 0 57 0 57 0 56 0 56 0 56 0 56 0 56 Find the five number summary of the Red Sox salaries 5 00 4 30 0 58 0 56 3 73 3 50 0 58 0 57 0 56

Statistics
Statistics6 Find the mean of the sample data set 7 939 9 903 14 003 3 461 5 487 11 234 16 485 11 144 8 943 Round your answer to the nearest hundredths Answer Continue Reset answer

Statistics
StatisticsThe following data represent crime rates per 1000 population for a random sample of 46 Denver neighborhoods t 63 2 36 3 26 2 53 2 65 3 32 0 65 0 66 3 68 9 35 2 25 1 32 5 54 0 42 4 77 5 123 2 66 3 92 7 56 9 77 1 27 5 69 2 73 8 71 5 58 5 67 2 78 6 33 2 74 9 45 1 132 1 104 7 63 2 59 6 75 7 39 2 69 9 87 5 56 0 154 2 85 5 77 5 84 7 24 2 37 5 41 1 USE SALT a Use a calculator with mean and sample standard deviation keys to find the sample mean x and sample standard deviation s Round your answers to four decimal places X crimes per 1000 people crimes per 1000 people S b Let us say the preceding data are representative of the population crime rates in Denver neighborhoods Compute an 80 confidence interval for the population mean crime rate for all Denver neighborhoods Round your answers to one decimal place lower limit crimes per 1000 people upper limit crimes per 1000 people c Suppose you are advising the police department about police patrol assignments One neighborhood has a crime rate of 58 crimes per 1000 population Do you think that this rate is below the average population crime rate and that fewer patrols could safely be assigned to this neighborhood Use the confidence interval to justify your answer OYes The confidence interval indicates that this crime rate is below the average population crime rate OYes The confidence interval indicates that this crime rate does not differ from the average population crime rate O No The confidence interval indicates that this crime rate is below the average population crime rate O No The confidence interval indicates that this crime rate does not differ from the average population crime rate d Another neighborhood has a crime rate of 75 crimes per 1000 population Does this crime rate seem to be higher than the population average Would you recommend assigning more patrols to this neighborhood Use the confidence interval to justify your answer OYes The confidence interval indicates that this crime rate does not differ from the average population crime rate OYes The confidence interval indicates that this crime rate is higher than the average population crime rate No The confidence interval indicates that this crime rate is higher than the average population crime rate O No The confidence interval indicates that this crime rate does not differ from the average population crime rate e Compute a 95 confidence interval for u the population mean crime rate for all Denver neighborhoods Round your answers to one decimal place

Statistics
ProbabilityConsider n independent and identically distributed random variables from a distribution having the probability mass function P X x p 1 p x 1 1 where 0 p 1 i ii Show that C x xn 1X c is a best critical region for testing the null hypothesis Ho p 1 2 against the alternative hypothesis H p 3 4 Suppose n 121 and we require C in part i to have size 0 01 Using R attach R codes plot the power function K p for p 1 2

Statistics
Statistics0 0 T T 1 0 A 2 0 14 8 50 TTTTT 150 G O 8 O 5 Which histogram s are skewed to the left Select TRUE or FALSE 16 D 4 26

Statistics
StatisticsA student survey asked the following two questions What gender do you identify with and In general are you satisfied or dissatisfied with the way things are going in your personal life at this time Here is a two way table of the results GENDER Female Male Other Total Dissatisfied 96 64 6 166 Satisfied 236 147 1 384 Total 332 211 7 550 Given the group of students that are satisfied with the way things are going in their personal lives what percent are female

Statistics
StatisticsAll random samples of size n 9 are selected from a normal population with u 55 and o 10 and the mean is computed for each sample Then all the possible samples of size n 36 are selected from the same population and the mean is computed for each sample Which statement below is true The distribution of sample means for samples of n 9 is less variable than the distribution of sample means for n 36 The distribution of sample means for n 9 has a smaller mean than the distribution of sample means for n 36 The distribution of sample means for n 36 has a smaller mean than the distribution of sample means for n 9 The distribution of sample means for samples of n 36 is less variable than the distribution of sample means for n 9

Statistics
Statisticsthe per Und pies for Inventory is weighted average inventory pricing The Boswell Corporation began its fiscal year with an inventory of 156 units valued at 10 55 per unit During the year it made the purchases listed in the following table Date At the end of the year 239 units remained in inventory Determine the weighted average cost of the units purchased during the year A 10 67 B 10 66 C 25 74 Units Purchased i 300 10 Feb 3 Jun 1000 23 Aug 500 Unit Cost 10 86 10 47 10 97

Statistics
StatisticsFor this problem carry at least four digits after the decimal in your calculations Answers may vary slightly due to rounding In a survey of 1000 large corporations 242 said that given a choice between a job candidate who smokes and an equally qualified nonsmoker the nonsmoker would get the job USE SALT a Let p represent the proportion of all corporations preferring a nonsmoking candidate Find a point estimate for p b Find a 0 95 confidence interval for p Round your answers to three decimal places lower limit upper limit c As a news writer how would you report the survey results regarding the proportion of corporations that would hire the equally qualified nonsmoker O Report the margin of error O Report p O Report p along with the margin of error What is the margin of error based on a 95 confidence interval Round your answer to three decimal places

Statistics
StatisticsFor which of the following scatterplots is the correlation coefficient an appropriate summary a b c 4

Statistics
StatisticsHow much does a sleeping bag cost Let s say you want a sleeping bag that should keep you warm in temperatures from 20 F to 45 F A random sample of prices for sleeping bags in this temperature range is given below Assume that the population of x values has an approximately normal distribution 75 105 95 60 100 75 USE SALT 90 95 105 60 110 120 30 23 100 110 95 90 60 70 a Use a calculator with mean and sample standard deviation keys to find the sample mean price x and sample standard deviation s Round your answers to four decimal places X S b Using the given data as representative of the population of prices of all summer sleeping bags find a 90 confidence interval for the mean price of all summer sleeping bags Round your answers to two decimal places lower limit upper limit

Statistics
Statistics12 Canadian Industries tracks the annual sales from each of its three divisions to help evaluate performance and plan budgeting for the following year Calculate the difference in market growth for mining over the total for all three divisions Mining Transportation Retail A 3 62 B 4 25 C 3 92 D 4 17 E 5 25 2017 1 25 million 3 5 million 1 2 million 2018 1 45 million 4 55 million 1 15 million

Statistics
StatisticsThe following data represent petal lengths in cm for independent random samples of two species of iris Petal length in cm of Iris virginica x n 36 5 2 5 8 6 3 6 1 5 1 5 5 5 3 5 5 6 9 5 6 4 8 5 7 5 3 5 3 S x 4 8 Petal length in cm of Iris setosa X n 38 1 6 1 8 1 4 1 5 1 5 1 6 1 4 1 1 1 5 2 S 1 6 5 4 5 1 5 1 1 4 1 4 1 3 1 2 1 3 1 7 USE SALT 5 9 1 5 5 2 5 7 5 4 1 3 1 6 1 9 1 5 1 5 5 0 4 5 4 9 6 0 1 4 1 6 6 4 5 3 5 5 1 4 1 2 4 8 6 1 1 0 1 7 1 5 1 4 6 7 1 7 1 9 1 6 1 2 5 6 5 7 5 1 4 9 a Use a calculator with mean and standard deviation keys to calculate x S X2 and s Round your answers to four decimal places 1 6 1 4 1 9 1 5 b Let be the population mean for x and let be the population mean for x Find a 99 confidence interval for H H Round your answers to two decimal places lower limit upper limit c Explain what the confidence interval means in the context of this problem Does the interval consist of numbers that are all positive all negative of different signs At the confidence is the population mean petal length of Iris virginica longer than that of Iris setosa peritive numbers we can say that the mean petal length of Iris virginica is longer

Statistics
StatisticsOver the past several months an adult patient has been treated for tetany severe muscle spasms This condition is associated with an average total calcium level below 6 mg dl Recently the patient s total calcium tests gave the following readings in mg dl Assume that the population of x values has an approximately normal distribution X 9 10 S 8 40 10 50 9 50 9 40 9 80 USE SALT a Use a calculator with mean and sample standard deviation keys to find the sample mean reading x and the sample standard deviation s Round your answers to four decimal places mg dl mg dl 10 00 9 90 11 20 12 10 b Find a 99 9 confidence interval for the population mean of total calcium in this patient s blood Round your answer to two decimal places lower limit upper limit mg dl mg dl c Based on your results in part b do you think this patient still has a calcium deficiency Explain Yes This confidence interval suggests that the patient may still have a calcium deficiency O Yes This confidence interval suggests that the patient no longer has a calcium deficiency No This confidence interval suggests that the patient may still have a calcium deficiency No This confidence interval suggests that the patient no longer has a calcium deficiency

Statistics
StatisticsA sample of n 36 scores is selected from a normal population with 75 and o 7 The probability of obtaining a sample mean greater than M 73 is p 0 9056 True False