Statistics Questions
The best high school and college tutors are just a click away, 24×7! Pick a subject, ask a question, and get a detailed, handwritten solution personalized for you in minutes. We cover Math, Physics, Chemistry & Biology.

Statistics
StatisticsA researcher administers a treatment to a sample from a population with a mean of u 60 If the treatment is expected to decrease scores then the null hypothesis would state that 60 True False

Statistics
ProbabilityA sample of n 9 scores is randomly selected from a normal population with u 80 and o 9 If the sample mean is M 83 then the corresponding z score will indicate that a sample mean of M 83 is above 80 by 3 standard error units True False

Statistics
StatisticsSamples of n 36 scores are selected from a population If the distribution of sample means has an expected value of HM 30 and a standard error of y 4 what is the mean and the standard deviation for the population 4 30 and 24 u 30 and o 8 40 and o 4 u 150 and o 18

Statistics
ProbabilityAt wind speeds above 1000 centimeters per second cm sec significant sand moving events begin to occur Wind speeds below 1000 cm sec deposit sand and wind speeds above 1000 cm sec mow sand to new locations The cyclic nature of wind and moving sand determines the shape and location of large dunes At a test site the prevailing direction of the wind did not change noticeably However the velocity did change Sixty three wind speed readings gave an average velocity of x 1075 cm sec Based on long term experience o can be assumed to be 285 cm sec a Find a 95 confidence interval for the population mean wind speed at this site Round your answers to the nearest whole number lower limit cm sec cm sec upper limit b Does the confidence interval indicate that the population mean wind speed is such that the sand is always moving at this site Explain O No This interval indicates that the population mean wind speed is such that the sand may not always be moving at this site O Yes This interval indicates that the population mean wind speed is such that the sand may not always be moving at this site O Yes This interval indicates that the population mean wind speed is such that the sand is always moving at this site O No This interval indicates that the population mean wind speed is such that the sand is always moving at this site

Statistics
StatisticsA sample of n 16 scores is selected from a normal population with 30 and o 9 The probability of obtaining a sample mean greater than 26 is equal to the probability of obtaining a z score greater than z 1 60 True False

Statistics
StatisticsA sample is obtained from a normal population with o 20 If the sample mean has a standard error of 10 points then the sample size is n 4 True False

Statistics
ProbabilityThis table shows values that represent a quadratic function 012345 y 1 2 5 10 17 26 6 37 What is the average rate of change for this quadratic function for the interva from x 1 to x 3

Statistics
ProbabilityA random sample of n 49 scores is obtained from a population with o 14 If this specific sample mean is 4 50 points greater than the population mean what is the z score for this particular sample mean z 2 25 z 2 00 z 1 50 This cannot be determined with the provided information

Statistics
StatisticsFor a normal population a sample of n 9 scores has a standard error of 10 For the same population a sample of n 25 scores would have a standard error of M 10 0 4 6 M 9 M 5

Statistics
StatisticsConsider a normal population with u 50 and o 6 A sample size of at least which size needs to be obtained in order to achieve a standard error of oy 2 or less On 16 n 9 O On 3 n 4

Statistics
Statistics7 3 Section Ex A population has mean 25 and standard deviation o 3 Find and o for samples of size n 25 Round your answers to on x decimal place if needed PI

Statistics
ProbabilitySuppose a simple random sample of size n 75 is obtained from a population whose size is N 25 000 and whose population proportion with a specified characteristic is p 0 2 Complete parts a through c below Determine the mean of the sampling distribution of p HA 0 2 Round to one decimal place as needed p Determine the standard deviation of the sampling distribution of p 0 0 046188 Round to six decimal places as needed p b What is the probability of obtaining x 18 or more individuals with the characteristic That is what is P p 0 24 P p 0 24 0 1922 Round to four decimal places as needed c What is the probability of obtaining x 9 or fewer individuals with the characteristic That is what is P p 0 12 Pp 0 12 Round to four decimal places as needed

Statistics
ProbabilityAccording to a study conducted by a statistical organization the proportion of people who are satisfied with the way things are going in their lives is 0 74 Suppose that a random sample of 100 people is obtained Complete parts a through e below D fact that people may not be responding to the question truthfully The sample proportion p is a random variable because the value of p varies from sample to sample The variability is due to the fact that different people feel differently regarding their satisfaction c Describe the sampling distribution of p the proportion of people who are satisfied with the way things are going in their life Be sure to verify the model requirements Since the sample size is no more than 5 of the population size and np 1 p 19 240 10 the distribution of p is approximately normal with 0 740 and x 0 044 P P Round to three decimal places as needed d In the sample obtained in part a what is the probability that the proportion who are satisfied with the way things are going in their life exceeds 0 77 The probability that the proportion who are satisfied with the way things are going in their life exceeds 0 77 is Round to four decimal places as needed

Statistics
Probability0 13 2 15 30 34 13 13 59 20 10 A score of 315 is 0 34 13 10 13 59 2 15 20 30 Use the figure to help you answer the following questions The National Assessment of Educational Progress NAEP is a nationwide assessment of students proficiency in nine subjects mathematics reading writing science the arts civics economics geography and US history The main NAEP assessments are conducted annually on samples of students from grades 4 8 and 12 0 13 In 2003 the mathematics scores for male students had a mean of 278 with a standard deviation of 37 Assume that these scores are normally distributed with the given mean and standard deviation A score of 167 is below the mean while a score of 389 is means that the percentage of male students with scores between 167 and 389 is You can infer that 97 72 of the male students have scores above above the mean This above the mean As a result the percentage of male students with scores below 315 is

Statistics
StatisticsThe data to the right represent the number of chocolate chips per cookie in a random sample of a name brand and a store brand Complete parts a to c below S FRE 10 20 30 40 S 10 20 30 40 b Does there appear to be a difference in the number of chips per cookie A Yes The store brand appears to have more chips per cookie OB Yes The name brand appears to have more chips per cookie OC No There appears to be no difference in the number of chips per cookie in conclusion 10 S 20 30 40 Name Brand 24 29 32 Full data set Store Brand 16 18 31 32 28 22 25 25 33 24 26 26 28 35 27 21 28 22 23 31 20 23 20 23 15

Statistics
StatisticsFind the value of Za 0 15 The value of Z0 15 is Round to two decimal places as needed

Statistics
StatisticsA certain stimulus administered to each of the 12 patients resulted in the following increase of blood pressure 5 2 8 1 3 0 2 1 5 0 4 and 8 Can it be concluded that the stimulus will in general be accompanied by an increase in blood pressure Given for 11 d f toos 2 2 0 05 Solution Here the increments in blood pressure is denoted by d Total 1 1 d 5 2 8 d 25 4 64 mple size n 12 30 3 9 0 2 0 4 6 0 4 1 25 0 16 36 31 185

Statistics
Statisticsthe random variable X is normally distributed with mean 49 and standard deviation o 8 Compute the probability Be sure to draw a normal curve with the area corresponding to the probability shaded P X 46 Which of the following shaded regions corresponds to P X 46 S OA 46 49 X G P X 46 Round to four decimal places as needed OB 46 49 P o 46 49

Statistics
StatisticsFill in the blanks to complete the following statements a For the shape of the distribution of the sample proportion to be approximately normal it is required that np 1 p 2 b Suppose the proportion of a population that has a certain characteristic is 0 65 The mean of the sampling distribution of p from this population is P This is a reading assessment question Be certain of your answer because you only get one attempt on this question 2 a For the shape of the distribution of the sample proportion to be approximately normal it is required that np 1 P Type an integer or a decimal

Statistics
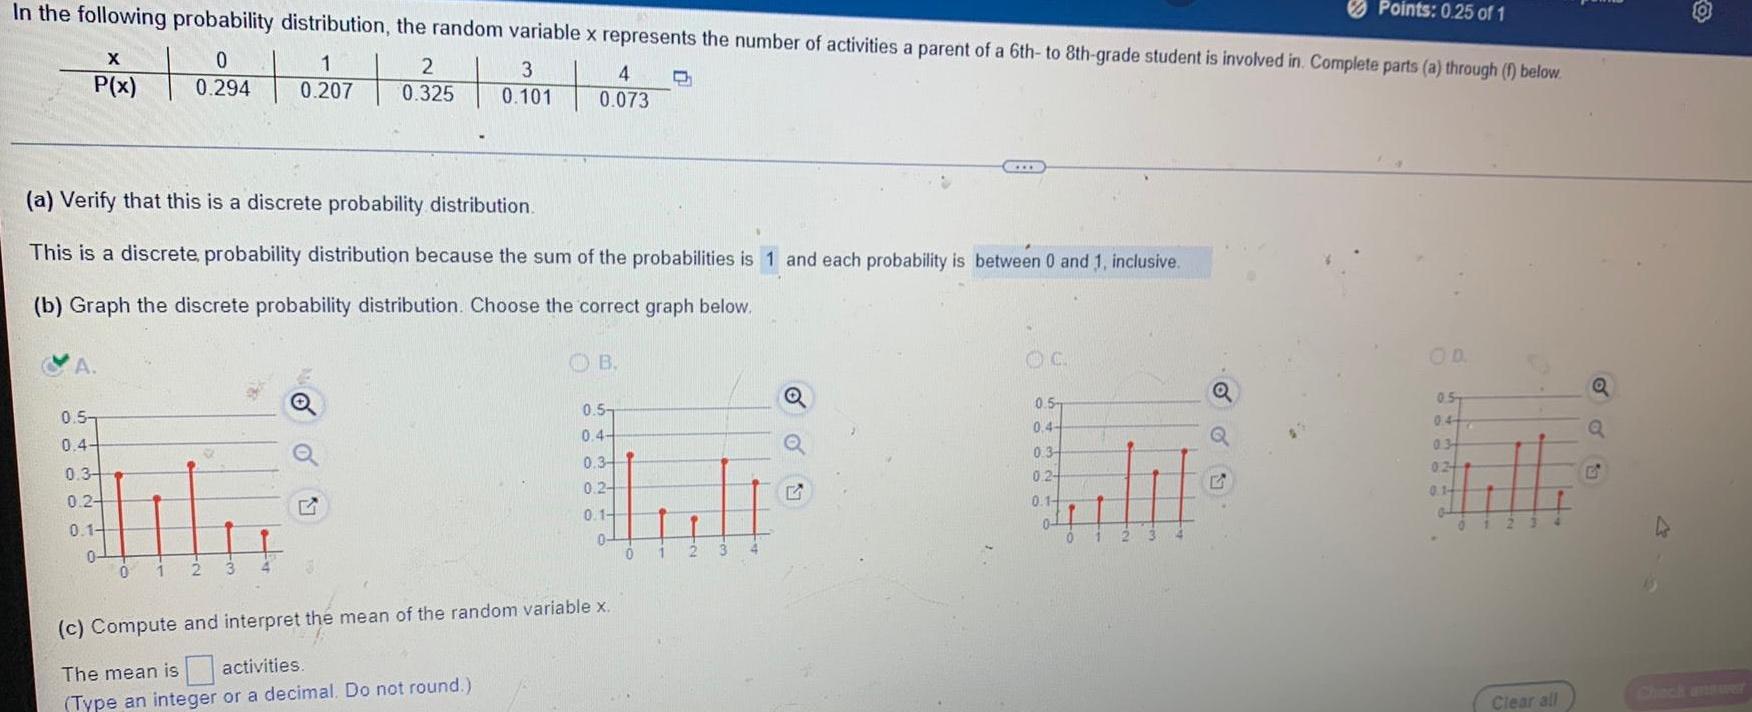
StatisticsPoints 0 63 of 1 In the following probability distribution the random variable x represents the number of activities a parent of a 6th to 8th grade student is involved in Complete parts a through f below 3 X 0 1 P X 0294 0207 0 325 0 101 4 0 073 c Compute and interpret the mean of the random variable x The mean is 1 452 activities Type an integer or a decimal Do not round Which of the following interpretations of the mean is correct C OA The observed value of an experiment will be equal to the mean of the random variable in most experiments OB As the number of experiments decreases the mean of the observations will approach the mean of the random variable C The observed value of an experiment will be less than the mean of the random variable in most experiments D As the number of experiments increases the mean of the observations will approach the mean of the random variable d Compute the standard deviation of the random variable x The standard deviation is activities Round to one decimal place as needed S

Statistics
ProbabilityOne question from a survey was How many credit cards do you currently have The results of the survey are provided Complete parts a through g below Click the icon to view the survey results a Determine the mean number of credit cards based on the raw data The mean is 3 06 credit cards Type an integer or a decimal Do not round b Determine the standard deviation number of credit cards based on the raw data The standard deviation is 1 836 credit cards Round to three decimal places as needed c Determine a probability distribution for the random variable X the number of credit cards issued to an individual Credit Card Survey Results 3232523 2 P 6222225 10 2382933 3 3 3 2 4 42 2 3822145 337222 1542339 3232372 5132423 3423216 5 W 5 0 CI X x of cards P x x of cards P x 6 2 7 10 8 9 10 Type integers or decimals Do not round 1 345 Clear all UDU

Statistics
StatisticsThe random number generator on calculators randomly generates a number between 0 and 1 The random variable X the number generated follows a uniform probability distribution a Identify the graph of the uniform density function b What is the probability of generating a number between 0 37 and 0 72 c What is the probability of generating a number greater than 0 82 ADensity 1 24 14 0 84 0 6 0 4 0 2 0 0 0 2 0 4 0 6 0 8 1 1 2 a ON b The probability is 0 35 Simplify your answer c The probability is Simplify your answer B 1 24 1 0 8 0 6 0 4 0 24 Density 0 0 0 2 0 4 0 6 0 8 1 1 2 OC A Density 6 0 8 0 6 0 0 2 0 4 0 6 0 8 1 12 1 2 0 4 0 2 Q

Statistics
StatisticsPoints 0 5 of 1 In the following probability distribution the random variable x represents the number of activities a parent of a 6th to 8th grade student is involved in Complete parts a through f below 0 1 3 0 294 0 207 0 101 X P x 2 0 325 4 0 073 0 1 2 3 4 c Compute and interpret the mean of the random variable x The mean is 1 452 activities Type an integer or a decimal Do not round Which of the following interpretations of the mean is correct C 0 1 2 3 4 www 2 3 4 OA The observed value of an experiment will be equal to the mean of the random variable in most experiments OB As the number of experiments decreases the mean of the observations will approach the mean of the random variable C The observed value of an experiment will be less than the mean of the random variable in most experiments D As the number of experiments increases the mean of the observations will approach the mean of the random variable d Compute the standard deviation of the random variable x The standard deviation is activities Round to one decimal place as needed
Statistics
ProbabilityIn the following probability distribution the random variable x represents the number of activities a parent of a 6th to 8th grade student is involved in Complete parts a through 1 below 0 2 3 PX 0 294 0207 0 325 0 101 P x A 0 5 0 4 0 3 0 24 0 1 0 a Verify that this is a discrete probability distribution This is a discrete probability distribution because the sum of the probabilities is 1 and each probability is between 0 and 1 inclusive b Graph the discrete probability distribution Choose the correct graph below 0 1 2 3 4 0 073 13 OB 0 5 0 4 0 34 1 0 2 0 1 0 P c Compute and interpret the mean of the random variable x The mean is activities Type an integer or a decimal Do not round 01 2 3 Q G OC 0 5 0 4 0 3 0 24 0 1 n 2 Points 0 25 of 1 Q Q OD 0 5 047 03 024 0 1 0 Clear all Q Q G

Statistics
StatisticsThe probability distribution of the random variable X represents the number of hits a baseball player obtained in a game for the 2012 baseball season X 0 1 2 3 4 5 S P x 0 1674 0 3428 0 2908 0 1497 0 0379 0 0114 The probability distribution was used along with statistical software to simulate 25 repetitions of the experiment 25 games The number of hits was recorded Approximate the mean and standard deviation of the random var X based on the simulation The simulation was repeated by performing 50 repetitions of the experiment Approximate the mean and standard deviation of the random variable Compare your results to the theoretical mean ar standard deviation What property is being illustrated Click the icon to view the data tables Compute the theoretical mean of the random variable X for the given probability distribution Hx 1 582 hits Round to three decimal places as needed Compute the theoretical standard deviation of the random variable X for the given probability distribution x 1 114 hits Round to three decimal places as needed Approximate the mean of the random variable X based on the simulation for 25 games Xhits Round to three decimal places as needed CIC Data Tables Table of the numbers of hits for 25 games C 3 1 4 10 1 1 3 5 0 1142 3 2 1 2 3 1 0 1 12 1 Table of the numbers of hits for 50 games 9 3 1 4 1 0 1 1 3 50 1 1 4 2 3 2 1 23 1 01 2 2 2 1 12102301 1 1 1 2 0 1 0 3 2 2 2 2003 1 X

Statistics
Probabilitye Left 0 04 24 Swimming pool drownings 140 drownings 120 drownings 100 drownings 80 drownings Chantel Childress Attempt 1 Number of people who drowned by falling into a pool correlates with Films Nicolas Cage appeared in 1999 1990 2000 2000 2001 2001 2002 2002 2003 2003 2004 2004 2005 Use this data to answer the following questions 2005 2006 2006 Nicholas Cage Swimming pool drownings 2007 2007 2008 2008 2009 2009 6 films 4 films 2 films O films Question 25 3 03 points Use this data to find the correlation between number of deaths from drowning by falling into a pool and number of Nicholas Cage movies THREE DECIMAL PLACES x xxx Nicholas Cage

Statistics
ProbabilityFor a multistate lottery the following probability distribution represents the cash prizes of the lottery with their corresponding probabilities Complete parts a through c below x cash prize Grand prize 200 000 10 000 100 7 4 3 0 P x 0 00000000504 0 00000012 0 000001686 0 000148622 0 004959544 0 006178738 0 01820095 0 97051033496 a If the grand prize is 17 000 000 find and interpret the expected cash prize If a ticket costs 1 what is your expected profit from one ticket The expected cash prize is S Round to the nearest cent as needed

Statistics
ProbabilityBody Mass Index of Young Men A set of examples in our textbook assumed that the body mass index BMI of all American young men follows a Normal distribution with standard deviation o 11 6 kg m2 How large a sample would be needed to estimate the mean BMI u in this population to within 1 1 with 95 confidence 428 427 21 441

Statistics
ProbabilityThe accompanying data represent the ideal number of children for a random sample of 900 adults Complete parts a through d below Click the icon to view the data about ideal numbers of children a Construct a discrete probability distribution for the random variable x x of children P x 0 1 2 3 4 5 6 Round to three decimal places as needed b Draw a graph of the probability distribution Choose the correct graph below GRECSECACHE Ideal Number of Children Data x of children Frequency 9 30 520 254 67 16 4 0 1 2 3 5 Print Done X

Statistics
Statisticsnying data represent the ideal number of children for a random sample of 900 adults Complete parts a through d below Click the icon to view the data about ideal numbers of children NUITIVE VER c Compute and interpret the mean of the random variable X The mean is children Round to one decimal place as needed Which of the following interpretations of the mean is correct HUTUS VIH The standard deviation is children Round to one decimal place as needed HUNDE UND OA If many adults were surveyed one would expect the mean ideal number of children to be the mean of the random variable OB The observed ideal number of children will be equal to the mean ideal number of children for most adults OC The observed ideal number of children will be less than the mean ideal number of children for most adults OD If any number of adults were surveyed one would expect the mean ideal number of children to be the mean of the random variable d Compute the standard deviation of the random variable X Ideal Number of Children Data x of children Frequency 9 30 520 254 67 16 4 0 1 2 3 4 5 6 Print Done X

Statistics
StatisticsIn a recent poll a random sample of adults in some country 18 years and older was asked When you see an ad emphasizing that a product is Made in our country are you more likely to buy it less likely to buy it or neither more nor less likely to buy it The results of the survey by age group are presented in the following contingency table Complete parts a through c Purchase likelihood 18 34 35 44 45 54 55 Total O More likely 1379 74 Less likely 201 378 395 405 24 6 28 16 211 176 111 595 599 532 Neither more nor less likely 281 Total 506 779 2232 a What is the probability that a randomly selected individual is at least 55 years of age given the individual is less likely to buy a product emphasized as Made in our country The probability is approximately Round to three decimal places as needed b What is the probability that a randomly selected individual is less likely to buy a product emphasized as Made in our country given the individual is at least 55 years of age The probability is approximately Round to three decimal places as needed c Are 18 to 34 year olds more likely to buy a product emphasized as Made in our country than individuals in general OYes more likely O No less likely Maxt

Statistics
Statistics16 26 17 17 17 27 18 28 18 28 27 27 19 33 19 36 19 48 20 49 20 20 21 21 22 22 22 22 24 Class Limits

Statistics
ProbabilityA police officer randomly selected 585 police records of larceny thefts The accompanying data represent the number of offenses for various types of larceny thefts a Construct a probability model for type of larceny theft b Are purse snatching larcenies unusual c Are motor vehicle accessory larcenies unusual Click the icon to view the table OA Yes because there were 9 cases of purse snatching larcenies in the randomly selected records OB No because the probability of an unusual event is 0 O C Yes because P purse snatching 0 05 O D Yes because P purse snatching 0 5 c Choose the correct answer below OA No because P motor vehicle accessory larcenies 0 05 OB No because the probability of an unusual event is 0 OC No because there were 71 cases of motor vehicle accessory larcenies larcenies in the randomly selected records OD Yes because P motor vehicle accessory larcenies 0 5 Data table Type of Larceny Theft Pocket picking Purse snatching Shoplifting From motor vehicles Motor vehicle accessories Bicycles From buildings From coin operated machines Print Number of Offenses 8 Done 9 106 221 71 46 114 10

Statistics
StatisticsData AGes 16 22 49 17 22 17 24 17 24 17 24 18 25 25 18 19 26 19 26 19 27 20 27 20 27 20 28 1 28 133 2 BC mean 24 32 Median 22 Mode 22 1 Which measure is the best representation of the age of a typical Student in our Class P why

Statistics
StatisticsScatter Plot Here How many texts did you receive in the last 24 hours vs How many texts did you send in the last 24 hours How many texts did you receive in t How many texts did you receive in the last 24 hours 400 300 200 100 M 1 71 x 9 33 R 0 761 50 100 150

Statistics
Probabilitya Mean b Median c Mode 24 32 22 22 2 Which measure above is the best representation of the age of a typical student in our class Why

Statistics
ProbabilityTe Gata in the following table show the association between cigar smoking and death from cancer for 131 530 men Note current cigar smoker means cigar smoker at time of death Click the icon to view the table a If an individual is randomly selected from this study what is the probability that he died from cancer b If an individual is randomly selected from this study what is the probability that he was a current cigar smoker c If an individual is randomly selected from this study what is the probability that he died from cancer and was a current cigar smoker d If an individual is randomly selected from this study what is the probability that he died from cancer or was a current cigar smoker a P died from cancer Round to three decimal places as needed b P current cigar smoker Round to three decimal places as needed c P died from cancer and current cigar smoker Round to three decimal places as needed d P died from cancer or current cigar smoker Round to three decimal places as needed OCEED Data table Never smoked cigars Former cigar smoker Current cigar smoker Died from Cancer 592 85 154 Did Not Die from Cancer O 119 657 5 261 5 781 X

Statistics
ProbabilityWhat are the two requirements for a discrete probability distribution Choose the correct answer below Select all that apply OA P x 1 B P x 0 C 0 P x 1 D 0 P x 1

Statistics
ProbabilityA university conducted a survey of 364 undergraduate students regarding satisfaction with student government Results of the survey are shown in the table by class rank Complete parts a through d below Click the icon to view the table a If a survey participant is selected at random what is the probability that he or she is satisfied with student government P satisfied Round to three decimal places as needed b If a survey participant is selected at random what is the probability that he or she is a junior P junior Round to three decimal places as needed c If a survey participant is selected at random what is the probability that he or she is satisfied and a junior P satisfied and junior Round to three decimal places as needed d If a survey participant is selected at random what is the probability that he or she is satisfied or a junior GELED P satisfied or junior Round to three decimal places as needed Data table Satisfied Neutral Not satisfied Total Freshman 58 23 17 98 Sophomore Junior 64 54 11 14 10 88 Print 20 85 Done Senior 58 10 25 93 Total 234 58 72 364 C X

Statistics
Statistics58 A barber measures hair lengths for a random sample of 100 of his customers and gathers data on the growth rates of their hair The data are plotted in the histogram below 0 96 104 1 12 1 20 1 28 1 36 Growth rate cm month Which of the values below is closest to the standard deviation of the 100 values A 0 008 B 0 01 C 0 03 D 0 08 F 1 16

Statistics
Probabilityuniversity conducted a survey of 401 undergraduate students regarding satisfaction with student government Results of the survey are shown in the table by class rank Complete parts a through d below Click the icon to view the table a If a survey participant is selected at random what is the probability that he or she is satisfied with student government P satisfied Round to three decimal places as needed b If a survey participant is selected at random what is the probability that he or she is a junior P junior Round to three decimal places as needed c If a survey participant is selected at random what is the probability that he or she is satisfied and a junior P satisfied and junior Round to three decimal places as needed d If a survey participant is selected at random what is the probability that he or she is satisfied or a junior P satisfied or junior Round to three decimal places as needed Data table Satisfied Neutral Not satisfied Total Freshman Sophomore 53 Sophomore 51 29 19 101 Print 19 25 95 Junior 62 17 18 97 Done Senior 63 15 30 108 Total 229 80 92 401 X

Statistics
StatisticsD Consider the three distributions below 10 12 14 16 18 20 3 6 9 12 15 17 Distribution L Distribution M Order the distributions from least to greatest in terms of the proportion of data less than the mean A M L N B N L M C M N L 12 16 20 24 28 32 Distribution N D N M L E L N M

Statistics
StatisticsA university conducted a survey of 401 undergraduate students regarding satisfaction with student government Results of the survey are shown in the table by class rank Complete parts a through d below Click the icon to view the table a If a survey participant is selected at random what is the probability that he or she is satisfied with student government P satisfied 0 571 Round to three decimal places as needed b If a survey participant is selected at random what is the probability that he or she is a junior P junior 0 242 D Round to three decimal places as needed c If a survey participant is selected at random what is the probability that he or she is satisfied and a junior P satisfied and junior Round to three decimal places as needed d If a survey participant is selected at random what is the probability that he or she is satisfied or a junior Pisatisfied or junior Round to three decimal places as needed CREED N Data table Satisfied Neutral Not satisfied Total Freshman 53 29 19 101 0 4 Sophomore J nior Senior 51 62 63 19 Print 25 95 17 18 97 Done 15 30 108 Total 229 80 92 401

Statistics
Statistics4 Summary statistics for the number of campsites at public parks in a large western state are as follows Standard Minimum Q Median Q3 Maximum Mean Deviation 58 0 35 61 95 300 A IQR 60 and SD 58 B IQR 60 and SD 63 C IQR 65 and SD 58 D IQR 65 and SD 63 E IQR 62 5 and SD 60 52014 73 2 A check of the data shows that 5 had been subtracted from every value to bring the minimum to 0 for some calculation purpose If 5 is added back to every value what will now be the interquartile range and the standard deviation

Statistics
StatisticsB The student scored 2 8 points lower than the class average on the final C The student scored 2 8 standard deviations lower on the final than on the midterm D The student scored 2 8 standard deviations lower on the final than the class average on the midterm exam E The student scored 2 8 standard deviations lower on the final than the class average on the final exam 70 80 90 A 100 110 70 80 90 B 100 110 24 Given the two histograms above which of the following statements is incorrect A As long as the sample sizes are at least 30 the empirical rule applies to both sets B Both sets have roughly the same ranges C The standard deviation of set A is greater than 5 D The standard deviation of set B is greater than 5 E A lower percentage of the values in set A are at least 10 units from its mean than is the case for set B

Statistics
StatisticsStem Leaf 214 28 31334 3556779 401 46 Using the data set above determine if there are any outliers If there are no outliers enter

Statistics
StatisticsA study of phone e mail and texting communication in three time periods results in the following segmented bar chart 100 80 60 40 20 2010 2014 2018 Which of the following is greatest is close A The number of texts and e mails in 2010 B The number of e mails in 2014 Texts E mails Phone calls C The number of texts in 2018 D The above are all equal E It is impossible to answer this question without knowing the actual numbers of individual communications involved

Statistics
Statistics3 Counts of the numbers of spam messages received by a company s executives during one week are summarized below Values Under Q 7 9 10 D 4 E 6 Q Median Q3 15 5 20 How many outliers are there A 0 B 1 C 2 21 5 Values Over Q3 28 30 31

Statistics
Statistics36 If a distribution is perfectly symmetric which of must be true A The distribution is uniform B The mean and median are equal C The interquartile range is equal to twice the standard deviation D The range is twice the interquartile range E The range is equal to six times the standard deviation M 25 25 25 25 35 40 19 tiles Q 30 57

Statistics
StatisticsFind the following for the data shown 4 25 32 41 47 62 64 71 73 94 What is the percentile of the data value 71 Round to the nearest whole number Which data value represents the 20th percentile