Statistics Questions
The best high school and college tutors are just a click away, 24×7! Pick a subject, ask a question, and get a detailed, handwritten solution personalized for you in minutes. We cover Math, Physics, Chemistry & Biology.

Statistics
StatisticsFor each give a rule that describes the pattern for changing one number into the one beside it I 11 III Original 4 6 13 14 New 8 12 26 28 Original 4 6 13 14 New 16 36 169 196 Choose the rule below that describes I OA Square the number on the left B Double the number on the left C Subtract 2 from the number on the left D Triple the number on the left then subtract 2 Original 14 13 6 4 New 12 11 4 2
Statistics
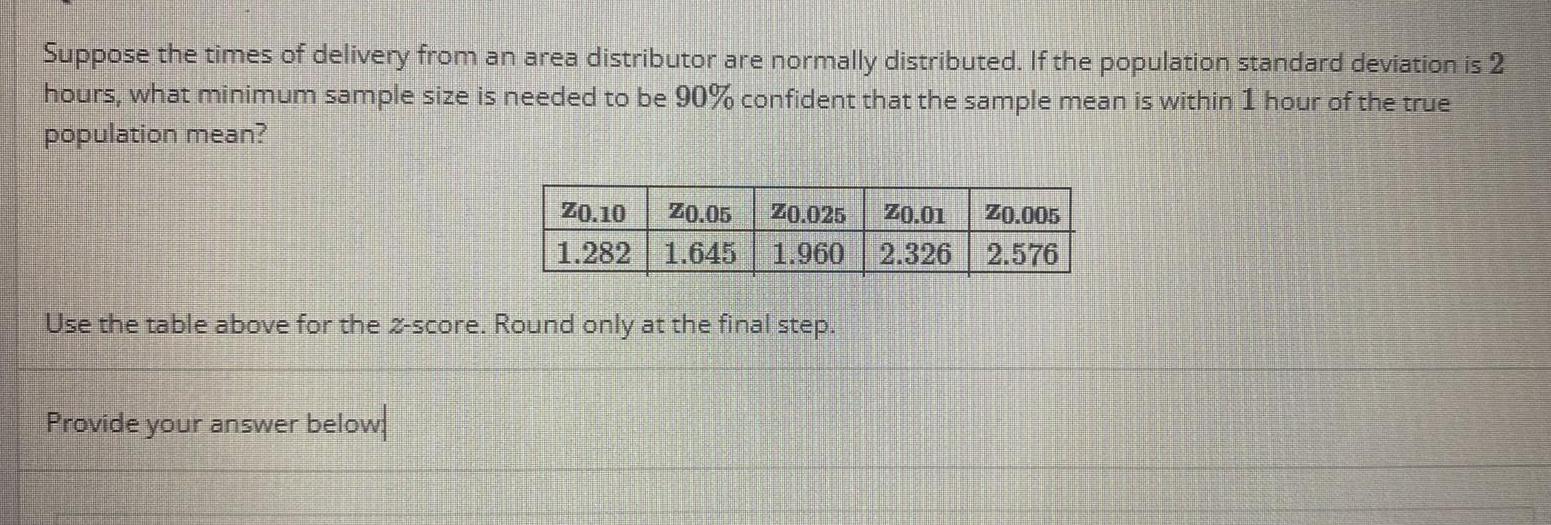
StatisticsSuppose the times of delivery from an area distributor are normally distributed If the population standard deviation is 2 hours what minimum sample size is needed to be 90 confident that the sample mean is within 1 hour of the true population mean 20 10 20 05 20 025 20 01 20 005 1 282 1 645 1 960 2 326 2 576 Use the table above for the 2 score Round only at the final step Provide your answer below
Statistics
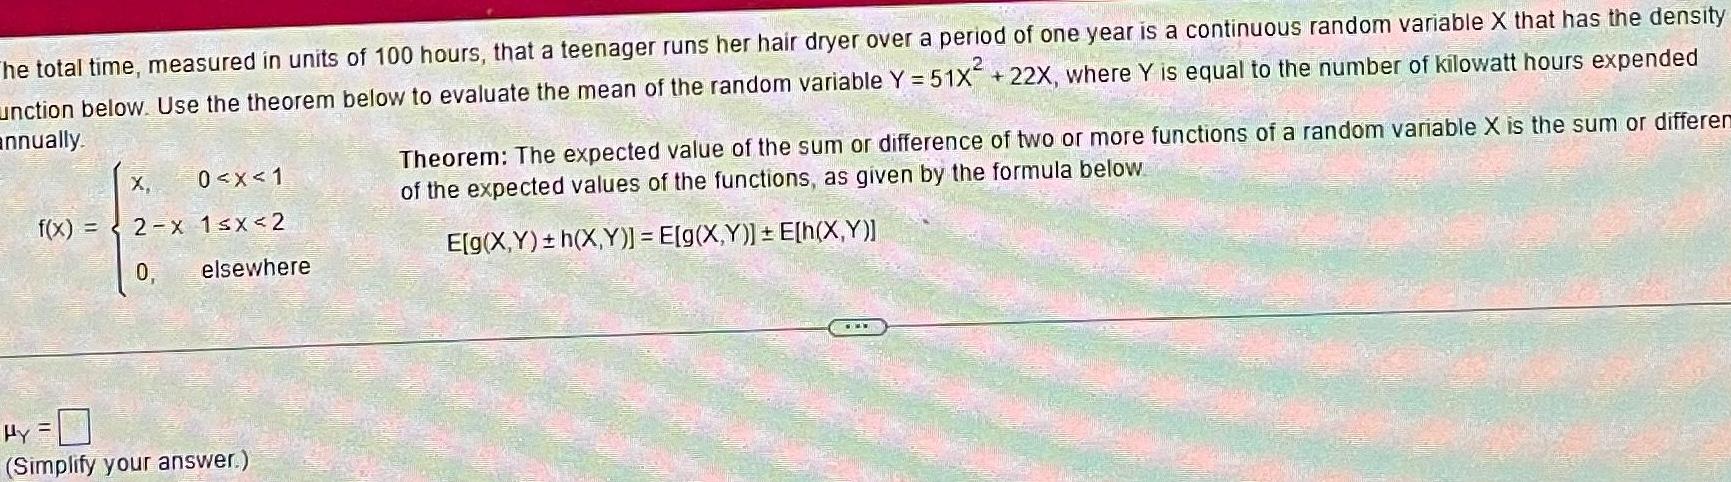
StatisticsThe total time measured in units of 100 hours that a teenager runs her hair dryer over a period of one year is a continuous random variable X that has the density unction below Use the theorem below to evaluate the mean of the random variable Y 51x 22X where Y is equal to the number of kilowatt hours expended annually X 0 x 1 f x 2 x 1 x 2 0 elsewhere Hy Simplify your answer Theorem The expected value of the sum or difference of two or more functions of a random variable X is the sum or differen of the expected values of the functions as given by the formula below E g X Y h X Y E g X Y E h X Y

Statistics
Statisticsloh A survey asked 32 145 people how much confidence they had in educational institutions The results were as follows Round your answers to four decimal places if necessary Part 1 of 3 Response Part 1 3 A great deal Some Hardly any Total Part 2 of 3 Number 10 016 17 867 4262 32 145 a What is the probability that a sampled person has either a great deal or hardly any confidence in educational institutions Send data to Excel The probability that a sampled person has either a great deal or hardly any confidence in educational institutions is 0 4442 b Assume this is a simple random sample from a population Use the Empirical Method to estimate the probability that a person has hardly any confidence in educational institutions C E LE ola
Statistics
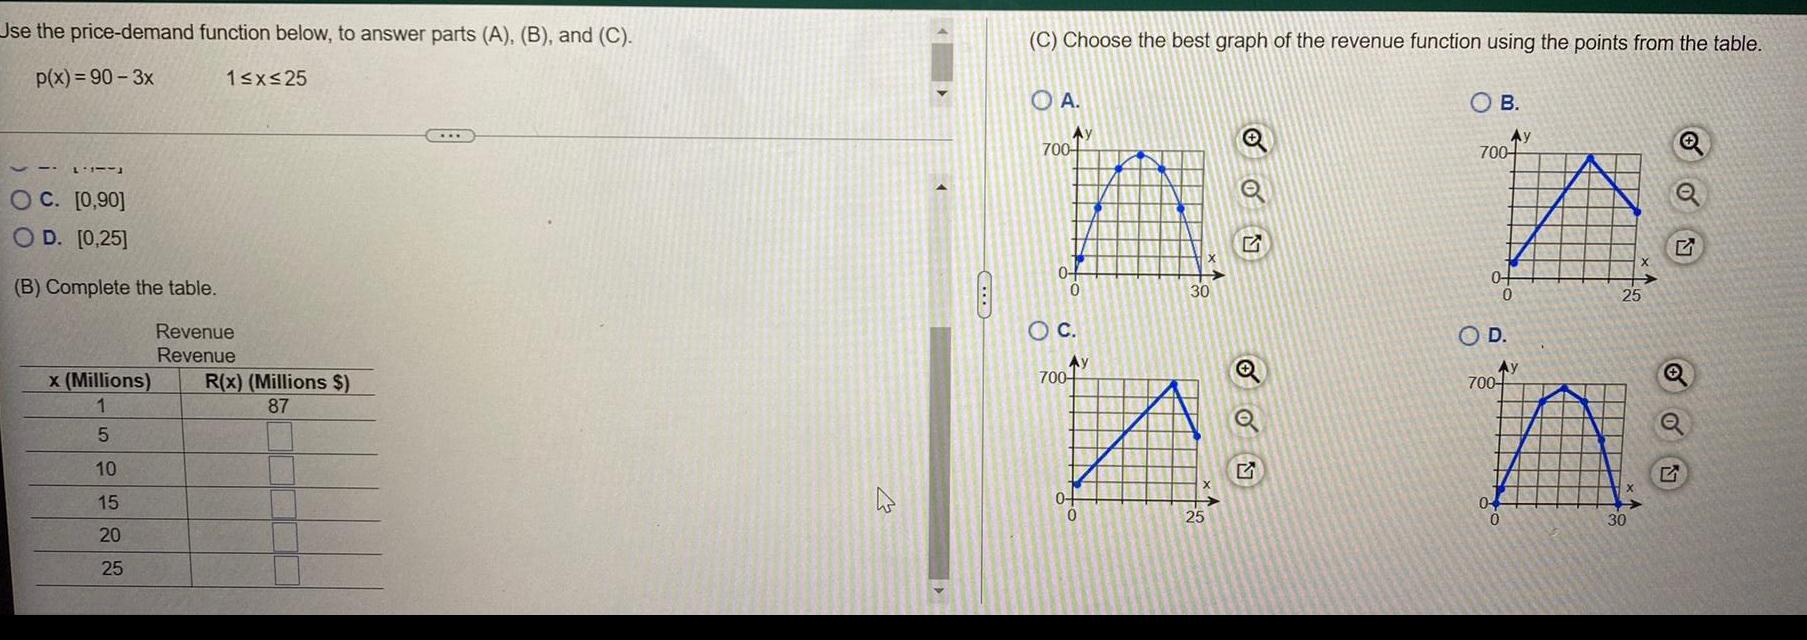
StatisticsUse the price demand function below to answer parts A B and C p x 90 3x L OC 0 90 OD 0 25 B Complete the table Revenue Revenue x Millions 1 5 150 1 x 25 20 25 R x Millions 87 C Choose the best graph of the revenue function using the points from the table OA OB Ay Ay 700 700 hi h Q X 0 0 30 0 25 0 O C 700 Ay 0 0 25 5 O D Ay 700 04 0 X 30

Statistics
Statisticse United Nations stores data about direct use of solar thermal heat around the world The following data set gives the information for direct use of solar thermal heat consumption by households Country or Area United States United States United States United States United States United States United States United States United States United States United States Commodity Transaction Year Quantity Direct use of solar thermal heat Consumption by households Direct use of solar thermal heat Consumption by households Direct use of solar thermal heat Consumption by households Direct use of solar thermal heat Consumption by households Direct use of solar thermal heat Consumption by households Direct use of solar thermal heat Consumption by households Direct use of solar thermal heat Consumption by households Direct use of solar thermal heat Consumption by households Direct use of solar thermal heat Consumption by households Direct use of solar thermal heat Consumption by households Direct use of solar thermal heat Consumption by households Direct use of solar thermal heat Consumption by households Direct use of solar thermal heat Consumption by households Direct use of solar thermal heat Consumption by households Direct use of solar thermal heat Consumption by households Direct use of solar thermal heat Consumption by households United States United States United States United States United States Unit 2014 8153 Terajoules 2013 6931 Terajoules 2012 5779 Terajoules 2011 60331 Terajoules 2010 58152 Terajoules 2009 57565 Terajoules 2008 57326 Terajoules 2007 55475 Terajoules 2006 53542 Terajoules 2005 51650 Terajoules 2004 52946 Terajoules 2003 52948 Terajoules 2002 55630 Terajoules 2001 56979 Terajoules 2000 60302 Terajoules 1999 63313 Terajoules

Statistics
StatisticsA simple random sample of 85 is drawn from a normally distributed population and the mean is found to be 146 with standard deviation of 34 Which of the following values is outside the 99 confidence interval for the population mean Use the table below to help you answer the question Confidence Level z score 90 1 645 95 1 96 Remember the margin of error ME can be determined using the formula ME S O the value of 135 because it is not greater than 136 5 O the value of 137 because it is greater than 136 5 O the value of 138 because it is less than 153 2 O the value of 154 because it is greater than 153 2 99 2 58

Statistics
StatisticsA school district has a standardized test that it uses to sort students into magnet schools where the test is on a 200 point scale The superintendent s office wants to determine whether male and female students have approximately equal scores on the test Scores for a random sample of 30 male students and 30 female students are taken Assume that the population standard deviation of scores is 18 points for both male and female students and that the scores are normally distributed for both male and female students Let the scores of the male students be the first sample and let the scores of the female students be the second sample The consulting group conducts a two mean hypothesis test at the 0 10 level of significance to test if there is evidence that male and female students have different scores on average a Which answer choice shows the correct null and alternative hypotheses for this test Select the correct answer below O Hozi Ha 44 44 which is a two tailed test O Ho H H Ha H2 which is a left tailed test OHH H H1 which is a right tailed test O Hoi Ha which is a two tailed test

Statistics
StatisticsQuestion The following data set provides infromation on acres harvested and planted by year and value in the US ASPARAGUS ACRES HARVESTED 21 700 23 800 24 500 25 300 26 800 28 000 29 200 32 200 Positive linear pattern Year No pattern 2015 2014 2013 2012 2011 2010 2009 2008 Select the correct answer below Negative linear pattern 2007 2006 2005 2004 2003 2002 2001 2000 1999 1998 38 600 43 200 49 300 From the data set use the harvest data for the United States for recent years Using a calculator or statistical software find the equation for the linear regression line for 2010 to 2015 What is the pattern of the data set Negative linear pattern with deviations 61 500 58 000 66 000 70 150 77 400 75 890 74 430 ASPARAGUS ACRES PLANTED 23 500 25 800 26 800 27 800 28 400 29 200 30 700 33 700 40 900 44 700 51 700 66 000 62 000 70 500 75 150 82 800 79 590

Statistics
StatisticsThe average adult gets 7 45 hours of sleep each night with a standard deviation of 0 65 hours A pharmaceutical company developing a sleep aid is researching how much sleep the top 1 of adults get each night on average How many hours of sleep must an adult get each night to be in the top 1 if the company is only basing their initial research on the sleep habits of 30 adults Be sure to round to the nearest hundredth Use the z table below Z 0 00 0 01 0 02 0 03 0 04 0 05 0 06 0 07 0 08 0 09 1 8 0 964 0 965 0 966 0 966 0 967 0 968 0 969 0 969 0 970 0 971 1 9 0 971 0 972 0 973 0 973 0 974 0 974 0 975 0 976 0 976 0 977 2 0 0 977 0 978 0 978 0 979 0 979 0 980 0 980 0 981 0 981 0 982 2 1 0 982 0 983 0 983 0 983 0 984 0 984 0 985 0 985 0 985 0 986 2 2 0 986 0 986 0 987 0 987 0 987 0 988 0 988 0 988 0 989 0 989 2 3 0 989 0 990 0 990 0 990 0 990 0 991 0 991 0 991 0 991 0 992 2 4 0 992 0 992 0 992 0 992 0 993 0 993 0 993 0 993 0 993 0 994 2 5 0 994 0 994 0 994 0 994 0 994 0 995 0 995 0 995 0 995 0 995 Round the z score o and to two decimal places Sorry that s incorrect Try again z score 2 33

Statistics
Statistics121 456 20 000 133 451 73 989 58 359 107 065 88 164 125 222 88 663 78 838 If we remove this low valued outlier 114 900 has an outlier that is the smallest value present 89 780 134 173 we cannot tell whether the standard deviation would change or not and I don t feel like wrangling with all of the decimals involved the calculated standard deviation will be larger than it was before removing the outlier the calculated standard deviation will be smaller than it was before removing the outlier the calculated standard deviation will be the same as it was before removing the outlier

Statistics
Probabilityhow many ways can 5 oaks 2 pines and 3 maples be arranged along a property line if one does not distinguish among trees of the same kind he trees can be arranged along a property line in ways if one does not distinguish among trees of the same kind Type a whole number

Statistics
ProbabilityThe table below represents the probability density function for the random variable X Find the standard deviation of X Round the final answer to two decimal places Provide your answer below X 2 5 P X X 1 4 1 4 1 4 1 4

Statistics
StatisticsIn a gambling game a woman is paid 2 if she draws a ten or a three and 54 if she draws a jack or a six from an ordinary deck of 52 playing cards If she draws other card she loses How much should she pay to play if the game is fair If the game is fax the woman should play to play Type an integer or a decimal Round to the nearest cent as needed

Statistics
StatisticsSuppose net gain in dollars of the departments for an industry per day are normally distributed and have a known population standard deviation of 325 dollars and an unknown population mean A random sample of 20 departments is taken and gives a sample mean of 1640 dollars Find the confidence interval for the population mean with a 98 confidence level Round your answer to TWO decimal places ZO 10 Provide your answer below 1 282 20 05 1 645 You may use a calculator or the common z values above 20 025 1 960 20 01 2 326 Zo 005 2 576

Statistics
Statistics2 2 If X and Y are independent random variables with variances o 9 and oy 6 find the variance of the random variable Z 6X 2Y 3 Y 2 oz

Statistics
Statistics3 Regression Consider following data X 3 6 20 14 Y 55 55 10 15 The estimated regression equation for these data is yha 68 3x 12 40 a Compute SSE SST and SSR b Compute the coefficient of determination R square Comment on the goodness of fit

Statistics
StatisticsExplain why a statistic like 4 out of 5 dentists choose a certain brand of toothpaste could be misleading

Statistics
StatisticsAssume that the game playthrough times for a newly released puzzle game has a mean of 49 8 minutes and a standard deviation of 4 2 minutes A sample of size n 39 playthrough times is randomly selected from a gaming population Wh is the probability that the sample mean is in between 50 minutes and 51 minutes You may use a calculator or the portion of the 2 table given below Round your answers to three decimal places where appropriate z 0 00 0 01 0 02 0 03 0 04 0 05 0 06 0 07 0 08 0 09 0 3 0 618 0 622 0 626 0 629 0 633 0 637 0 641 0 644 0 648 0 652 0 40 655 0 659 0 663 0 666 0 670 0 674 0 677 0 681 0 684 0 688 0 5 0 691 0 695 0 698 0 702 0 705 0 709 0 712 0 716 0 719 0 722 0 6 0 726 0 729 0 732 0 736 0 739 0 742 0 745 0 749 0 752 0 755 0 7 0 758 0 761 0 764 0 7670 770 0 773 0 776 0 779 0 782 0 785 0 8 0 788 0 791 0 794 0 797 0 800 0 802 0 805 0 808 0 811 0 813 0 90 816 0 819 0 821 0 824 0 826 0 829 0 831 0 834 0 836 0 839 1 00 841 0 844 0 846 0 848 0 851 0 853 0 855 0 858 0 860 0 862 1 10 864 0 867 0 869 0 871 0 873 0 875 0 877 0 879 0 881 0 883 1 2 0 885 0 887 0 889 0 891 0 893 0 894 0 896 0 898 0 900 0 901 1 3 0 903 0 905 0 907 0 908 0 910 0 911 0 913 0 915 0 916 0 918 1 40 919 0 921 0 922 0 924 0 925 0 926 0 928 0 929 0 931 0 932 1 5 0 933 0 934 0 936 0 937 0 938 0 939 0 941 0 942 0 943 0 944 1 60 945 0 946 0 947 0 948 0 949 0 951 0 952 0 953 0 954 0 954 1 70 955 0 956 0 957 0 958 0 959 0 960 0 961 0 962 0 962 0 963 1 80 9640 9650 966 0 9660 967 0 00

Statistics
StatisticsA town has 330 000 adults whose collected heights follow approximately the Normal distribution with mean 175 cm and standard deviation 10 cm The correct way to label this standard deviation is 10 cm True False

Statistics
Probability0 08 0 44 6 The figure above shows the probability density function for the random variable 2 The shaded area represents P 1 z 5 What is P 1 5 Select the correct answer below 0 46 0 35 0 54 0 11 092 0 05 P z 1

Statistics
StatisticsFigure 9 6 Price of Cernations 12 10 8 6 4 2 100 200 1 300 400 500 Domestic Supply Tariff World Price Domestic Demand 600 Quantity of Camations in dozens il cave this response Refer to Figure 9 6 Without trade the equilibrium price of carnations is a 8 and the equilibrium quantity is 300 b 4 and the equilibrium quantity is 500 c 6 and the equilibrium quantity is 200 O d 6 and the equilibrium quantity is 400

Statistics
StatisticsYou flip a fair coin 16 times This binomial distribution can be approximated with a normal distribution N 8 2 where the mean u is 8 and the standard deviation a is 2 Approximating the binomial distribution with a normal curve what is the probability of flipping 9 or 10 heads in the 16 tosses You may use this Standard Normal Table below or a calculator 0 09 Z 0 00 0 01 0 02 0 03 0 04 0 05 0 06 0 07 0 08 0 1 0 5398 0 5438 0 5517 0 5557 0 5596 0 5636 0 5675 0 5714 0 5753 0 2 0 5793 0 5832 0 5871 0 5910 0 5948 0 5987 0 6026 0 6064 0 6103 0 6141 0 5478 O 0 879 0 8810 0 883 1 1 0 8643 0 8665 0 8686 0 8708 0 8729 0 8749 0 8770 1 2 0 8849 0 8869 0 8888 0 8907 0 8925 0 8944 0 8962 0 8980 0 8997 0 9015 1 3 0 9032 0 9049 0 9066 0 9082 0 9099 0 9115 0 9131 0 9147 0 9162 0 9177 Select the correct answer below 0 25 0 30 0 5987 0 8944

Statistics
ProbabilityFrom a box containing 2 black balls and 3 green balls 3 balls are drawn in succession each ball being replaced in the box before the next draw is made Find the probability distribution for the number of green balls Denote by X the number of green balls in the three draws Complete the probability distribution 1 X P X x 0 Tyne inteners or simplified fractions 2 3

Statistics
Statistics5 Descriptive statistics for the closing stock prices of two companies for several trading periods are shown below Microsoft Inc Mean Standard Error Median Mode Sample Variance Count 4 04 Kurtosis 0 11 1 1 Skewness 0 04 3 98 4 07 3 59 Standard Deviation 1 13 1 28 103 a Which stock is more risky Why C Range Minimum 2 Maximum Sum 5 98 416 05 Tesla Motors Inc Mean Standard Error Median 16 41 0 22 16 83 Mode 16 59 Standard Deviation 2 34 Sample Variance 5 48 Count 117 Kurtosis 9 1 Skewness 2 85 Range 12 57 Minimum 6 29 Maximum 18 86 Sum b Which company s stock price has a more dispersed distribution Explain Show your com plete work and support your answer 1919 63 Compare the Skewness of the two and explain what is indicated

Statistics
ProbabilityDetermine the critical value or values for a one mean z test at the 6 significance level if the hypothesis test is left tailed Ha Ho Select the correct answer below O 1 881 O 1 555 O 1 555 1 881 O 1 881 and 1 881 1 555 and 1 555 ZO 48 0 050 30 24 20 12 20 06 20 03 0 706 1 175 1 555 1 881

Statistics
StatisticsThe North American Treaty Organiztion NATO estimated the 2016 defense budget of the United States as being 608 billion A military contractor thinks this estimate is incorrect and wants to prove that the 2016 defense budget was not 608 billion Ho p 608B Hap 608B Which graph below corresponds to that hypothesis test Select the correct answer below O

Statistics
Statistics1 A random variable X that assumes the values X X Xk is called a discrete uniform random variable if its probability mass function is f x K for all c X2 X and 0 otherwise Find the mean and variance of X Determine the expression that represents the mean Choose the correct answer below A 1 OB K k OC EX i 1 Tw k

Statistics
ProbabilityAn experiment involves tossing a pair of dice one green and one red and recording the numbers that come up If x equals the outcome on the green die and y the outcome on the red die the sample space S consists of all the possible ordered pairs x y Event A is the event that the sum is less than 5 Event B is the event that a 3 occurs on either die Event C is the event that a number less than 4 comes up on the green die Assume that all elements of the sample space are equally likely to occur Complete parts a through c below Click the icon to view the sample space a Find the probability of event A P A Type an integer or a simplified fraction b Find the probability of event C P C Type an integer or a simplified fraction c Find the probability of event An C P ANC Type an integer or a simplified fraction Sample Space 1 1 1 2 1 3 1 4 1 5 2 4 2 1 2 2 2 3 2 5 3 1 3 2 3 3 3 4 3 5 4 1 4 2 4 3 4 4 4 5 5 1 5 2 5 3 5 4 5 5 6 1 6 2 6 3 6 4 6 5 102 Mer Her 1 6 2 6 3 6 4 6 5 6 6 6 I

Statistics
StatisticsFor the following distribution of quiz scores if a score of X 4 or lower is a failing grade how many individuals failed the quiz X f 6 5 4 3 2 1 3 6 5 5 3 3 2 9 14 10

Statistics
Statistics60 points His teacher told him the mean score on the test was a 3 with a standard deviation of 6 What is Nick s z score O 1 83 O 417 O 1 83


Statistics
Statisticsthat the hours worked for a service representative have a mean of 54 with standard deviation 14 hours The normal distribution for the population is shown by the dotted black line The company plans to take a random sample of 30 such employees and will calculate the mean hours worked of the sample to compare to the known hours worked Compute the the mean and standard deviation of the sampling distribution of sample means for a sample of size 30 Round your answers to the nearest tenth Show your answer by moving the two draggable points to build the sampling distribution Sorry that s incorrect Try again 0 2 The population has a normal distribution with mean 54 and standard deviation 2 7 a 2 7 754 17 T

Statistics
StatisticsRecently the bowling scores of a certain bowler were normally distributed with mean 201 and standard deviation 22 a Find the probability that a score is from 185 to 210 b Find the probability that a score is from 155 to 170 c Find the probability that a score is greater than 200 d The best score is 299 Find the percentile that corresponds to this score and explain what that number represents Click the icon to view the standard normal distribution table a The probability that a score is from 185 to 210 is Round to four decimal places as needed b The probability that a score is from 155 to 170 is Round to four decimal places as needed c The probability that a score is greater than 200 is Round to four decimal places as needed d Theth percentile corresponds to this score which means that 299 is Round to five decimal places as needed than of all his other scores worse better Data table Submit quiz Entries in the table represent area under the curve between z 0 and a positive value of z Because of the symmetry of the curve area under the curve between z 0 and a negative value of z would be found in a similar manner Z 0 00 0 01 0 02 0 03 0 04 0 05 0 06 0 07 0 08 0 0 0 0000 0 0040 0 0080 0 0120 0 0160 0 0199 0 0239 0 0279 0 0319 0 1 0 0398 0 0438 0 0478 0 0517 0 0557 0 0596 0 0636 0 0675 0 0714 0 2 0 0793 0 0832 0 0871 0 0910 0 0948 0 0987 0 1026 0 1064 0 1103 0 3 0 1179 0 1217 0 1255 0 1293 0 1331 0 1368 0 1406 0 1443 0 1480 0 4 0 1554 0 1591 0 1628 0 1664 0 1700 0 1736 0 1772 0 1808 0 1844 0 5 0 1915 0 1950 0 1985 0 2019 0 2054 0 2088 0 2123 0 2157 0 2190 0 6 0 2257 0 2291 0 2324 0 2357 0 2389 0 2422 0 2454 0 2486 0 2517 0 7 0 2580 0 2611 0 2642 0 2673 0 2704 0 2734 0 2764 0 2794 0 2823 0 8 0 2881 0 2910 0 2939 0 2967 0 2995 0 3023 0 3051 0 3078 0 3106 0 9 0 3159 0 3186 0 3212 0 3238 0 3264 0 3289 0 3315 0 3340 0 3365 1 0 0 3413 0 3438 0 3461 0 3485 0 3508 0 3531 0 3554 0 3577 0 3599 1 1 0 3643 0 3665 0 3686 0 3708 0 3729 0 3749 0 3770 0 3790 0 3810 1 2 0 3849 0 3869 0 3888 0 3907 0 3925 0 3944 0 3962 0 3980 0 3997 1 3 0 4032 0 4049 0 4066 0 4082 0 4099 0 4115 0 4131 0 4147 0 4162 1 4 0 4192 0 4207 0 4222 0 4236 0 4251 0 4265 0 4279 0 4292 0 4306 1 5 0 4332 0 4345 0 4357 0 4370 0 4382 0 4394 0 4406 0 4418 0 4429 1 6 0 4452 0 4463 0 4474 0 4484 0 4495 0 4505 0 4515 0 4525 0 4535 1 7 0 4554 0 4564 0 4573 0 4582 0 4591 0 4599 0 4608 0 4616 0 4625 1 8 0 4641 0 4649 0 4656 0 4664 0 4671 0 4678 0 4686 0 4693 0 4699 1 9 0 4713 0 4719 0 4726 0 4732 0 4738 0 4744 0 4750 0 4756 0 4761 2 0 0 4772 0 4778 0 4783 0 4788 0 4793 0 4798 0 4803 0 4808 0 4812 2 1 0 4821 0 4826 0 4830 0 4834 0 4838 0 4842 0 4846 0 4850 0 4854

Statistics
Statistics24 Three spinners identical to the one shown below are spun simultaneously Select the following probability distribution that represents the number of spinners that land on orange O Green O O Red O Yellow Number of Spinners Number of Spinners Probability Probability 0 Number of Spinners Probability Orange 0 1 2 Number of Spinners Lui Purple 2 3 1 2 3 25 25 25 0 1 2 333 12 9 6 25 25 25 25 0 1 2 3 64 48 12 1 125 125 125 125 0 1 12 9 6 2 3 3

Statistics
StatisticsExercise 6 15 Algo Find the following probabilities based on the standard normal variable Z You may find it useful to reference the z table Round your answers to 4 decimal places a P Z 0 94 b P Z 2 08 c P 0 Z 1 32 d P 0 93 Z 2 68

Statistics
StatisticsThe following cumulative relative frequency table shows the amount of federal tax paid by a sample of 200 small businesses in a fiscal year Cumulative Tax Paid 15 000 to under 20 000 20 000 to under 25 000 25 000 to under 30 000 30 000 to under 35 000 35 000 to under 40 000 40 000 to under 45 000 Download CSV Relative Frequency 8 0 21 0 37 5 56 0 79 0 100 0 1 What percent of the businesses paid at least 35 000 56 0 x 2 What is the relative frequency percent of the 30 000 to under 35 000 class 122 5 x 3 How many of the businesses paid less than 20 000 8 X 4 How many businesses paid at least 25 000 but less than 40 000 172 5 X
Statistics
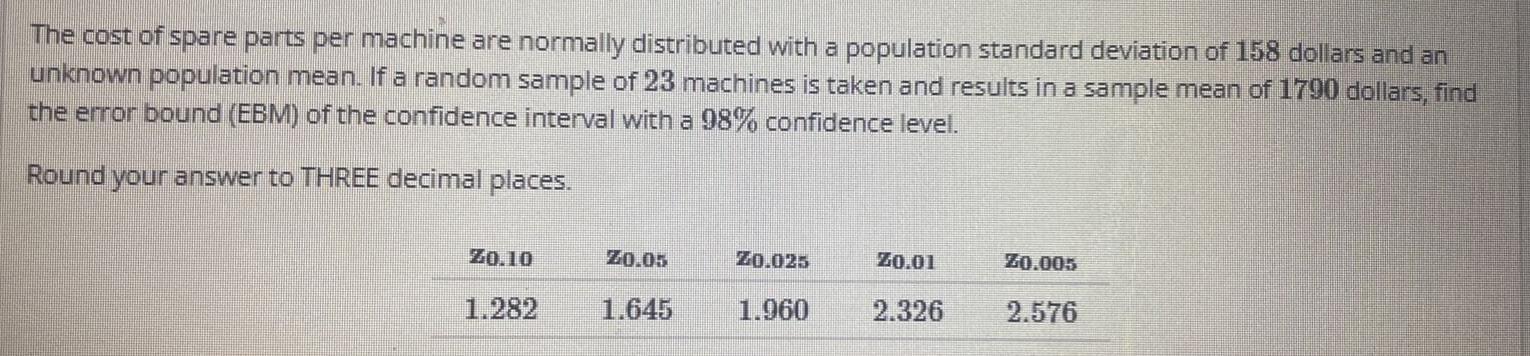
StatisticsThe cost of spare parts per machine are normally distributed with a population standard deviation of 158 dollars and an unknown population mean If a random sample of 23 machines is taken and results in a sample mean of 1790 dollars find the error bound EBM of the confidence interval with a 98 confidence level Round your answer to THREE decimal places ZO 10 1 282 ZO 05 1 645 20 025 1 960 20 01 2 326 20 005 2 576

Statistics
StatisticsLet W be a random variable giving the number of tails minus the number of heads in three tosses of a coin Assuming that a tail is one fifth as likely to occur find the probability distribution of the random variable W Complete the following probability distribution of W 3 1 W f w 1 3 www

Statistics
StatisticsA family of statisticians is trying to decide if they can afford for their child to play youth baseball The cost of joining a team is normally distributed with a mean of 750 and a standard deviation of 185 If a sample of 40 teams is selected at random from the population select the expected mean and standard deviation of the sampling distribution below Select all that apply 185 OPE 29 25 4 63 118 59 18 75 750

Statistics
ProbabilityThe probability density function for the random variable X is shown below Find P X 2 Select the correct answer below 01 0 0 1 10 O O 29 19 49 0 f x 4 5 6 7 8 19 10 11

Statistics
Statistics2 is produced by burning fossil fuels such as oil and natural gas and has been connected to global warming The following table presents the average amounts in metric tons of CO emissions for certain years per person in the United States and per person in the rest of the world Use a TI 84 calculator to answer the following Year 1990 1994 1997 1999 2000 2001 2002 2003 2004 2006 Send data to Excel Part 0 3 Non U S 3 6 3 3 3 4 3 2 3 3 3 3 3 3 3 5 3 7 3 7 Part 1 of 3 U S 19 2 19 8 20 19 6 20 19 6 19 6 19 4 19 6 19 0 a Compute the least squares regression line for predicting U S emissions from non U S emissions Round the slope and y intercept values to four decimal places E

Statistics
StatisticsTuition K per year 80 U 70 60 50 40 30 20 10 0 Box and Whisker Plot of Top 25 US Business Schools Grouped by Region Which of the following statements are true Select all that apply East South The highest median tuition is found in the East region The lowest median tuition is found in the West region Region Midwest A willingness to pay 60K for tuition per year gives enrollment choices in all regions There is no overlap in the interquartile range of the East with the West West

Statistics
StatisticsTuition SK per year 80 70 60 FE 50 40 30 20 10 0 Box and Whisker Plot of Top 25 US Business Schools Grouped by Region Which of the following statements are true Select all that apply East South The highest median tuition is found in the East region H The lowest median tuition is found in the West region Region Midwest A willingness to pay 60K for tuition per year gives enrollment choices in all regions There is no overlap in the interquartile range of the East with the West There is no overlap in the interquartile range of the East with the South West

Statistics
StatisticsThe midterm and final exam grades for a statistics course are provided in the data set below Jaymes a student in the class scored 86 on both exams Treat the given data sets as samples Jaymes wants to know which grade is more unusual the midterm grade or the final exam grade Use Excel to calculate the z scores corresponding to each grade Round to three decimal places Do not round until you ve calculated your final answer Provide your answer below Help Midterm 85 RAR 88 78 82 79 78 86 80 Final 81 88 Copy to Clipboard 68 69 69 81 82 86 76 Download CSV

Statistics
StatisticsListed below are the highest amounts of net worth in millions of dollars of all celebrities What do the results tell us about the population of all celebrities Based on the nature of the amounts what can be inferred about their precision 265 190 185 165 155 155 145 145 145 145 D OD The results tell us that all celebrities are expected to have amounts of net worth approximately equal to one of the measures of center found in parts a through d Based on the nature of the amounts what can be inferred about their precision O A Since no information is given nothing can be said about the precision of the given values OB Since celebrity information is public these values can be assumed to be unrounded OC The values are all whole numbers so they appear to be accurate to the nearest whole number OD The values all end in 0 or 5 so they appear to be rounded estimates

Statistics
StatisticsSuppose a survey of adults and teens ages 12 17 in a certain country was conducted to determine the number of texts Number of Texts Adults Teens None 166 9 1 10 981 140 11 20 245 65 254 114 126 107 162 183 sent in a single day a Construct a relative frequency distribution for adults b Construct a relative frequency distribution for teens c Construct a side by side relative frequency bar graph d Compare the texting habits of adults and teens a Complete the table below Number of Texts Adults None 1 10 11 20 21 50 51 100 100 throo decimal places as needed www 21 50 51 100 100

Statistics
StatisticsA researcher wanted to determine the number of televisions in households He conducts a survey of 40 randomly selected households and obtains the data in the accompanying table Complete parts a through h below Click the icon to view the table of television counts OD The given data are continuous because they can only have whole number values b Construct a frequency distribution of the data Televisions Frequency 0 1 2 3 4 5 Table of television counts 1 3 2 2 1 2 1 30 321 4 213 2 2 1 3 2 4 2 3 1 0 2 5 1 1 122 4522 2 1 1 2 23 Print Done

Statistics
StatisticsNext question Assume that the sample is a simple random sample obtained from a normally distributed population of flight delays at an airport Use the table below to find the minimum sample size needed to be 95 confident that the sample standard deviation is within 1 of the population standard deviation A histogram of a sample of those arrival delays suggests that the distribution is skewed not normal How does the distribution affect the sample size To be 95 confident that s is 1 5 10 20 30 40 50 within of the value of o the sample size n should be at least To be 99 confident that s is within of the value of o the sample size In should be at least 6 The minimum sample size needed is 19 205 768 192 48 21 128 1 5 10 20 30 40 50 33 218 1 336 336 85 365 38 22 14 Points 0 of 6 Save

Statistics
StatisticsA teacher gave a pop quiz in class The quiz had a maximum score of 10 points The lowest score in the class was a 4 Draw a frequency ogive a cumulative frequency polygon for the set of quiz scores presented in the following FDT 16 14 12 10 8 6 A Score 4 5 6 7 8 9 10 Frequency 1 1 0 4 5 5 1