Statistics Questions
The best high school and college tutors are just a click away, 24×7! Pick a subject, ask a question, and get a detailed, handwritten solution personalized for you in minutes. We cover Math, Physics, Chemistry & Biology.

Statistics
Statistics46 51 53 51 Assume a population of 46 51 53 and 59 Assume that samples of size n 2 are randomly selected with replacement from the population Listed below are the sixteen different samples Complete parts a through c 46 46 46 53 53 53 53 46 46 59 53 59 H 51 46 59 46 51 51 59 51 Type integers or simplified fractions Use ascending order of the sample medians OT 6 51 53 59 53 Save 51 59 59 59 a Find the median of each of the sixteen samples then summarize the sampling distribution of the medians in the format of a table representing the probability distribution of the distinct median values Use ascending order of the sample medians Sample Median Probability Sample Median Probability E C

Statistics
StatisticsWilliam keeps track of the amount of time he works on homework each week and the number of problems he is able to solve The data are shown in the table below Plot the points to create a scatter plot that accurately records the data Provide your answer below Move Point Line Hours working Problems solved 1 3 2 3 3 4 4 5 5 7 Undo Redo x Reset

Statistics
StatisticsQUESTION 47 Suppose you computed r 0 817 using n 13 data points Using the critical values table below determine if the value of r is significant or not df CV and df CV and df CV and df CV and 1 0 997 11 0 555 21 0 413 40 2 0 950 12 0 404 50 3 0 878 13 0 396 60 4 0 811 14 0 388 70 5 0 754 15 0 381 80 6 16 90 0 707 0 666 17 100 0 632 18 19 0 602 0 576 20 7891 10 Select the correct answer below 0 532 0 514 0 497 0 482 0 468 0 456 0 444 0 433 0 423 22 23 24 25 26 27 28 29 30 0 374 0 367 0 361 0 355 0 349 Or is significant because it is between the positive and negative critical values r is not significant because it is between the positive and negative critical values r is significant because it is not between the positive and negative critical values T is not significant because it is not between the positive and negative critical values 0 304 0 273 0 250 0 232 0 217 0 205 0 195

Statistics
StatisticsQUESTION 50 2 POINTS Researchers are conducting a pooled left tailed two mean hypothesis test at a 1 significance level The two samples have sizes n 19 and n 14 The next step for the researchers is to find the critical value s for the hypothesis test Determine the critical value s for this test df to 10 Select all correct answers Select all that apply 2 453 2 449 2 445 2 445 31 32 33 34 to 05 to 025 to 01 to 005 1 309 1 696 2 040 2 453 2 744 1 309 1 694 2 037 2 449 2 738 1 308 1 692 2 035 2 445 2 733 1 307 1 691 2 032 2 441 2 728

Statistics
StatisticsThe answer choices below represent different hypothesis tests for annual return of mutual funds Which of the listed below is a left tailed test Select all correct answers Select all that apply H p 18 Ha p 18 Ho 19 3 H 19 3 H p 8 H 8 Ho 11 3 H p 11 3 Ho 23 7 Hap 3 7

Statistics
StatisticsThe data show the hourly earnings in dollars of a sample of 25 railroad equipment manufacturers Use technology to answer parts a and b 15 65 18 75 14 55 15 75 14 35 13 95 17 50 17 55 13 80 14 25 19 05 15 40 15 25 19 50 16 00 16 50 16 35 15 30 15 05 19 15 15 25 16 30 17 70 18 35 15 25 a Find the data set s first second and third quartiles Q Q3 Type integers or decimals Do not round b Draw a box and whisker plot that represents the data set Choose the correct answer below Note that different technologies will produce slightly different results O A O B O C Q

Statistics
StatisticsThis problem asks you to draw the histogram for the following GFDT of test scores Score 40 44 45 49 50 54 On the graph below draw a histogram for this data set 30 34 35 39 This is best accomplished by following this protocol start by clicking on the lower left corner of the left most bar draw each consecutive bar by clicking in order the upper left corner the upper right corner the lower right corner repeat last step until all bars are drawn 5 Frequency 8 1 0 5 7 Also we will want the bar to span the class width which is 5 Thus a bar meant to span the values 5 9 would actually span 4 5 to 9 5 all the values that might round to 5 thru 9 H 10 9 8 7 6 4 3 2

Statistics
StatisticsCompute the mean and standard deviation of the random variable with the given discrete probability distribution P x 6 0 17 2 0 07 2 0 24 4 0 28 6 0 24 Send data to Excel Part 1 of 2 a Find the mean Round the answer to three decimal places if necessary The mean is 1 6 Part 2 of 2 b Find the standard deviation Round the answer to three decimal places if necessary 50 20 ola B

Statistics
StatisticsHeights of the tallest buildings in LA through 2016 in feet 1099 1018 858 750 748 735 725 723 717 699 699 667 625 620 578 571 571 560 534 533 517 516 506 496 493 491 478 463 454 454 454 450 443 417 414 1 Make a Histogram with 10 classes a Frequency Table class width classes frequency b Histogram label axes show scales used 2 Make a Relative Frequency Polygon based on your Histogram in problem 1 a midpoints freq rel freq b Relative Frequency Polygon label axes show scales used c Distribution Shape 3 Make a Cumulative Frequency Graph ogive based on your Histogram in problem 1 Upper Class a Limits Frea Cum Freg b Cumulative Frequency Graph

Statistics
StatisticsCHECK YOUR UNDERSTANDING CYU In the dialog box provided work the following problem Submit your work by inserting an image or uploading a single PDF file Percent of 16 Year Old Drivers Year f 1998 1999 2000 2001 2002 2003 2004 Percent of 16 Year Olds with Driver s Licenses L 44 0 37 0 34 0 32 5 31 5 30 5 30 0 Source Federal Highway Administration Average Rate of Change Find the average rate of change for the three blank areas

Statistics
StatisticsAnother measure of central tendency is the trimmed mean It is computed by determining the mean of a data set after deleting the smallest and largest observed values Compute the trimmed mean for the data given in the accompanying table whose mean is 0 874 Is the trimmed mean resistant Click the icon to view the data table The trimmed mean is Round to the nearest thousandth as ne Data Table 0 87 0 91 0 89 0 83 0 91 0 88 0 90 0 88 0 88 0 94 0 82 0 90 0 90 0 86 0 86 0 86 0 91 0 86 0 87 0 93 0 96 0 87 0 93 0 91 0 91 0 86 0 89 0 87 0 88 0 89 0 77 0 82 0 88 0 84 0 93 0 81 0 92 0 85 0 84 0 84 Ne 0 84 0 84 0 88 0 87 0 88 0 85 0 84 0 83 0 90 0 86

Statistics
Probabilityg UA ACO 20 16 12 8 4 C Tar 0 14 0 4 8 12 16 20 UB ACO 20 16 12 8 4 10 Tar 0 4 8 12 16 20 Is there a relationship between cigarette tar and CO OA No there appears to be no relationship OB Yes as the amount of tar increases the amount of carbon monoxide also increases C ACO 20 165 125 8 4 0 0 4 8 12 16 20 Tar Q GU ACO 20 16 12 8 4 0 Tar 0 4 8 12 16 20

Statistics
Statisticsne table below gives the number of elementary school children in 16 school stricts in a particular region a Construct a cumulative frequency distribution b Construct a cumulative relative frequency distribution c Draw a frequency polygon d Draw a relative frequency ogive Number of Elementary School Students in 16 School Districts 1245 2400 4458 2500 1260 2991 3110 4800 2294 1050 1931 2287 2885 4400 4697 3640 a Complete the cumulative frequency distribution Students in a District 1000 1999 2000 2999 3000 3999 4000 4999 Cumulative Frequency

Statistics
StatisticsEach of the following three data sets represents the IQ scores of a random sample of adults IQ scores are known to have a mean and median of 100 Full data set a 107 107 105 107 105 93 116 98 102 102 93 102 93 100 95 110 Sample of Size 5 114 92 Sample of Size 12 114 92 96 119 Sample of Size 30 114 96 110 108 109 92 119 112 111 109 96 96 108 96 108 118 106 115 116 104 116 104 95 111 96 MTV Ve p ww Save 109 6 Type an integer or decimal rounded to one decimal place as needed What is the mean of the new sample of size 30 107 6 Type an integer or decimal rounded to one decimal place as needed What is the median of the new sample of size 5 102 Type an integer or decimal rounded to one decimal place as needed What is the median of the new sample of size 12 104 5 Type an integer or decimal rounded to one decimal place as needed What is the median of the new sample of size 30 7 Type an integer or decimal rounded to one decimal place as needed

Statistics
StatisticsIn a certain state pickup trucks account for 25 of the state s registered vehicles If 200 registered vehicles a selected at random what is the expected number of pickup trucks The expected number of pickup trucks is

Statistics
ProbabilityA sample of blood pressure measurements is taken for a group of adults and those values mm Hg are listed below The values are matched so that 10 subjects each have a systolic and diastolic measurement Find the coefficient of variation for each of the two samples then compare the variation Systolic 116 129 160 94 156 120 115 135 128 122 Diastolic 81 77 76 51 90 89 57 64 71 82 The coefficient of variation for the systolic measurements is Type an integer or decimal rounded to one decimal place as needed CTD The coefficient of variation for the diastolic measurements is Type an integer or decimal rounded to one decimal place as needed Compare the variation The coefficients of variation for each data set are within 5 percentage points of each other Therefore the systolic measurements vary the diastolic

Statistics
StatisticsBecause the mean is very sensitive to extreme values it is not a resistant measure of center By deleting some low values and high values the trimmed mean is more resistant To find the 10 trimmed mean for a data set first arrange the data in order then delete the bottom 10 of the values and delete the top 10 of the values then calculate the mean of the remaining values Use the axial loads pounds of aluminum cans listed below for cans that are 0 0111 in thick Identify any outliers then compare the median mean 10 trimmed mean and 20 trimmed mean 246 261 268 274 277 280 281 282 284 284 287 288 289 292 294 295 296 300 312 507 Compare the values Choose the correct answer below OA The median untrimmed mean and 20 trimmed mean are close to each other However the 10 trimmed mean is significantly different from those values OB The median 10 trimmed mean and 20 trimmed mean are close to each other However the untrimmed mean is significantly different from those values OC The median untrimmed mean and 10 trimmed mean are close to each other However the 20 trimmed mean is significantly different from those values OD All of the values are close to each other OE The untrimmed mean 10 trimmed mean and 20 trimmed mean are close to each other However the median is significantly different from those values

Statistics
Probability10 The numbers of on time flights and the number Airline of delayed or cancelled flights for four major airlines for a given month is given in the table Which airline had the highest probability of an on time flight A B C D On time 63 207 65 339 93 411 37 506 The airline with the highest probability of an on time flight is Airline 1 probability of Type an integer or decimal rounded to four decimal places as needed 1 O B Delayed or Cancel 15 788 11 424 23 859 8 851 with a

Statistics
StatisticsWhen finding the 37th percentile from a sample of IQ scores the locator L is found to be 45 5 What is the value of the 37th percentile Choose the correct answer below OA The IQ score that is midway between the 45th and 46th scores in the sorted list OB The IQ score that is midway between the 37th and 38th scores in the sorted list C The 46th IQ score in the sorted list D The 45th IQ score in the sorted list

Statistics
Probability8 According to a recent survey the probability that the driver in a fatal vehicle accident is female event F is 0 2745 The probability that the driver is 24 years old or less event A is 0 1868 The probability that the driver is female and is 24 years old or less is 0 0511 Answer parts a through d below a Find the probability of FUA P FUA b Find the probability of F UA P F UA c Find the probability of FNA P FOA d Find the probability of F UA P F UA 0 4102 Round to four decimal places as needed Round to four decimal places as needed Round to four decimal places as needed Round to four decimal places as needed

Statistics
StatisticsRefer to the table summarizing service times seconds of dinners at a fast food restaurant How many individuals are included in the summary Is it possible to identify the exact values of all of the original service times Time sec 60 119 120 179 180 239 240 299 300 359 individuals are included in the summary Type a whole number Is it possible to identify the exact values of all of the original service times Frequency 8 23 14 1 5 O A No The frequency distribution tells nothing about the data values that fall below the lowest class limit or ab the highest class limit OB Yes The data values in each class are spread evenly across the full length of the class OC No The data values in each class could take on any value between the class limits inclusive OD Yes The data values in each class are equal to the corresponding class midpoint

Statistics
ProbabilityConsider the information in the Why we can t lose weight chart shown to the right which is in the magazine style of graph Could the information provided be organized into a pie chart Why or why not Choose the correct answer below 63 Metabolism too slow 59 OND OA No The values in the table are not decimals B Yes The information could be organized into a pie chart OC No There are more than 3 categories of data D No The percentages add up to more than 100 Don t exercise 50 Why we can t lose weight Don t have self discipline 49 Splurge on favorite foods

Statistics
ProbabilityThe following graph represents the results of a survey in which a random sample of adults in a certain country was asked if a certain action was morally wrong in general Complete parts a through c below Opinion Regarding an Action Depends on situation Morally wrong Morally acceptable a What percent of the respondents believe the action is morally acceptable About of the respondents Round to the nearest whole number as needed 0 20 40 60 80 10 Percentage of respondents

Statistics
StatisticsA survey of adult men and women asked Which one of the following jobs would you most like to have The results of the survey are shown in the table a Construct a relative frequency distribution for men and women b Construct a side by side relative frequency bar graph c What are the apparent differences in gender as it pertains to this question a Complete the table below Job A B C D Men Women Not sure Round to three decimal places as needed Job A B C D Not sure Men 40 26 12 14 7 Women 16 39 12 14 19

Statistics
StatisticsThe data in the accompanying table represent the land area and highest elevation for each of seven states of a country Complete parts a and b Click the icon to view the data table a Would it make sense to draw a pie chart for land area O Yes No

Statistics
ProbabilityIn a study of a sample of babies born at hospitals in one state it was found that the average mean weight at birth wa 3165 6 grams Identify whether this value is a statistic or a parameter Choose the correct answer below OA The value is a parameter because it describes some characteristic of a sample OB The value is a statistic because it describes some characteristic of a population OC The value is a statistic because it describes some characteristic of a sample OD The value is a parameter because it describes some characteristic of a population

Statistics
StatisticsA national survey asked people How often do you eat out for dinner instead of at home The frequencies were as follows Complete parts a through g Response Never Rarely Sometimes Most of the time Always Frequency 239 457 942 325 61 a Construct a relative frequency distribution of data Response Relative Frequency Never Rarely Sometimes Most of the time Always Round to three decimal places as needed

Statistics
Probabilitye pie chart below depicts the beverage size customers Dose while at a fast food restaurant Complete parts a ough c Most popular beverage sizes at a restaurant Small 22 Medium 16 Large 52 XL 10 a What is the most popular size What percentage of customers choose this size OA XL 10 B Large 52 OC Small 22 OD Medium 16 b What is the least popular size What percentage of customers choose this size OA Small 22 B Medium 16 C XL 10 D Large 52 c What percent of customers choose a medium sized beverage A 19 B 22 C 16

Statistics
StatisticsWhat is a bar graph What is a Pareto chart What is a bar graph A A bar graph is a horizontal or vertical representation of the frequency or relative frequency of the categories The height of each rectangle represents the category s frequency or relative frequency OB A bar graph is a circular graph that uses bars to divide it into segments corresponding to each category The segments are proportional to the frequency of its category OC A bar graph represents the frequencies of values either from left to right or right to left The different segmen of the bar are used to indicate the different frequencies of each category What is a Pareto chart OA A Pareto chart is a bar graph whose bars are drawn in decreasing order of frequency or relative frequency OB A Pareto chart is a combination of a pie chart and a bar graph OC A Pareto chart is a display of two data sets side by side where the height of each rectangle represents the category s frequency or relative frequency

Statistics
ProbabilityWhich of the following is associated with a parameter Choose the correct answer below O A Data that were obtained from a sample B A numerical measurement describing some characteristic of a sample OC Data that were obtained from a voluntary poll at the end of a service call OD Data that were obtained from an entire population

Statistics
ProbabilityThe following Pareto chart shows the position played by the most valuable player MVP in certain baseball league for the last 86 years Use the chart to answer parts a through d a Which position had the most MVPs The position with the most MVPs was Frequency 40 35 30 25 20 505 15 10 Most Valuable Player Award 00 OF 1B 3B PC SS 2B Position

Statistics
Probabilitywhether the given value is a statistic or a parameter A homeowner measured the voltage supplied to his home on 43 different days and the average mean value is 105 volts Choose the correct answer below OA The given value is a parameter for the year because the data collected represent a population B The given value is a statistic for the year because the data collected represent a sample OC The given value is a statistic for the year because the data collected represent a population OD The given value is a parameter for the year because the data collected represent a sample

Statistics
Probabilitythe underlined number is a statistic or a parameter In a study of all 2430 professors at a college it is found that 65 own a television Choose the correct statement below O Parameter because the value is a numerical measurement describing a characteristic of a sample Parameter because the value is a numerical measurement describing a characteristic of a population Statistic because the value is a numerical measurement describing a characteristic of a population Statistic because the value is a numerical measurement describing a characteristic of a sample

Statistics
Statisticsfrequency distribution lists the istribution lists the of occurrences of each category of data while a relative frequency of occurrences of each category of data

Statistics
ProbabilityIn a relative frequency distribution what should the relative frequencies add up to Select the correct choice and if necessary fill in the answer box to complete your choice OA The relative frequencies add up to OB The relative frequencies add up to the total number of observations

Statistics
Probability5 Data from a survey can allow one to estimate how many people who classified their work status as part time or full time actually worked in the last week Find the probability that the hours worked were 29 or less given that the worker was part time Labor Force Status Hours Worked in the Last Week 50 or More 0 19 20 29 30 39 40 49 21 Full Time Worker Part Time 72 85 83 Worker Total 93 129 216 The probability that the hours worked were 29 or less and that the worker was part time is 44 133 692 371 42 21 734 392 Round to four decimal places as needed The probability that the hours worked were 29 or less given that the worker was part time is Round to four decimal places as needed To 1261 303 1564

Statistics
ProbabilityThe number of chocolate chips in a popular brand of cookie is normally distributed with a mean of 22 chocolate chips per cookie and a standard deviation of 2 5 chips When the cookies come out of the oven only the middle 90 in terms of the number of chocolate chips are acceptable the rest are considered defective What are the cutoff numbers for the number of chocolate chips in acceptable cookies Give your answers to three decimal places

Statistics
StatisticsReview the following histogram How many data points were in the interval 35 2 46 8 1 3 6 Frequency 30 25 20 15 10 5 0 12 23 6 Leadership Scores 6 3 16 23 6 35 2 35 2 46 8 46 8 58 4 24 58 4 70

Statistics
ProbabilityReview the following box and whisker chart What is the interquartile range for employee scores A 46 67 B 57 67 C 46 57 D 25 70 Leadership Assessment Score 80 70 60 50 40 30 20 10 0 Leadership By Position Type 70 25 12 Employee 767 57 46 ANRE 70 46 32 Manager 169 5 60 56 5

Statistics
StatisticsYou are collecting data about your classmates favorite colors Which chart might be most helpful for representing the data A Scatter plot B None of these C Box and whisker D Histogram

Statistics
StatisticsWhy might you use a pareto chart to represent data A If you want to visualize how often data falls in certain intervals B If you want to show the averages and outliers C If you want to see cumulative percentages of data in various intervals D If you want to show how data changes over time

Statistics
StatisticsIn a box and whisker chart what information do you learn from the position of the whiskers A The inter quartile range B The maximum and minimum of the data values The outliers of the data set D The median

Statistics
Statisticsdz dz Draw a dependency diagram and write a chain rule formula for and dq dr z f x y x m q r y g q r Choose the correct dependency diagram for dz dq O A X dx dq Z 9 dz dy dy q OB X dq dx Z 318 V z 15 O C aq dz 9 2 918 dq 66 given the functions below O D dz dy 8 Z dz dx y dq

Statistics
StatisticsThe mean amount of time it takes a kidney stone to pass is 12 days and the standard deviation is 6 days Suppose that one individual is randomly chosen Let X time to pass the kidney stone a What is the distribution of X X N b Find the probability that a randomly selected person with a kidney stone will take longer than 11 days to pass it Round to 4 decimal places

Statistics
StatisticsThe Acme Company manufactures widgets The distribution of widget weights is bell shaped The widget weights have a mean of 40 ounces and a standard deviation of 10 ounces Use the Standard Deviation Rule also known as the Empirical Rule see image below Do not use normalcdf on your calculator Suggestion sketch the distribution in order to answer these questions a 68 of the widget weights lie between b What percentage of the widget weights lie between 10 and 50 ounces c What percentage of the widget weights lie above 20 0 15 2 35 13 5 34 34 and 13 5 2 35 015 de

Statistics
StatisticsSuppose that the duration of a particular type of criminal trial is known to be normally distributed with a mean of 22 days and a standard deviation of 5 days Let X be the number of days for a randomly selected trial Round all answers to 4 decimal places where possible a What is the distribution of X X N b If one of the trials is randomly chosen find the probability that it lasted at least 19 days c If one of the trials is randomly chosen find the probability that it lasted between 21 and 26 days

Statistics
StatisticsThe scores on a standardized test are normally distributed with a mean of 100 and standard deviation of 10 What test score is 2 5 standard deviations above the mean

Statistics
Probability1 30 points The fat content in 8 ayran samples was calculated by method A and method B and given in the table below Add your date of birth to Method B Example if your date of birth is 12 07 2003 it will be placed in the boxes in B as 1 2 0 7 2 0 0 3 A 5 7 3 9 8 2 a If method A is an accredited method test whether method B can be used instead of A with a method independent of the normal distribution at a 0 05 level and comment 30 points
Statistics
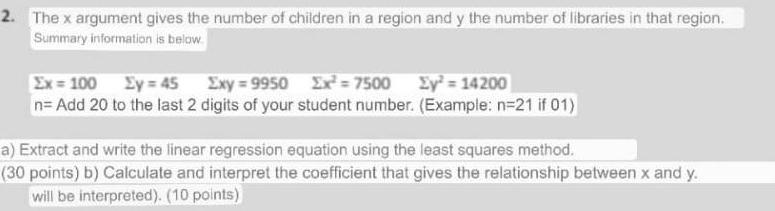
Probability2 The x argument gives the number of children in a region and y the number of libraries in that region Summary information is below Ex 100 Ey 45 Exy 9950 Ex 7500 Ey 14200 n Add 20 to the last 2 digits of your student number Example n 21 if 01 a Extract and write the linear regression equation using the least squares method 30 points b Calculate and interpret the coefficient that gives the relationship between x and y will be interpreted 10 points

Statistics
StatisticsAn engineer wants to determine how the weight of a gas powered car x affects gas mileage y The accompanying data represent the weights of various domestic cars and their miles per gallon in the city for the most recent model year Complete parts a through d below Weight pounds x 3721 3837 2652 3630 3296 2990 3664 2642 3392 3836 Miles per Gallon y 18 16 25 19 22 23 16 25 20 17 b Interpret the slope and y intercept if appropriate Choose the correct answer below and fill in any answer boxes in your choice Use the answer from part a to find this answer OA For every pound added to the weight of the car gas mileage in the city will decrease by mile s per gallon on average It is not appropriate to interpret the y intercept miles per gallon on average It is not appropriate to interpret OB A weightless car will get the slope OC For every pound added to the weight of the car gas mileage in the city will decrease by mile s per gallon on average A weightless car will get miles per gallon on average D It is not appropriate to interpret the slope or the y intercept