Statistics Questions
The best high school and college tutors are just a click away, 24×7! Pick a subject, ask a question, and get a detailed, handwritten solution personalized for you in minutes. We cover Math, Physics, Chemistry & Biology.

Statistics
Statistics7pm Points 100 Submitting an external tool Two swimmers Angie and Beth from different teams wanted to find out who had the fastest time when compared to her team Compute the scores for Angie and Beth Provide your answer below Angle Swimmer Time sec Team Mean Time Team Standard Deviation Angle 26 2 27 2 0 8 Beth 27 3 30 1 1 4

Statistics
StatisticsBetween 1980 and 2012 the number of adults in a certain country who were overweight more than quadrupled from 14 to 58 Use this information to answer parts a and b 381 manu OA Percentage 1980 2012 60 50 G 1980 2012 Peni BOE Percentage B nan b Construct a misleading graphic that makes it appear that the percent of overweight adults has more than quintupled between 1980 and 2012 Choose the correct graph below 765432 Miniinisis WEEETTTww 1980 2012 L Pen 1980 2012 O C 99 00 Percentage 60 50 40 1980 20 10 0 2012 5 1980 2012 O D Percentage 1980 2012 65 45 1980 2012

Statistics
StatisticsHere is a data set If you were to construct a frequency table for this data set you would need to compute the class width a What is the maximum of this data set max b What is the minimum of this data set min c What is the range of this data set range 67 96 8 69 23 25 69 46 21 44 65 29 60 20 67 42 79 74 51 67 79 38 34 39 28 27 77 76 10 110

Statistics
Statisticsere is a bivariate data set X y 42 1 16 2 47 5 1 5 31 6 34 2 41 5 22 2 19 5 68 5 37 2 31 6 47 1 28 5 66 6 28 41 5 8 2 43 6 31 8 30 6 67 1 15 9 95 3 51 2 11 9 18 4 75 30 2 57 7 28 37 9 47 1 9 8 33 26 4 39 7 13 7 13 6 75 5 Find the correlation coefficient and report it accurate to three dec

Statistics
Statisticsproximate the mean of the frequency distribution for the ages of the residents of a town Frequency Age 0 9 21 10 19 31 20 29 13 30 39 27 40 49 34 50 59 46 60 69 49 70 79 12 80 89 3 The approximate mean age is years Round to one decimal place as needed

Statistics
ProbabilityThe table below shows the results of a survey that asked 2859 people whether they are involved in any type of charity work A person is selected at random from the sample Complete parts a through d Male Female Total Frequently 221 207 428 Occasionally 456 440 896 Not at all 792 743 1535 Total 1469 1390 2859 a Find the probability that the person is frequently or occasionally involved in charity work M b Find the probability that the person is female or not involved in charity work at all P being frequently involved or being occasionally involved Round to the nearest thousandth as needed P being female or not being involved Round to the nearest thousandth as needed c Find the probability that the person is male or frequently involved in charity work P being male or being frequently involved

Statistics
StatisticsNet Income and Stockholders Equity for Four Businesses Four different corporations Cancer Libra Sagittarius and Virgo show the same balance sheet data at the beginning and end of a year These data exclusive of the amount of stockholders equity are summarized as follows Total Liabilities Total Assets Beginning of the year End of the year 179 000 75 200 On the basis of the above data and the following additional information for the year determine the net income or loss of each company for the year Hint First determine the amount of increase or decrease in stockholders equity during the year No additional common stock was issued and no dividends were paid No additional common stock was issued but dividends of 7 300 were paid Sagittarius Additional common stock of 16 800 was issued but no dividends were paid Virgo Additional common stock of 15 300 was issued and dividends of 9 500 were paid Enter all amounts as positive numbers Cancer Libra Cancer Libra 111 900 Net Income Net Income Sagittarius Net Income Virgo Net Income 44 800 15 30 x 43 80 x 16 80 x 15 30 x Feedback Check My Work Consider the impact that investments dividends and net income net loss have on the stockholders capital account

Statistics
StatisticsS Find the indicated z score The graph depicts the standard normal distribution with mean 0 and standard deviation 1 The indicated z score is Round to two decimal places as needed 0 2033 20

Statistics
ProbabilityFollowing is the probability distribution of a random variable that represents the number of extracurricular activities a college freshman participates in Part 1 of 3 Part 1 3 0 Part 2 of 3 1 P x 0 07 0 13 Send data to Excel 2 3 4 a Find the probability that a student participates in exactly four activities The probability that a student participates in exactly four activities is 0 14 0 45 0 21 0 14 b Find the probability that a student participates in less than three activities

Statistics
StatisticsProvide an appropriate response Round to the nearest hundredth Find the standard deviation for the given probability distribution x P x 1 0 18 2 0 38 3 0 10 4 10 29 G 2 89 1 48 G 1 24 0 1 22

Statistics
StatisticsThe data in the table represent the stock price for a company at the end of each month in 2015 a Construct a time series plot and comment on any trends b What was the percent change in the stock price of the company from January 2015 to December 2015 Date 1 15 2 15 3 15 4 15 5 15 6 15 7 15 8 15 9 15 10 15 11 15 12 15 Closing Price 28 71 28 89 31 34 35 56 31 00 31 44 30 59 31 58 32 51 36 12 36 76 37 26 Closing Price 40 35 30 25 TTT Jan Jun Month Dec Q Closing Price And Jan Jun Dec Month Comment on any trends Choose the correct answer below Q The stock price generally increased throughout the year There was no discernible trend in the stock price throughout the year The stock price generally remained the same throughout the year The stock price generally decreased throughout the year b The percent change in the stock price of the company from January 2015 to December 2015 was Round to the nearest tenth as needed

Statistics
StatisticsUse the displayed dot sequence to answer parts a through e below a Which sequence illustrates the three diagrams that continue this dot sequence O A OB

Statistics
StatisticsThe data fatal accidents within the age group by gender Complete parts a through c below Number of Male Number of Licensed Age Drivers 000s 16 12 16 20 6 424 21 24 6 954 25 34 18 068 35 44 20 406 45 54 19 898 55 64 14 364 65 74 8 194 74 4 803 Number of Female Licensed Fatal Crashes Male Drivers 000s 12 227 5 180 5 016 8 579 7 990 7 127 4 527 2 274 2 022 6 139 6 816 17 664 20 081 19 984 14 441 8 394 5 375 Number of Fatal Crashes Female 77 2 113 1 538 2 780 2 742 2 285 1 514 938 969 L What is the correct interpretation of the slope of the least squares regression line for males Select the correct choice below and if necessary fill in the answer box to complete your choice Use the answer from part a to find this answer OA If the number of fatal crashes increases by 1 then the number of male licensed drivers thousand on average increases by B If the number of male licensed drivers increases by 1 thousand then the number of fatal crashes increases by on average OC If the average age of all male licensed drivers increases by 1 then the number of fatal crashes increases by on average OD It does not make sense to interpret the slope

Statistics
StatisticsUse the accompanying radiation levels in P30 W for 50 different cell phones Find the percentile P30 Type an integer or decimal rounded to two decimal places as needed kg GITE 0 21 0 91 1 07 1 20 1 35 0 27 0 93 1 09 1 21 1 41 0 29 0 94 1 12 1 24 1 41 0 45 0 94 1 13 1 26 1 42 0 56 0 95 1 13 1 27 1 43 0 60 0 96 1 16 1 28 1 43 0 64 0 98 1 16 1 30 1 45 0 67 0 99 1 18 1 31 1 48 0 70 1 07 1 18 1 31 1 49 0 86 1 07 1 20 1 34 1 50 D

Statistics
Statistics6 A marketing group found that p 40 of adult cell phone owners have downloaded an application app to their cell phone Assume this percentage applies to the population of all adult cell phone owners a In a random sample of 50 adult cell phone owners how likely is it to find that more than 60 have downloaded an app to their cell phone b Refer to part a Suppose you observe a sample proportion of 0 62 Generate a 90 confidence interval about the true proportion p of adult cell phone owners who have downloaded an app c Do you think the marketing group assessment is valid Please circle your answer YES NO Why Please brief explanation

Statistics
ProbabilityA binomial probability experiment is conc probability of x successes in the n independent trials of the experiment n 20 p 0 9 x 19 P 19 Do not round until the final answer Then round to four decimal places as need

Statistics
Probabilityding to flightstats com American Airlines flights from Dallas to Chicago are on time me Suppose 17 flights are randomly selected and the number of on time flights is re xplain why this is a binomial experiment etermine the values of n and p nd and interpret the probability that exactly 11 flights are on time ind and interpret the probability that fewer than 11 flights are on time nd and interpret the probability that at least 11 flights are on time nd and interpret the probability that between 9 and 11 flights inclusive are on time Using the binomial distribution the probability that fewer than 11 flights are on time is und to four decimal places as needed pret the probability 00 trials of this experiment it is expected that about will result in fewer than 11 flig ng on time und to the nearest whole number as needed
Statistics
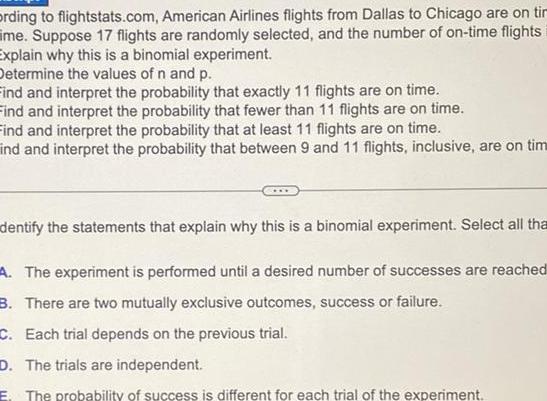
Probabilityording to flightstats com American Airlines flights from Dallas to Chicago are on tir me Suppose 17 flights are randomly selected and the number of on time flights Explain why this is a binomial experiment Determine the values of n and p Find and interpret the probability that exactly 11 flights are on time Find and interpret the probability that fewer than 11 flights are on time Find and interpret the probability that at least 11 flights are on time ind and interpret the probability that between 9 and 11 flights inclusive are on tim dentify the statements that explain why this is a binomial experiment Select all tha A The experiment is performed until a desired number of successes are reached B There are two mutually exclusive outcomes success or failure C Each trial depends on the previous trial D The trials are independent E The probability of success is different for each trial of the experiment

Statistics
Statisticsstribution a discrete probability distribution Type an integer or a decimal 3 4 5 6

Statistics
StatisticsUse z scores to compare the given values The tallest living man at one time had a height of 239 cm The shortest living man at that time had a height of 71 8 cm Heights of men at that time had a mean of 170 36 cm and a standard deviation of 6 23 cm Which of these two men had the height that was more extreme Since the z score for the tallest man is z the height that was more extreme Round to two decimal places and the z score for the shortest man is z the man had tallest

Statistics
ProbabilityIn a particular survey of internet users 3612 respondents say that they use social networking sites and 1495 respondents say that they do not use social networking sites What is the probability that a randomly selected person uses a social networking site Does that result suggest that it is likely with a probability of 0 5 or greater for someone to use social networking sites The probability that a randomly selected person uses a social networking site is Round to three decimal places as needed Is it likely for a respondent to use social media OA Yes because the probability of a respondent using social media is greater than 0 5 O B Yes because the probability of a respondent using social media is less than or equal to 0 5 OC No because the probability of a respondent using social media is greater than 0 5 O D No because the probability of a respondent using social media is less than or equal to 0 5

Statistics
ProbabilityS College students are randomly selected and arranged in groups of three The random variable x X is the number in the group who say that they take one or more online courses Determine whether 0 a probability distribution is given If a probability distribution is given find its mean and standard deviation If a probability distribution is not given identify the requirements that are not satisfied 1 2 Does the table show a probability distribution Select all that apply A Yes the table shows a probability distribution B No the numerical values of the random variable x are not associated with probabilities C No the random variable x is categorical instead of numerical D No the sum of all the probabilities is not equal to 1 E No not every probability is between 0 and 1 inclusive O A students Round to one decimal place as needed 3 Find the mean of the random variable x Select the correct choice below and if necessary fill in the answer box to complete your choice P x 0 107 0 351 0 396 0 146

Statistics
Statisticsevents are independent OD E cannot affect F because person 1 planting tulip bulbs in October could nev so the events are neither dependent nor independent c E The unusually foggy weather in London on May 8 F The number of car accidents in London on May 8 OA The unusually foggy weather in London on May 8 could not affect the number of car accidents in London on May 8 so E and F are independent OB The number of car accidents in London on May 8 could affect the unusually foggy weather in London on May 8 so E and F are dependent OC The unusually foggy weather in London on May 8 could affect the number of car accidents in London on May 8 so E and F are dependent

Statistics
Probabilityprobability that a randomly selected 5 year old male stink bug will live to be 6 years 3976 What is the probability that two randomly selected 5 year old male stink bugs will live rs old What is the probability that six randomly selected 5 year old male stink bugs will live t rs old What is the probability that at least one of six randomly selected 5 year old male stink not live to be 6 years old Would it be unusual if at least one of six randomly selected ear old male stink bugs did not live to be 6 years old

Statistics
StatisticsDetermine whether the events E and F are independent or dependent Justify your an a person being a neavy reader of assigned course materiais b E A randomly selected person planting tulip bulbs in October F A different randomly selected person planting tulip bulbs in April OA E can affect the probability of F because the people were randomly selected s events are dependent OB E can affect the probability of F even if the two people are randomly selected events are dependent OC E cannot affect F and vice versa because the people were randomly selected events are independent OD E cannot affect F because person 1 planting tulip bulbs in October could nev so the events are neither dependent nor independent

Statistics
ProbabilityThe word and in probability implies that we use the The word and in probability implies that we use the rule ru subtraction division

Statistics
Probabilitytermine whether the events E and F are independent or dependent Justify your answ a E A person having a high GPA F The same person being a heavy reader of assigned course materials OA E and F are dependent because being a heavy reader of assigned course materi affect the probability of a person having a high GPA OB E and F are dependent because having a high GPA has no effect on the probabil person being a heavy reader of assigned course materials OC E and F are independent because being a heavy reader of assigned course mate has no effect on the probability of a person having a high GPA OD E and F are independent because having a high GPA has no effect on the probat

Statistics
ProbabilityA university conducted a survey of 365 undergraduate students regarding satisfaction with student government Results of the survey are shown in the table by class rank Complete parts a through d below Satisfied Neutral Not satisfied Total Freshman 51 30 16 97 Sophomore Junior Senior 49 61 14 23 98 10 19 78 60 19 13 92 a If a survey participant is selected at random what is the probability that he or she is satisfied with student government Total 221 73 71 365 P satisfied Round to three decimal places as needed b If a survey participant is selected at random what is the probability that he or she is a junior P junior Round to three decimal places as needed P satisfied and junior Round to three decimal places as needed c If a survey participant is selected at random what is the probability that he or she is satisfied and a junior P satisfied or junior Round to three decimal places as needed d If a survey participant is selected at random what is the probability that he or she is satisfied or a junior

Statistics
ProbabilityWhat do we call the outcome yellow www OA Unusual event B Certain event C Impossible event D Not so unusual event green blue UU NU VOcause for all the products are greater than brown yellow orange C

Statistics
Statisticsetermine whether the scatter diagram at a linear relation may exist between the two riables If the relation is linear determine nether it indicates a positive or negative sociation between the variables Use this ormation to answer the following Response 400 300 200 100 0 0 A The variables have a negative association B The variables have a positive association C The relationship is not linear 2 4 6 Explanatory C The data points have a linear relationship because they do not lie mainly in a straight line OD The data points do not relationship because th straight line he relationship is linear do the variables have a positive or negative associat

Statistics
Probabilitythe following a probability model What do we call e outcome yellow Color red green blue brown yellow orange Probability 0 25 0 2 0 1 0 1 0 0 3 the table above an example of a probability model A Yes because the probabilities sum to 1 and they are all greater than or equal to 0 and less than or equal to 1 B Yes because the probabilities sum to 1 C No because the probabilities do not sum to 1 D No because not all the probabilities are greater than 0

Statistics
Probability1 What is the sample space of the spinner S 0 1 2 3 4 5 6 7 2 What is set A A 0 1 2 3 4 3 What is the probability of spinning a number less than 5 P 5 4 What is set B B 5 What is the probability of spinning a natural number P N 6 What is A and B A and B 1 2 3 4 7 What is the probability of spinning a natural number and a number less than 5 P A and B Enter the values from least to greatest Do not use spaces in your answer 8 What is A and B A and B 9 What is the probability of spinning a number not less than 5 or a natural num

Statistics
StatisticsWhy does Reagan mention of synagogues and mosques in his speech at Moscow State University O To tell how Americans live O To highlight religious freedom in his nation To tell how many are there in the number To tell about their toung

Statistics
Probability5 A bakery has determined that the number of loaves of its white bread demanded daily has a normal distribution with mean 7 200 loaves and standard deviation 300 loaves Based on cost considerations the company has decided that its best strategy is to produce a sufficient number of loaves so that it will fully supply demand on 94 of all days a How many loaves of bread should the company produce 6734 7897 8100 0 000 b Based on the production in part a on what percentage of days will the company have a demand of less than 6500 loaves of bread 7666 0 0000 0 0000 0 0013

Statistics
Probability4 Researchers at the Terry College of Business at the University of Georgia sampled 344 business students and asked them this question Over the course of your lifetime what is the maximum numbe of years you expect to work for any one employer The sample resulted in x 19 1 years Assume that the sample of students was randomly selected from the 6 000 undergraduate students at the Terry College and that o 6 years a Describe the sampling distribution of x b If the mean for the 6 000 undergraduate students is 18 5 years find P x 19 1 c If the mean for the 6 000 undergraduate students is 19 5 years find P x 19 1 d If P x 19 1 0 50 what is e If P x 19 1 0 20 is greater than or less than 19 1 years f Why do you think that these are approximate probabilities Please circle your answer The population may not be normal Because the Central Limit Theorem Because the standard deviation is known Because all of the above v Because i and ii only

Statistics
Probability1 The optimal scheduling of preventative maintenance tests of some but not all of n independently operating components was developed in Reliability Engineering and System Safety January 2006 The time in hours between failures of a component was approximated by an exponential distribution with mean 8 a Suppose 0 1 000 hours Find the probability that the time between component failures ranges between 1 200 and 1 500 hours b Again assume 0 1 000 hours Find the probability that the time between component failures is at least 1 200 hours c Given that the time between failures is at least 1 200 hours what is the probability that the time between failures is less than 1 500 hours

Statistics
Statistics8 The radon levels measured in becquerels per cubic meter Bq m3 in the inner chambers of a sample of 12 tombs in the Valley of Kings Luxor Egypt were determined Summary statistics follow x 3 743 Bq m and s 4 887 Bq m Use this information to estimate with 90 confidence the true mean level of radon exposure in tombs in the Valley of Kings Note certain areas of NJ also have gas radon

Statistics
Statistics2 An assessment of the quality of the electrical power system in Turkey was the topic of an article published in Electrical Engineering March 2013 One measure of quality is the degree to which voltage fluctuations cause light flicker in the system The perception of light flicker x when the system is set at 380 kV was measured periodically over 10 minute intervals For transformers supplying heavy industry plants the light flicker distribution was found to follow approximately a normal distribution with 2 2 and o 0 5 If the perception of light flicker exceeds 3 the transformer is shut down and the system is reset How likely is it for a transformer supplying a heavy industry plant to be shut down due to light flicker

Statistics
Statistics7 The day after Thanksgiving called Black Friday is one of the largest shopping days in the United States Winthrop University researchers conducted interviews with a sample of 38 women shopping on Black Friday to gauge their shopping habits and re ported the results in the International Journal of Retail and Distribution Management Vol 39 2011 One question was How many hours do you usually spend shopping on Black Friday Summary statistics about data from the 38 shoppers are listed in the table below Options Summary statistics Column n Mean Variance Std dev Std err Median Range Min Max Q1 Q3 HOURS 38 6 0789474 7 5881935 2 7546676 0 44686609 5 13 3 16 4 7 20 a Describe the population of interest to the researchers b What is the quantitative variable of interest to the researchers c Use the information in the table to estimate the population mean number of hours spent shopping on Black Friday with a 96 confidence interval

Statistics
Probability3 Almost all companies utilize some type of year end performance review for their employees Human Resources HR at the University of Texas Health Science Center provides guidelines for supervisors rating their subordinates For example raters are advised to examine their ratings for a tendency to be either too lenient or too harsh According to HR If you have this tendency consider using a normal distribution 10 of employees rated exemplary 20 distinguished 40 competent 20 marginal and 10 unacceptable Suppose you are rating an employee s performance on a scale of 1 lowest to 100 highest Also assume the ratings follow a normal distribution with a mean of 50 and a standard deviation of 15 a What is the lowest rating you should give to an exemplary employee if you follow the University of Texas HR guidelines b What is the lowest rating you should give to a competent employee if you follow the University of Texas HR guidelines

Statistics
Statisticssts of five identical components connected in series as shown 2 3 4 As soon as one components fails the entire system will fail Suppose each component has a lifetime that is exponentially distributed with 0 01 and that components fail independently of one another Define events A ith component lasts at least t hours i 1 5 so that the A s are independent events Let X the time at which the system fails that is the shortest minimum lifetime among the five components a The event X t is equivalent to what event involving A A UA n A3 U A4 A5 A UA U A3 UA4 UA5 A A A3 A4 A5 n n A n A U A3 n A4 U A5 b Using the independence of the A s compute P X t P X t Obtain F t P X t F t Obtain the pdf of X 500 A5

Statistics
StatisticsYou are testing the null hypothesis that there is no relationship between two variables X and Y From your sample of n 20 you determine that SSR 60 and SSE 20 Complete parts a through e below a What is the value of FSTAT State the hypotheses to test Choose the correct answer below OA Ho B 0 H B 0 O C Ho B 0 H B 0 FSTAT Round to the nearest integer as needed b At the a 0 05 level of significance what is the critical value The critical value is Round to two decimal places as needed c Based on your answers to a and b what statistical decision should you make O A Reject Ho There is evidence that there is a relationship between X and Y OB Do not reject Ho There is no evidence that there is a relationship between X and Y OC Reject Ho There is no evidence that there is a relationship between X and Y OD Do not reject Ho There is evidence that there is a relationship between X and Y d Compute the correlation coefficient by first computing and assuming that b is negative OB Ho B 0 H B 0 O D Ho B 20 H B 0

Statistics
StatisticsA magazine used the summated rating of 10 restaurants to predict the cost of a restaurant meal For that data SSR 132 092 26 and SST 142 845 11 Complete parts a through c a Determine the coefficient of determination 2 and interpret its meaning 2 Round to four decimal places as needed Interpret the meaning of r It means that of the variation in the cost of a meal Round to two decimal places as needed b Determine the standard error of the estimate be explained by the variation in summated ratings Syx Round to four decimal places as needed c How useful do you think this regression model is for predicting the cost of a meal OA It is not very useful for predicting the cost of a meal because the coefficient of determination is close to 0 and the standard error of the estimate is fairly large OB It is very useful for predicting the cost of a meal because the coefficient of determination is close to 1 and the standard error of the estimate is fairly small OC It is very useful for predicting the cost of a meal because the coefficient of determination is close to 1 The standard error of the estimate does not indicate whether a regression model is useful OD It is not very useful for predicting the cost of a meal because although the coefficient of determination is close to 1 the standard error of the estimate is fairly small

Statistics
ProbabilityFitting a straight line to a set of data yields the following prediction line Complete a through c below 6 10X a Interpret the meaning of the Y intercept bo Choose the correct answer below OA The Y intercept bo 6 implies that the average value of Y is 6 B The Y intercept bo 6 implies that for each increase of 1 unit in X the value of Y is expected to increase by 6 units OC The Y intercept bo 6 implies that when the value of X is 0 the mean value of Y is 6 OD The Y intercept bo 10 implies that when the value of X is 0 the mean value of Y is 10 b Interpret the meaning of the slope b Choose the correct answer below OA The slope b 10 implies that the average value of Y is 10 OB The slope b 6 implies that for each increase of 1 unit in X the value of Y is expected to in rease by 6 units OC The slope b 10 implies that for each increase of 1 unit in X the value of Y is expected to decrease by 10 units OD The slope b 10 implies that for each increase of 1 unit in X the value of Y is expected to increase by 10 units c Predict the mean value of Y for X 4 Y Simplify your answer

Statistics
Statistics4 The correlation between size and selling price for the following data was computed to be r 0 9005918 What is the coefficient of determination How much of the variation in selling price is explained by the least squares regression line

Statistics
Statistics15 A computer monitor is composed of a very large number of points of light called pixels It is not uncommon for a few of these pixels to be defective Let X represent the number of defective pixels on a randomly chosen monitor The probability distribution of X is as follows Find the mean number of defective pixels x P x 0 0 2 1 0 5 2 0 2 3 0 1

Statistics
Statistics12 The following data represent the number of days absent x and the final grade y for a sample of college students in a general education course at a large university y 0 89 2 1 86 4 2 83 5 3 81 1 4 78 2 5 73 9 6 64 3 7 71 8 8 65 5 9 66 2 a Find the least squares regression line treating number of absences as the explanatory variable and final grade as the response variable b Interpret the slope and y intercept c Predict the final grade for a student who misses five class periods and compute the residual Is the final grade above or below average for the number of absences Draw the least squares regression line on the scatter diagram of the data d e Would it be reasonable to use the least squares regressions line to predict the final grade for a student who has missed 15 class periods Why or Why not

Statistics
Statistics20 Gregor Mendel discovered the basic laws of heredity by studying pea plants In one experiment he produced plants whose parent plants contained genes for both green and yellow pods Mendel s theory states that the offspring of two such parents has probability 0 75 of having green pods Assume that 80 such plants are produced a Find the mean number of plants that have green pods b Find the variance of the number of plants that have green pods c Find the standard deviation of the number of plants that have green pods

Statistics
Statistics18 Decide in each case whether X is a binomial random variable A fair die is rolled 20 times Let X be the number of times the die comes up 6 A standard deck of 52 cards contains four aces Four cards are dealt without replacement from this deck Let X be the number that are aces A simple random sample of 50 voters is drawn from the residents in a large city Let X be the number who plan to vote for a proposition to increase spending on public schools

Statistics
Statistics16 An insurance company sells a one year term life insurance policy to a 70 year old man The man pays a premium of 400 If he dies within one year the company will pay 10 000 to his beneficiary The probability that a 70 year old man is still alive one year later is 0 9715 Let X be the profit made by the insurance company Find the expected value of the profit