Statistics Questions
The best high school and college tutors are just a click away, 24×7! Pick a subject, ask a question, and get a detailed, handwritten solution personalized for you in minutes. We cover Math, Physics, Chemistry & Biology.

Statistics
Statisticsdepression A medical researcher for the company is studying the effectiveness of Resithan as compared to their existing drug Exemor A random sample of 480 depressed individuals is selected and treated with Resithan and 162 find relief from their depression A random sample of 493 depressed individuals is independently selected fr the first sample and treated with Exemor and 162 find relief from their depression Based on the medical researcher s study can we conclude at the 0 01 level of significance that the proportion all depressed individuals taking Resithan who find relief from depression is greater than the proportion p2 of al depressed individuals taking Exemor who find relief from depression Perform a one tailed test Then complete the parts below Carry your intermediate computations to three or more decimal places and round your answers as specified in parts below If necessary consult a list of formulas a State the null hypothesis Ho and the alternative hypothesis H H 0 H 0 b Determine the type of test statistic to use Choose one c Find the value of the test statistic Round to three or more decimal places 0 d Find the critical value at the 0 01 level of significance Round to three or more decimal places e Can we conclude that the proportion of depressed individuals taking Resithan who find relief is greater than the proportion taking Exemor who find relief H X 5 a 0 0 OSO X 2 0 0

Statistics
ProbabilityLet the random variable T represent the time it takes for a randomly selected runner to complete a 100 meter dash T

Statistics
StatisticsTrydint bubble gum company claims that 4 out of 10 people prefer their gum to Eklypse Test their claim that it is different at the 90 confidence level Based on a sample of 500 people 175 said they prefer Trydint gum to Eklypse The point estimate is to 4 decimal places The 90 confidence interval is to to 4 decimal places

Statistics
ProbabilitySuppose that events E and F are independent P E 0 3 and P F 0 8 What is the P E and F The probability P E and F is Type an integer or a decimal

Statistics
ProbabilityJohn Roberto Marco and Clarice work for a publishing company The company wants to send two employees to a statistics conference To be fair the company decides that the two individuals who get to attend will have their names randomly drawn from a hat a Determine the sample space of the experiment That is list all possible simple random samples of size n 2 b What is the probability that John and Roberto attend the conference c What is the probability that Roberto attends the conference d What is the probability that Clarice stays home a Choose the correct answer below Note that each person is represented by the first letter in their name OA JR JM JC OB JR JM JC RM RC MC OC JR JM JC RM RC MC JJ RR MM CC D JR JM JC RM RC MC RJ MJ CJ MR CR CM


Statistics
ProbabilityA police officer randomly selected 577 police records of larceny thefts The accompanying data represent the number of offenses for various types of larceny thefts a Construct a probability model for type of larceny theft b Are purse snatching larcenies unusual c Are shoplifting larcenies unusual Type of Larceny Theft Pocket picking Purse snatching Shoplifting From motor vehicles Motor vehicle accessories Bicycles From buildings From coin operated machines Complete table Type of Larceny Theft Pocket picking Purse snatching Shoplifting From motor vehicles Motor vehicle accessories Bicycles From buildings Number of Offenses 8 9 123 210 83 37 97 10 Also do Coin Operating Machines Round three decimal places as needed Probability

Statistics
ProbabilityE and F are not disjoint events then P E or F E and F are not disjoint events then P E or F P E P F P B P E P F P E P F P


Statistics
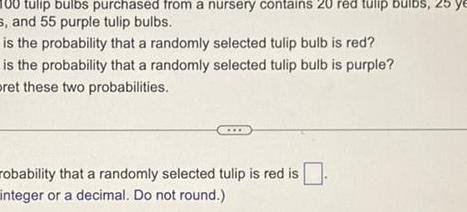
Probabilityg of 100 tulip bulbs purchased from a nursery contains 20 red tulip bulbs 25 yellow bulbs and 55 purple tulip bulbs What is the probability that a randomly selected tulip bulb is red What is the probability that a randomly selected tulip bulb is purple Interpret these two probabilities piling ng iwwe in prip be an integer or a decimal Do not round Select the correct choice below and fill in the answer boxes within your choice pe whole numbers A If 100 tulip bulbs were sampled with replacement one would expect about bulbs to be red and about of the bulbs to be purple B If 100 tulip bulbs were sampled with replacement one would expect exactly bulbs to be red and exactly of the bulbs to be purple of th of t

Statistics
Probabilityis the probability that a randomly selected family has an income greater than is the probability that a randomly selected family has an income greater than 5 Type an integer or a decimal

Statistics
StatisticsIn probability a n uncertain In probability a n uncertain is any process that can be repeated in which the results are is any process that can be repeated in which the results a experiment unusual event sample space outcome
Statistics
Probability00 tulip bulbs purchased from a nursery contains 20 red tulip bulbs 25 ye s and 55 purple tulip bulbs is the probability that a randomly selected tulip bulb is red is the probability that a randomly selected tulip bulb is purple pret these two probabilities robability that a randomly selected tulip is red is integer or a decimal Do not round
Statistics
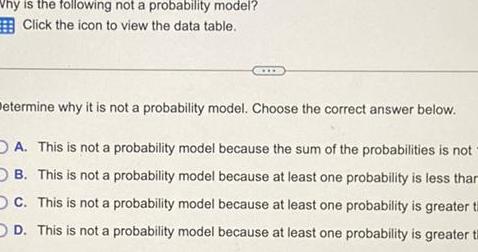
ProbabilityWhy is the following not a probability model Click the icon to view the data table etermine why it is not a probability model Choose the correct answer below OA This is not a probability model because the sum of the probabilities is not OB This is not a probability model because at least one probability is less thar OC This is not a probability model because at least one probability is greater t OD This is not a probability model because at least one probability is greater t

Statistics
Probabilityccording to a survey the probability that a randomly selected worker primarily drives a van te ork is 0 873 The probability that a randomly selected worker primarily takes public ansportation to work is 0 048 Complete parts a through d ype an integer or decimal rounded to three decimal places as needed d Can the probability that a randomly selected worker primarily walks to work equal 0 15 W r why not A No The probability a worker primarily drives walks or takes public transportation wou be less than 1 OB Yes The probability a worker primarily drives walks or takes public transportation wou equal 1 OC No The probability a worker primarily drives walks or takes public transportation woul be greater than 1 OD Yes If a worker did not primarily drive or take public transportation the only other

Statistics
ProbabilityFind the probability P EC if P E 0 41 The probability P E is Simplify your answer

Statistics
ProbabilityThe following table of values gives a company s annual profits in millions of dollars Rescale the data so that the year 2003 corresponds to x 0 Year 2003 2004 2005 2006 2007 2008 Profits in millions of dollars 31 3 32 7 31 8 33 7 35 9 36 1 Find the R2 value for the exponential regression model 0 8766 0 6868 0 7867 0 8667 0 8676 None of the above

Statistics
StatisticsIf ball is selected at random from a golf bag If the golf bag contains 5 brown balls and 4 green balls find the probability of the following event The golf ball is brown or orange probability that the golf ball is brown or orange is e an integer or a decimal rounded to three decimal places as needed

Statistics
Probabilityose Dan loses 42 of all chess games What is the probability that Dan loses two chess games in a row What is the probability that Dan loses four chess games in a row When events are independent their complements are independent as well Use th mine the probability that Dan loses four chess games in a row but does not lose www the probability that Dan loses two chess games in a row is and to four decimal places as needed he probability that Dan loses four chess games in a row is and to four decimal places as needed he probability that Dan loses four chess games in a row but does not lose five in and to four decimal places as needed

Statistics
ProbabilityClarice Marco and John work for a publishing company The company wants to send two employees to a statistics conference To be fair the company decides that the two individuals who get to attend will have their names randomly drawn from a hat a Determine the sample space of the experiment That is list all possible simple random samples of size n 2 b What is the probability that Clarice and Marco attend the conference c What is the probability that John attends the conference d What is the probability that Marco stays home

Statistics
ProbabilityCompute the probability of randomly selecting a club or spade Compute the probability of randomly selecting a club or spade Compute the probability of randomly selecting an ace or diamo club or spade e an integer or a decimal rounded to three decimal places as n club or spade or diamond an integer or a decimal rounded to three decimal places as n ace or diamond an integer or a decimal rounded to three decimal places as n

Statistics
Probability3 balls and 8 type C balls find the probability that the golf ball is not a typ he probability that the golf ball is not a type A ball is Type an integer or decimal rounded to three decimal places as needed

Statistics
StatisticsClarice Marco and Roberto work for a publishing company The company wants to send two employees to a statistics conference To be fair the company decides that the two individuals who get to atter will have their names randomly drawn from a hat a Determine the sample space of the experiment That is list all possible simple random samples of size n 2 b What is the probability that Clarice and Marco attend the conference c What is the probability that Marco attends the conference d What is the probability that Clarice stays home a Choose the correct answer below Note that each person is represented by the first letter in their name OA CM CR MR MC RC RM OB CM CR C CM CR MR D CM CR MR CC MM RR b The probability that Clarice and Marco attend the conference is

Statistics
Probabilityon 42 8 of 3 year olds are E What is the probability that a randomly selected 3 year old is enrolled in day ca probability that a randomly selected 3 year old is enrolled in day care is an integer or a decimal

Statistics
Probabilityetermine whether a certain antibody is present is 99 5 effective Thi ccurately come back negative if the antibody is not present in the test The probability of a test coming back positive when the antibody is no ive is 0 005 Suppose the test is given to four randomly selected pec antibody s the probability that the test comes back negative for all four people es the probability that the test comes back positive for at least one of th tests are negative Round to four decimal places as needed ast one positive Round to four decimal places as needed

Statistics
Probabilityhe outcome red red green blue brown yellow orange 0 0 2 0 1 0 0 the table above an example of a probability model OA No because not all the probabilities are greater than 0 OB No because the probabilities do not sum to 1 OC Yes because the probabilities sum to 1 and they are all greater than or e to 0 and less than or equal to 1 OD Yes because the probabilities sum to 1 What do we call the outcome red

Statistics
ProbabilityLet the sample space be S 1 2 3 4 5 6 7 8 9 10 Suppose the outcomes are equally likely Compute the probability of the event E an odd number less than 16 P E Type an integer or a decimal Do not round

Statistics
Statisticscigarettes Click t Complete t Tar mg 5 9 10 14 15 19 20 24 25 29 30 34 35 39 Simplify yo ative frequencies based on the frequency distributions shown below then compare the amounts of tar in nonfiltered and filte smoker Frequency Distributions Tar mg in Nonfiltered Cigarettes Frequency 15 19 20 24 25 29 30 34 35 39 1 13 7 2 Print Tar mg in Filtered Cigarettes Frequency 5 9 10 14 15 19 20 24 Done 3273 13 D X

Statistics
StatisticsIdentify the lower class limits upper class limits class width class midpoints and class boundaries for the given frequency distribution Also identify the number of individuals included in the summary 100 Type an integer or a decimal Do not round Identify the class midpoints in 1000 cells L Blood Platelet Count of Males 1000 cells L Frequency 0 99 100 199 200 299 300 399 400 499 500 599 600 699 49 5 149 5 249 5 349 5 449 5 549 5 649 5 Type integers or decimals Do not round Use ascending order Identify the class boundaries in 1000 cells L 1 1 1 1 1 1 Tune integers or decimals Do not round Use ascending order 2488TLO 45 83 18 0 1 0


Statistics
StatisticsCredit Card Statement Previous Balance Finance Charge New Purchases Payments Credits 300 00 10 00 210 00 150 00 0 00 A 670 00 B 70 00 C 370 00 D 250 00 Calculate the new balance on this account after these charges and payments are applied

Statistics
Statisticsdentify the lower class limits upper class limits class width class midpoints and class boundaries for the given frequency distribution Also identify the number of individuals included in the summary Blood Platelet Count of Males 1000 cells L Frequency 0 99 2 100 199 200 299 300 399 400 499 500 599 600 699 0 100 200 300 400 500 600 Type integers or decimals Do not round Use ascending order Identify the upper class limits in 1000 cells L 99 199 299 399 499 599 699 Type integers or decimals Do not round Use ascending order Identify the class width in 1000 cells L Type an integer or a decimal Do not round 438010 45
Statistics
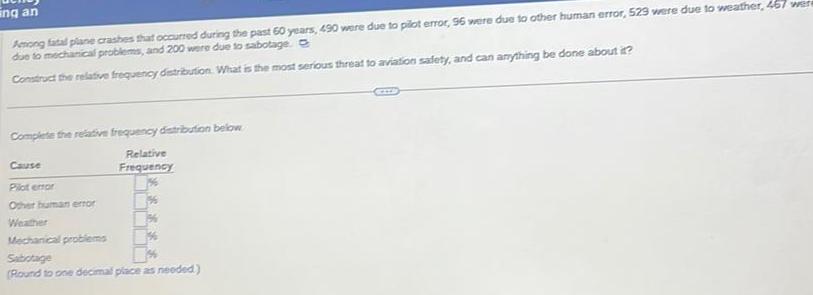
Statisticsing an Among fatal plane crashes that occurred during the past 60 years 490 were due to pilot error 96 were due to other human error 529 were due to weather 457 were due to mechanical problems and 200 were due to sabotage Construct the relative frequency distribution What is the most serious threat to aviation safety and can anything be done about it Complete the relative frequency distribution below Relative Frequency Cause Pilot empr Other human error 156 Weather Mechanical problems Sabotage Round to one decimal place as needed

Statistics
Statisticsncy an Construct the cumulative frequency distribution for the given data Age years of Best Actress when award was won 20 29 30 39 40 49 50 69 Frequency 27 33 60 69 70 79 80 89 11 3 CITR Age years of Best Actress won Less than 30 Less than 40 Less than 50 Less than 60 Less than 70 Less than 80 Less than 90

Statistics
StatisticsIf n 410 and p p hat 0 88 find the margin of error at a 90 confidence level Round to 4 places Question Hole

Statistics
Probabilitythe data in the following table which lists survey results from high school drivers at least 16 years of age Assume that subjects are randomly selected from the included in the table Drove When Drinking Alcohol No 2925 4588 Yes 663 152 Texted While Driving No Texting While Driving If four different high school drivers are randomly selected find the probability that they all drove when drinking alcohol The probability that four randomly selected high school drivers all drove when drinking alcohol is Round to six decimal places as needed Save

Statistics
Probabilitythe data in the following table which lists drive thru order accuracy at popular fast food chains Assume that orders are randomly selected from those included in the table Order Accurate Order Not Accurate Drive thru Restaurant D C 233 40 A 318 34 B 264 60 D 128 12 If one order is selected find the probability of getting an order from Restaurant A or an order that is accurate Are the events of selecting an order from Restaurant A and selecting an accurate order disjoint events CCI Save The probability of getting an order from Restaurant A or an order that is accurate is Round to three decimal places as needed

Statistics
Probabilityrinciple of redundancy is used when system reliability is improved through redundant or backup components Assume that a students alarm clock has a 12 Failure rate Complete parts a through d below C mat is the probability that the student s alarm clock will not work on the morning of an important final exam Round to three decimal places as needed

Statistics
StatisticsWhich of the following values cannot be probabilities 0 08 2 3 5 0 1 5 3 0 55 1 45

Statistics
Statisticsa Find the probability that when a single six sided die is rolled the outcome is 4 b Find the probability that when a coin is tossed the result is tails c Find the probability that when a six sided die is rolled the outcome is 19 a The probability of rolling a 4 on a six sided die is 0 167 Round to three decimal places as needed b The probability of a result of tails when tossing a coin is 0 5 Round to three decimal places as needed c The probability of rolling a 19 on a six sided die is Round to three decimal places as needed

Statistics
ProbabilityAccording to a recent report 44 of college student internships are unpaid A recent survey of 100 college interns at a local university found that 48 had unpaid internships a Use the five step p value approach to hypothesis testing and a 0 10 level of significanc to determine whether the proportion of college interns that had unpaid internships is different from 0 44 b Assume that the study found that 57 of the 100 college interns had unpaid internships and repeat a Are the conclusions the same a Let be the population proportion Determine the null hypothesis Ho and the alternative hypothesis H Ho H V Type integers or decimals Do not round

Statistics
StatisticsA consulting group recently conducted a global survey of product teams with the goal of better understanding the dynamics of product team performance and uncovering the practices that make these teams successful One of the survey findings was that 32 of organizations have a coherent business strategy that they stick to and effectively communicate Suppose another study is conducted to check the validity of this result with the goal of proving that the percentage is less than 32 Complete parts a and b below a State the null and research hypotheses Identify the null and alternative hypotheses A Ho 0 32 H 0 32 B Hot 0 32 H n 0 32 C Ho x 0 32 H 0 32 OD Ho 0 32 H 0 32 b A sample of 100 organizations is selected and results indicate that 29 organizations have a coherent business strategy that they stick to and effectively communicate Use the p value approach to determine at the 0 05 level of significance whether there is evidence that the percentage is less than 32 Calculate the test statistic The test statistic ZSTAT is al Round to be decimal places as needed

Statistics
Statisticsdently the values that are significantly low the values that are signficantly high and the values that are neither significantly low nor significantly high A test is used to assess readiness for college In a recent year the mean test score was 19 7 and the standard deviation was 5 3 Identify the test scores that are significant low or significantly high Test scores that are greater OB Test scores that are between C Test scores that are less than 9 1 Round to one decimal place as needed What test scores are significantly high Select the correct answer below and fill in the answer box es to complete your choice OA Test scores that are greater than OB Test scores that are between OC Test scores that are less than EXIB and the deal place as t Round to one decimal place as needed Use ascending order Round to one decimal place as needed and Round to one decimal place as needed Use ascending order Round to one decimal place as needed

Statistics
StatisticsIn a clinical trial of 2100 subjects treated with a certain drug 22 reported headaches In a control group of 1588 subjects given a placebo 22 reported head the proportion of headaches in the treatment group by p and denoting the proportion of headaches in the control placebo group by Pe the relative risk is p pe The relative risk is a measure of the strength of the effect of the drug treatment Another such measure is the odds ratio which is the ratio of the odds in favor of a headache for the P 1 P Pel 1 Pc The relative risk and odds ratios are commonly used in treatment group to the odds in favor of a headache for the control placebo group found by evaluating medicine and epidemiological studies Find the relative risk and odds ratio for the headache data What do the results suggest about the risk of a headache from the drug treatment Find the relative risk for the headache data The relative risk Round to three decimal places as needed GEXCED

Statistics
StatisticsThe sample space listing the eight simple events that are possible when a couple has three children is bbb bbg bgb bgg gbb gbg ggb ggg After identifying the sample space for a couple having four children find the probability of getting four girls and no boys Identify the sample space for a couple having four children COLLE

Statistics
StatisticsA denate the event of placing a 1 straight bet on a certain lottery and winning Suppose that for this particular lottery there are 5 120 different ways that you can s four digits with repetition allowed in this lottery and only one of those four digit numbers will be the winner What is the value of P A What is the value of P A mat is the value of P A 4 0 00020 Round to five decimal places as needed hat is the value of P A A Bound 10
Statistics
ProbabilityOn their first date Kelly asks Mike to guess the date of her birth not including the year Complete parts a through c below a What is the probability that Mike will guess correctly Ignore leap years Type an integer or a simplified fraction

Statistics
StatisticsYou are the manager of a restaurant for a fast food franchise Last month the mean waiting time at the drive through window for branches in your geographical region as measured from the time a customer places an order until the time the customer receives the order was 3 6 minutes You select a random sample of 81 orders The sample mean waiting time is 3 38 minutes with a sample standard deviation of 0 9 minute Complete parts a and b below a At the 0 10 level of significance is there evidence that the population mean waiting time is different from 3 6 minutes State the null and alternative hypotheses Ho 3 6 H 3 6 Type integers or decimals Determine the test statistic The test statistic is 2 2 Round to two decimal places as needed Find the p value p value 0 027 Round to three decimal places as needed

Statistics
StatisticsAre the following statements true or false Justify your answers Complete parts a through c below This is a reading assessment question Be certain of your answer because you only get one attempt on this question describing the variability in the data Finding measures of the middle and trends are the only research objectives in statistical studies OD False Statistical studies are not concerned with describing the variability in the data only with understanding the sources of variability in the data Understanding the sources allows researchers to determine what statistical methods to use in their studies c Suppose three different individuals conduct the same statistical study such as estimating the average commute time of students at a college It is possible that all three studies end up with different results Choose the correct answer below OA False Only two results are possible for any statistical study Therefore if all three individuals conduct the same statistical study at least two of the three individuals must obtain matching results OB True If at least two of the individuals made different errors in their studies then it is possible that all three studies end up with different results This is the only way for all three studies to end up with different results OC True Statistical studies typically look at samples rather than entire populations Since each study is likely to draw different samples it is quite possible that each study ends up with different results due to variability in the data D False Statistics is a form of mathematics which means that as long as correct procedures are used all studies should obtain the same results even if different studies used different procedures

Statistics
StatisticsThe data table below contains the amounts that a sample of nine customers spent for lunch in dollars at a fast food restaurant Complete parts a through d Click here to view page 1 of the table of critical values of t Click here to view page 2 of the table of critical values of t 4 14 5 09 5 93 6 41 7 27 7 67 8 59 8 44 10 02 D a At the 0 01 level of significance is there evidence that the mean amount spent for lunch is different from 6 50 State the null and alternative hypotheses Hoi H H Type integers or decimals Do not include the symbol in your answer