Statistics Questions
The best high school and college tutors are just a click away, 24×7! Pick a subject, ask a question, and get a detailed, handwritten solution personalized for you in minutes. We cover Math, Physics, Chemistry & Biology.

Statistics
StatisticsTo determine customer opinion of their pricing Home Depot randomly selects 120 check out lines during a certain week and surveys all customers in the check out lines What type of sampling is used O A Convenience B Simple random OC Stratified OD Systematic OE Cluster
Statistics
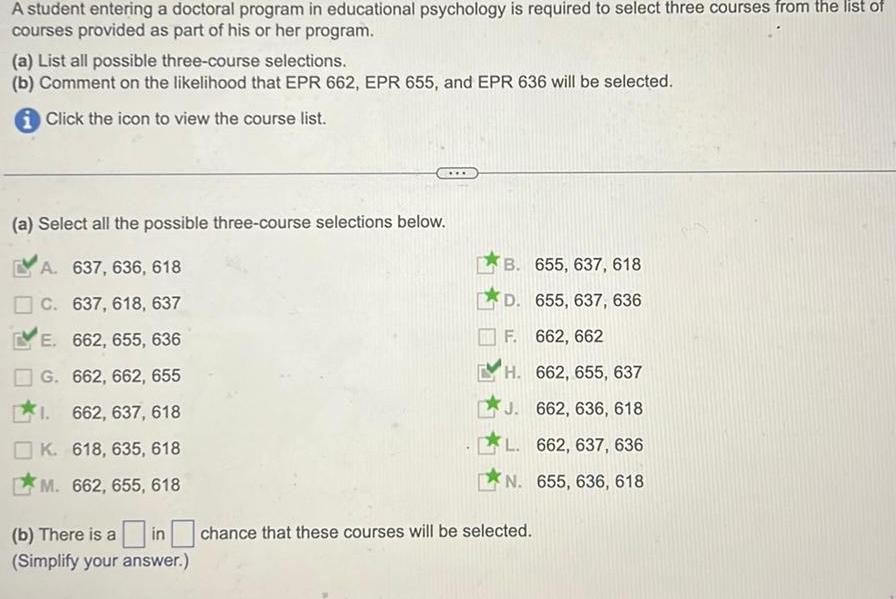
ProbabilityA student entering a doctoral program in educational psychology is required to select three courses from the list of courses provided as part of his or her program a List all possible three course selections b Comment on the likelihood that EPR 662 EPR 655 and EPR 636 will be selected iClick the icon to view the course list a Select all the possible three course selections below A 637 636 618 C 637 618 637 E 662 655 636 G 662 662 655 1 662 637 618 K 618 635 618 M 662 655 618 b There is a in Simplify your answer B 655 637 618 D 655 637 636 F 662 662 H 662 655 637 J 662 636 618 L 662 637 636 N 655 636 618 chance that these courses will be selected

Statistics
ProbabilityIncome Brackets The following diagram shows the movement of households in a certain country among three income groups affluent middle class and poor over the 11 year period 1980 1991 72 000 in 1994 dollars 24 000 in 1994 dollars AFFLUENT 27 9 MIDDLE CLASS 30 8 POOR 7 3 8 i a Use the transitions shown in the diagram to construct a transition matrix assuming zero probabilities for the transitions between affluent and poor Let 1 affluent 2 middle class and 3 poor 0 721 0 279 0 0 847 0 08 0 073 0 0 308 0 692 b Assuming that the trend shown was to continue what percent of households classified as affluent in 1980 were predicted to become poor in 2002 Give your answer to the nearest 0 1 22 3 04 c According to the model what percentage of all households will be in each income bracket in the long term Give your answer to the nearest 0 1 affluent 172

Statistics
StatisticsAn introductory to psychology professor has students report their major on the first day of classes Then the professor decides to determine the major that is most representative of the students in their class Which measure of central tendency should they utilize the mean the median the mode the weighted average

Statistics
StatisticsA population of N 10 scores has u 21 and o 3 What is the population variance 07 100 9

Statistics
StatisticsWhat is the median for the data represented in the histogram below 4 3 f 2 1 1 80 3 N 1 2 10 X 3 4

Statistics
StatisticsA population of N 5 scores has a variance of o 24 If the scores were from a sample what value would be obtained for the sample variance Os 14 Os 16 Os 20

Statistics
StatisticsA continuous time plant is described by the state equation 1 2 H x 0 The state equation is to be solved for x t using digital computer Obtain suitable recursive relations Take sampling interval T 1 sec Show that if there is pole zero cancellation in the input output transfer function of a linea time invariant discrete time system the system will be either uncontrollable or unobservable The linear continuous time plant of a sampled data system is described by the state equation 0 1 x Determine the value of sampling period T which makes the system uncontrollable

Statistics
StatisticsChildren total 8 left handed 22 Right handed Randomly assigns 2 children to work together what is the chance they are both right handed Randomly assigns 3 Children to play a gamu what is the chance NONE of the children chosen are left hande

Statistics
ProbabilityFor the decision tree below state which decision should be made Pay attention to the minus signs The probabilities are given in brackets Decision 1 Decision 2 Decision 3 Decision 4 favourable 5 unfavourable 5 favourable 6 unfavourable 4 favourable 5 unfavourable5 favourable 5 untavourable 5 6 500 7 300 8 800 9 1000 105 400 115 600 124 1000 135 500

Statistics
StatisticsO Points 0 of 1 e following data represent the ages of award winners for best actor and best actress in a leading role for the 20 years from 1985 to 2004 Answer parts a b below Best Actor Ages 37 64 50 38 37 34 38 32 60 28 49 Construct an ordered back to back stem and leaf display 50 54 50 46 47 40 Best Actor Age 234 Best Actress Age 31 22 25 31 34 39 63 52 21 4140 70 45 16 points Best Actress Ages 26 26 30 39 39 31 Save Full data set 41 27

Statistics
Statistics3 Assume that the readings on the thermometers are normally distributed with a mean of 0 C and a standard deviation of 1 C A thermometer is randomly selected and tested In each case draw a sketch and find the probability of each reading The given values are in Celsius degrees a Greater than 1 25 b Greater than 1 96 c Greater than 1 75 d Greater than 1 96 f Between 0 50 e Between 1 00 and 2 00 and 1 50 g Between 2 11 and 1 55 and 2 08 h Between 1 80

Statistics
Probability5 Assume that z scores are normally distributed with a mean of 0 and a standard deviation of 1 a If P 0 z a 0 3907 find a b If P b z b 0 8664 find b c If P Z c 0 0643 find c d If P z d 0 9922 find d e If P Z e 0 4500 find e f If P f z 1 59164 0 86889 find h

Statistics
Statistics4 Assume that the class length of a course this summer last between 50 0 min and 58 0 min A class day is randomly selected find the probability that the class length is a Less than 51 5 min min c Between 45 5 min and 51 5 min 51 5 min and 60 6 min b Greater than 50 5 d Between

Statistics
Probability1 Inability to get along with others is the reason cited in 17 of worker firings based on data from Robert Half International Inc Concerned about her company s working conditions the personnel manager at the Boston Finance Company plans to investigate the five employee firings that occurred over the past year a Assuming that the p 17 rate applies find the probability that among those five employees n 5 the number fired because of an inability to get along with others is at least four P X 4 b If the personnel manager actually does find that at least four of the firings are due to an inability to get along with others does this company appear to be very different from other typical companies Answer YES NO Why or why not

Statistics
Probability2 Currently an average of 7 residents of the village of Westport population 760 die each year based on data from the National Center for Health Statistics a Find the mean number of deaths per day Answer b Find the probability that on a given day there are no deaths c Find the probability that on a given day there is one death d Find the probability that on a given day there is more than one death e Based on the preceding results should Westport have a contingency plan to handle Why or more than one death per day YES why not NO

Statistics
ProbabilityAssume that human body temperatures are normally distributed with a mean of 98 21 F and a standard deviation of 0 64 F a A hospital uses 100 6 F as the lowest temperature considered to be a fever What percentage of normal and healthy persons would be considered to have a fever Does this percentage suggest that a cutoff of 100 6 F is appropriate b Physicians want to select a minimum temperature for requiring further medical tests What should that temperature be if we want only 5 0 of healthy people to exceed it Such a result is a false positive meaning that the test result is positive but the subject is r really sick Click to view page 1 of the table Click to view page 2 of the table a The percentage of normal and healthy persons considered to have a fever is 0 01 Round to two decimal places as needed Does this percentage suggest that a cutoff of 100 6 F is appropriate A No because there is a small probability that a normal and healthy person would be considered to have a fever OB No because there is a large probability that a normal and healthy person would be considered to have a fever OC Yes because there is a large probability that a normal and healthy person would be considered to have a fever D Yes because there is a small probability that a normal and healthy person would be considered to have a fever b The minimum temperature for requiring further medical tests should be F if we want only 5 0 of healthy people to exceed it Round to two decimal places as needed SXXCE

Statistics
Statisticsecause the mean is very sensitive to extreme values it is not a resistant measure of center By deleting some low values and high values the trimmed mean is more esistant To find the 10 trimmed mean for a data set first arrange the data in order then delete the bottom 10 of the values and delete the top 10 of the values the calculate the mean of the remaining values Use the axial loads pounds of aluminum cans listed below for cans that are 0 0111 in thick Identify any outliers then comp the median mean 10 trimmed mean and 20 trimmed mean 246 259 268 273 277 279 280 282 285 285 287 288 290 290 294 295 296 300 311 505 The outlier s is are 505 pounds Type a whole number Use a comma to separate answers as needed B There are no outliers The median is 286 pounds Type an integer or decimal rounded to one decimal place as needed The untrimmed mean is 294 5 pounds Type an integer or decimal rounded to one decimal place as needed The 10 trimmed mean is pounds Type an integer or decimal rounded to one decimal place as needed B

Statistics
StatisticsRefer to the accompanying data set and use the 30 screw lengths to construct a frequency distribution Begin with a lower class limit of 0 720 in and use a class width of 0 010 in The screws were labeled as having a length of 3 4 in Click on icon to view the data Complete the frequency distribution below Frequency 3 4 11 9 0 760 0 770 3 Type integers or decimals rounded to the nearest thousandth as needed Length in 0 720 0 730 0 730 0 740 0 740 0 750 0 750 0 760 F Data table Points 0 of 2 www Screw Lengths inches 0 734 0 754 0 752 0 739 0 734 0 744 0 742 0 723 0 751 0 751 0 758 0 744 0 744 0 735 0 743 0 755 0 749 0 749 0 741 0 736 0 747 0 762 0 759 0 756 0 744 0 731 0 752 0 754 0 751 0 746 X

Statistics
Statisticspanying data set and use the 30 screw lengths to construct a frequency distribution Begin with a lower class limit of 0 720 in and use a class width of 0 010 in The screws were labeled as having a length of 3 4 in Click on icon to view the data Complete the frequency distribution below Frequency Length in 0 720 FIL Type integers or decimals rounded to the nearest thousandth as needed Data table CITY Screw Lengths inches 0 734 0 754 0 752 0 739 0 734 0 744 0 742 0 723 0 751 0 751 0 758 0 744 0 744 0 735 0 743 0 755 0 749 0 749 0 741 0 736 0 747 0 762 0 759 0 756 0 744 0 731 0 752 0 754 0 751 0 746 D X

Statistics
StatisticsThe geometric mean is often used in business and economics for finding average rates of change average rates of growth or average ratios Given n values all of which are positive the geometric mean is the nth root of their product The average growth factor for money compounded at annual interest rates of 9 3 7 6 and 1 8 can be found by computing the geometric mean of 1 093 1 076 and 1 018 Find that average growth factor or geometric mean What single percentage growth rate would be the same as having three successive growth rates of 9 3 7 6 and 1 896 Is that result the same as the mean of 9 3 7 6 and 1 89 The average growth factor or geometric mean is Round to four decimal places as needed CIES

Statistics
StatisticsA student earned grades of B C A B and D Those courses had these corresponding numbers of credit hours 3 3 3 4 and 2 The grading system assigns quality poim to letter grades as follows A 4 B 3 C 2 D 1 F 0 Compute the grade point average GPA If the dean s list requires a GPA of 3 00 or greater did this student m the dean s list The student s GPA is Type an integer or decimal rounded to two decimal places as needed

Statistics
StatisticsA student s course grade is based on one midterm that counts as 10 of his final grade one class project that counts as 15 of his final grade a set of homework assignments that counts as 35 of his final grade and a final exam that counts as 40 of his final grade His midterm score is 69 his project score is 97 his homework score is 83 and his final exam score is 61 What is his overall final score What letter grade did he earn A B C D or F Assume that a mean of 90 or above is an A a mean of at least 80 but less than 90 is a B and so on His overall final score is Type an integer or a decimal Do not round Xxx

Statistics
Statisticsset is the magnitude of an earthquake mea on the Richter scale an outlier data value that is very far away from the others when considered in the context of the sample data given in this data set Explain Click t X d the me e mean ound to t More Info 1 99 1 26 0 45 0 96 0 63 2 45 2 13 2 12 0 35 0 98 0 19 2 66 0 58 2 19 2 08 2 74 0 37 1 52 1 55 2 45 0 77 2 72 2 18 1 88 0 25 0 35 1 16 2 15 0 14 2 51 2 97 0 41 1 58 2 86 2 96 1 61 1 51 1 15 0 07 2 83 1 31 2 31 2 33 2 04 2 34 2 74 1 84 2 72 1 51 1 52

Statistics
StatisticsFind the a mean b median c mode and d midrange for the data and then e answer the given question Listed below are the amounts dollars it costs for marriage proposal packages at different sports venues Are there any outliers 39 209 150 200 60 60 65 65 65 85 95 100 125 150 275 275 325 400 475 550 550 550 550 1500 2500 Type an integer or a decimal rounded to two decimal places as needed c Find the mode Select the correct choice below and if necessary fill in the answer box to complete your choice A The mode s is are 550 Type an integer or a decimal Do not round Use a comma to separate answers as needed OB There is no mode d Find the midrange The midrange is Type an integer or a decimal rounded to two decimal places as needed

Statistics
StatisticsThe table below shows the frequency distribution of the weights in grams of pre 1964 quarters Frequency Weight g 6 000 6 049 3 6 050 6 099 6 100 6 149 6 150 6 199 6 200 6 249 6 250 6 299 6 300 6 349 6 350 6 399 4 7 10 10 4 5 1 Question 9 of 9 Use the frequency distribution to construct a histogram Does the histogram appear to depict data that have a normal distribution Why or why not Choose the correct histogram below OA OB OC Frequency Frequency Aouenbor 10 5 SOSS 20 15 104 0 6 This question 5 point s possible 6 1 6 2 6 3 Weight grams 6 1 6 1 6 2 6 3 Weight grams 6 2 Weight grams 6 3 6 4 6 4 Q Q 5 Q Q Q Q 3 Does the histogram appear to depict data that have a normal distribution OA The histogram appears to depict a normal distribution The frequencies generally increase to a maximum and then decrease and the histogram is roughly symmetric OB The histogram does not appear to depict a normal distribution The frequencies generally decrease to a minimu then increase and the histogram is roughly symmetric OC The histogram appears to depict a normal distribution The frequencies generally decrease to a minimum and the increase

Statistics
StatisticsA study was conducted to determine how people get jobs The table below lists data from 400 randomly selected subjects Job Sources Help wanted ads H Executive search firms E Networking N Mass mailing M 300 250 200 150 100 50 0 ENMH Frequency 23 290 66 43 O O Help wanted ads H Executive search firms E Networking N Mass mailing M Help wanted ads H Executive search firms E Networking N Mass mailing M Executive search firms E Networking N Mass mailing M Help wanted ads H Compare the pie chart found above to the Pareto chart given on the left Can you determine which graph is more effective in showing the relative importance of job sources A The Pareto chart is more effective

Statistics
StatisticsUse the magnitudes rounded are measured on the Richter Click the icon to view the Construct the frequency distri Magnitude Richter Freq 1 0 E Type integers or decimals D Earthquake Magnitudes Magnitudes 2 451 3 623 3 063 3 299 1 090 3 099 2 989 2 577 2 439 2 911 3 381 2 829 2 439 2 561 2 787 2 177 3 013 2 709 2 440 1 636 2 437 1 971 2 319 2 783 1 941 2 402 2 120 1 694 2 389 3 310 2 791 2 412 2 272 2 206 2 030 2 462 1 959 2 473 2 402 2 073 2 064 2 347 2 068 1 911 1 906 3 263 2 618 2 342 1 438 2 952 3 202 2 310 3 100 2 848 2 342 2 992 1 800 2 763 1 734 2 890 3 134 2 373 3 270 1 989 2 202 1 826 2 157 2 642 2 342 2 192 2 572 2 270 3 121 2 318 3 782 3 280 2 487 2 003 2 711 3 373 2 512 2 330 3 099 4 693 3 862 O X Points 0 of 1 ompanying data set to construct a frequency distribution Thi LO Does the frequency distribution appear to be a normal du

Statistics
StatisticsListed below are the ages of 11 players randomly selected from the roster of a championship sports team Find the a mean b median c mode and d midrange and then e determine how the resulting statistics are fundamentally different from those calculated from the jersey numbers of the same 11 players Click the icon to view ages and jersey data and statistics a Find the mean The mean age is years Type an integer or a decimal rounded to one decimal place as needed b Find the median The median age is years Type an integer or a decimal rounded to one decimal place as needed c Find the mode Select the correct choice below and if necessary fill in the answer box to complete your choice OA The mode s is are year s Type an integer or a decimal Do not round Use a comma to separate answers as needed OB There is no mode nominal interval Ages and Jersey Data ratio Ages 40 20 31 32 34 27 23 26 23 31 26 Jersery 7 27 47 16 14 89 73 63 60 68 61 Numbers d Find the midrange The midrange is years Type an integer or a decimal rounded to one decimal place as needed e How are the resulting statistics fundamentally different from those calculated from the jersey numbers of the same 11 players The jersey numbers are data at the level of measurement but the ages are data at the level of measurement so mean 47 7 median 60 mode none Print min 7 Done statistics are meaningful max 89 midrange 48 X

Statistics
StatisticsThe data represents the heights of eruptions by a geyser Use the heights to construct a stemplot Identify the two values that are closest to the middle when the data are sorted in order from lowest to highest Which plot represents a stemplot of the data O A 3 7 4 03 5 00004 6 01234 70037 802 9 0 O B 3 4 012344 7 50037 6 002 7 000 3 80 9 0 O C 3003 4 024 5 003 6 004 7 001 8 037 9 02 Height of eruption in 62 37 50 90 50 40 70 63 77 54 me 61 64 60 WANNEE 70 80 50 50 73 S 43 82 L Identify the two values that are closest to the middle when the data are sorted in order from lowest to highest inches The values closest to the middle are inches and Type whole numbers Use ascending order

Statistics
StatisticsAs long as the sampling method is unbiased the population parameter QUESTION 2 will und QUESTION 3 response the sampling distribution will be centered around We call the variability in our sampling distribution the standard deviation True False

Statistics
StatisticsStandardized IQ tests are created in such a way so that the average IQ test score is 100 and the standard deviation for an IQ score is 15 A sample of 75 individuals is taken and it is determined that their average IQ score is 110 and their standard deviation is 20 If we were to create a sampling distribution for IQ scores with a sample size of 75 what value would we expect the sampling distribution to be centered around 055 O 0 O 10 100 02 075 O 6 67

Statistics
StatisticsWe can make a sampling distribution for any sample statistic True False QUESTION 4 True or False The standard error for the sampling distribution is equal to the standard deviation of a sample statistie True

Statistics
StatisticsFill in the blank with the appropriate response As the number of sample statistics increases in a sampling distribution that is as we add more sample statistics to our sampling distribution then O the sampling distribution remains roughly the same shape as does the mean while the SE of the sampling distribution decreases O the sampling distribution becomes more unimodal and symmetric f the sample size is large enough and the mean and SE of the sampling distribution decreases while the mean stays roughly the same the sampling distribution becomes more unimodal and symmetric f the sample size is large enough the SE for the sampling distribution decreases and the mean increases the sampling distribution remains roughly the same shape as do the mean and SE of the sampling distribution the sampling distribution remains roughly the same shape while the SE of the sampling distribution decreases and the mean increases the sampling distribution becomes more unimodal and symmetric f the sample size is large enough while the mean and SE of the sampling distribution remain relatively the same

Statistics
ProbabilityFill in the blank with the appropriate choice As the sample size not the numbe rof sample statistics increases the sampling distribution for the sample statistic becomes wider does not change becomes narrower

Statistics
Statisticshe frequency distribution was obtained using a class width of 0 5 for data on cigarette tax rates Use the frequency distribution to pproximate the population mean and population standard deviation Compare these results to the actual mean u 1 557 and standard eviation o 1 067 Click the icon to view the frequency distribution for the tax rates he population mean is Round to three decimal places as needed Frequency distribution of cigarette tax rates Tax Rate 0 00 0 49 0 50 0 99 1 00 1 49 1 50 1 99 2 00 2 49 2 50 2 99 3 00 3 49 3 50 3 99 4 00 4 49 Frequency 7 13 7 6 5 4 4 1 2 X

Statistics
StatisticsClick the icon to view the drive through service times Construct the frequency distribution Service Time seconds Frequency 70 Type whole numbers Drive Through Service Times GEXER 120 116 131 147 120 126 136 77 136 121 146 138 110 149 148 110 79 120 91 159 83 199 198 137 142 76 259 192 106 153 151 109 102 78 166 195 253 145 171 160 133 105 224 231 124 X

Statistics
ProbabilityIdentity which of these types of sampling is used random systematic convenience stratified or cluster A large company wants to administer a satisfaction survey to its current customers Using their customer database the company randomly selects 50 customers and asks them about their level of satisfaction with the company What type of sampling is used O Systematic O Stratified O Convenience O Cluster Random

Statistics
ProbabilityAn investment counselor calls with a hot stock tip He believes that if the economy remains strong the investment will result in a profit of 50 000 If the economy grows at a moderate pace the investment will result in a profit of 10 000 However if the economy goes into recession the investment will result in a loss of 50 000 You contact an economist who believes there is a 20 probability the economy will remain strong a 70 probability the economy will grow at a moderate pace and a 10 probability the economy will slip int recession What is the expected profit from this investment The expected profit is Type an integer or a decimal

Statistics
StatisticsMale and female populations of humpback whales under 80 years old are represented by age in the table below Complete parts a through d Age 0 9 10 19 20 29 30 39 40 49 50 59 60 69 70 79 Males 9 13 18 15 25 23 17 12 Females 6 8 13 18 21 21 16 12 a Approximate the population mean and standard deviation of age for males 42 50 years Round to two decimal places as needed o 20 20 years Round to two decimal places as needed b Approximate the population mean and standard deviation of age for females years Round to two decimal places as needed

Statistics
StatisticsWhat are the null and alternative hypotheses OA Ho 3 50 H p 3 50 A data set includes data from student evaluations of courses The summary statistics are n 98 x 3 35 s 0 55 Use a 0 05 significance level to test the claim that the population of student course evaluations has a mean equal to 3 50 Assume that a simple random sam been selected Identify the null and alternative hypotheses test statistic P value and state the final conclusion that addresses the original claim OC Ho H 3 50 H 3 50 Determine the test statistic Round to two decimal places as needed J B Ho H 350 H 3 50 Points 0 33 of 2 OD H H 3 50 H 3 50 13 8 67 30 points S

Statistics
StatisticsThe frequency distribution was obtained using a class width of 0 5 for data on cigarette tax rates Use the frequency distribution to approximate the population mean and population standard deviation Compare these results to the actual mean 1 557 and standa deviation o 1 067 Click the icon to view the frequency distribution for the tax rates The population mean is Round to three decimal plac

Statistics
StatisticsPatty has just completed her second semester in college She earned a grade of A in her 1 hour linear algebra course a grade of C in her 1 hour economics course a grade of D in her 5 hour enginee course and a grade of A in her 4 hour creative writing course Assuming that A equals 4 points B equals 3 points C equals 2 points D equals 1 point and F is worth no points determine Patty s grad average for the semester Patty s grade point average is Round to two decimal places as needed

Statistics
ProbabilityAccording to a study 81 of K 12 schools or districts in a country use digital content such as ebooks audio books and digital textbooks Of these 81 6 out of 10 use digital content as part of their curriculum Find the probability that a randomly selected school or district uses digital content and uses it as part of their curriculum

Statistics
StatisticsAccording to records the amount of precipitation in a certain city on a November day has a mean of 0 10 inches with a standard deviation of 0 07 inches What is the probability that the mean daily precipitation will be 0 098 inches or more for a random sample of 40 November days taken over many years Carry your intermediate computations to at least four decimal places Round your answer to at least three decima places

Statistics
StatisticsUllen frequency distributions are reported using unequal class widths because the frequencies of some groups would otherwise be small or very large Consider the following data which represent the daytime household temperature the thermostat is set to when someone is home for a random sample of 728 households Determine the class midpoint if necessary for each class and approximate the m and standard deviation temperature Click the icon to view the frequency distribution for the daytime household temperature Class 61 64 65 67 68 69 70 71 72 Class Midpoint 73 76 77 80 Round to one decimal place as needed SCLER Frequency distribution Temperature F 61 64 65 67 68 69 70 71 72 73 76 77 80 Print Frequency 32 61 190 190 117 84 54 Done X

Statistics
StatisticsKarl and Leonard want to make confetti In order to get the right balance of ingredients for their tastes they bought 5 pounds of paper hearts at 4 33 per pound 2 pounds of sparkling stars for 3 59 p pound and 2 pounds of shiny coils for 3 89 per pound Determine the cost per pound of the confetti The cost per pound of the confetti is Round to the nearest cent C

Statistics
StatisticsPart 1 Fill in the missing values in the table Round your responses for the expected frequencies to two or more Jo JE JE decimal places Round your Send data to Excel Observed frequency fo Expected frequency JE Jo JE JE Part 2 Winter 23 40 00 7 225 Spring 38 40 00 responses to three or more decimal places 0 100 Summer 54 40 00 4 900 a Determine the type of test statistic to use Type of test statistic Chi square Fall 45 40 00 0 625 Total 160 Answer the following to summarize the test of the hypothesis that birthdays are equally likely during each season of the year Use the 0 10 level of significance for the test Degrees of freedom 6 X b Find the value of the test statistic Round your answer to two or more decimal places 12 85 c Find the critical value Round your answer to two or more decimal places 10 64 d Can we reject the hypothesis that birthdays are equally likely during each season of the year BEET

Statistics
StatisticsA researcher believes that 49 of people who grew up as the only child have an IQ score over 100 However unknown to the researcher this figure is actually 50 which is the same as in the general population To attempt to find evidence for the claim the researcher is going to take a random sample of 400 people who grew up as the only child Let p be the proportion of people in the sample with an IQ score above 100 Answer the following If necessary consult a list of formulas a Find the mean of p 0 50 b Find the standard deviation of p 0 025 c Compute an approximation for P20 49 which is the probability that there will be 49 or more people with IQ scores over 100 in the sample Round your answer to four decimal places 0 6554 X

Statistics
StatisticsAge of Westminster investor in years Part 2 Under 35 35 49 50 7 102 Total Risky 15 11 90 0 808 18 20 40 0 282 18 18 70 0 026 51 Moderate mixed 13 a Determine the type of test statistic to use Type of test statistic Chi square 15 63 0 443 24 26 80 0 293 30 24 57 1 200 67 Conservative 7 7 47 0 030 18 12 80 2 113 7 11 73 1 907 32 Degrees of freedom 4 c Find the p value Round to three or more decimal places 0 130 Total 35 Answer the following to summarize the test of the hypothesis that there is no relationship between t variables age of Westminster investor and riskiness of investment choice for this past year For your the 0 05 level of significance 60 55 150 b Find the value of the test statistic Round to two or more decimal places d Can we reject the hypothesis that there is no relationship between the variables age of Westminster investor and riskiness of investment choice for this past year Use the 0 05 level of significance X