Statistics Questions
The best high school and college tutors are just a click away, 24×7! Pick a subject, ask a question, and get a detailed, handwritten solution personalized for you in minutes. We cover Math, Physics, Chemistry & Biology.

Statistics
StatisticsA New York Times article reported that a survey conducted in 2014 included 36 000 adults with 3 74 of them being regular users of e cigarettes Because e cigarette use is relatively new there is a need to obtain today s usage rate How many adults must be surveyed now if a confidence level of 95 and a margin of error of 2 5 percentage points are wanted Complete parts a through c below a Assume that nothing is known about the rate of e cigarette usage among adults n 7 0 Round up to the nearest integer

Statistics
Statisticspreparation products on the market StudyFocus and Prepara A researcher in the Education department at a nearby university wants to determine if there is any difference between the two products on the mean score on the test by their users The researcher obtains the scores on the test from a random sample of 16 users of StudyFocus and a random sample of 14 users of Prepara These samples are chosen independently These data are shown in the table StudyFocus Prepara Send data to calculator v Scores 550 483 434 512 565 395 446 420 511 505 445 417 435 557 469 455 528 523 518 549 530 547 533 489 565 509 551 553 530 516 Send data to Excel Assume that the two populations of scores are approximately normally distributed Can the researcher conclude at the 0 01 level of significance that there is a difference between the population mean of the scores on the test by the users of StudyFocus and the population mean of the scores on the test by the users of Prepara Perform a two tailed test Then complete the parts below Carry your intermediate computations to three or more decimal places If necessary consult a list of formulas a State the null hypothesis H and the alternate hypothesis H HO H 0 b Determine the type of test statistic to use Choose one c Find the value of the test statistic Round to three or more decimal places d Find the two critical values Round to three or more decimal places and e At the 0 01 level of significance can the researcher conclude that there is a difference between the mean score on the test by the users of StudyFocus and the mean score on the test by the users of Prepara OYes O No I X 5 0 0 X a S 2 00 OSO 0 0 p 100 020 S 0 0

Statistics
StatisticsEternal Keisha is a buyer for a major shipping company and wants to determine if there is any difference between the two brands of tire in the mean distance in thousands of km driven on them before they need to be replaced In the company s testing lab Keisha tests a random sample of 14 Puma tires and a random sample of 15 Eternal tires These samples are chosen independently For the Puma tires the sample mean distance in thousands of km until they would need to be replaced is 49 36 with a sample variance of 10 64 For the Eternal tires the sample mean distance in km until they would need to be replaced is 45 05 with a sample variance of 54 68 Assume that the two populations of distances driven are approximately normally distributed Can Keisha conclude at the 0 01 level of significance that there is a difference between the population mean of the distances in thousands of km driven on Puma tires before they need to be replaced and the population mean of the distances in thousands of km driven on Eternal tires before they need to be replaced Perform a two tailed test Then complete the parts below Carry your intermediate computations to three or more decimal places If necessary consult a list of formulas a State the null hypothesis H and the alternate hypothesis H H 0 b Determine the type of test statistic to use Choose one c Find the value of the test statistic Round to three or more decimal places d Find the two critical values Round to three or more decimal places and e At the 0 01 level of significance can Keisha conclude that there is a difference between the mean distance in thousands of km driven on Puma tires before they need to be replaced and the mean distance in thousands of km driven on Eternal tires before they need to be replaced QYes No H x X 4 0 0 0 0 X a S 2 OSO 020 O O P 0 0 S

Statistics
StatisticsAccording to the histogram which range of va contains the lowest frequency for number of tickets sold

Statistics
Statisticswork Find the regression equation letting the first variable be the predictor x variable Using the listed actress actor ages in various years find the best predicted age of the Best Actor winner given that the age of the Best Actress winner that year is 28 years Is the result years of the actual Best Actor winner whose age was 43 years 28 Best Actress Best Actor 43 22 53 D 30 62 146 34 35 44 30 29 58 41 56 46 31 46 52 49 61 48 35 40 Find the equation of the regression line Round the y intercept to one decimal place as needed Round the slope to three decimal places as needed VE

Statistics
Statisticsompanying table lists the ages of acting award winners matched by linear correlation between the two variables Should we expect that there would be a correlation Use a significance level of a 0 01 Ek the icon to view the ages of the award winners et a scatterplot Choose the correct graph below 70 est Actress years Q Q G OB 70 20 5 20 70 Best Actress years Q Q Best Actresses and Best Actors Best Actress 29 31 Best Actor 44 37 29 62 31 34 47 38 47 28 51 46 56 53 63 37 23 58 58 O C Best Actor years 70 20 19 20 70 Best Actress years 43 51 D 46 46 32 X Q OD Best Actor yeam B 70 d 17 10 TF m TO 20 20 70 Best Actress years Q Q 5

Statistics
StatisticsK The accompanying table lists the ages of acting award winners matched by the years in which the awards were won Construct a scatterplot find the value of the linear correlation coefficient r and find the P value of r Determine whether there is sufficient evidence to support a claim of linear correlation between the two variables Should we expect that there would be a correlation Use a significance level of x 0 01 Click the icon to view the ages of the award winners Construct a scatterplot Choose the correct graph below O A 70 20 20 70 Best Actress years Q OO G The linear correlation coefficient is r Round to three decimal places as needed Determine the null and alternative hypotheses Ho P H pl Type integers or decimals Do not round The test statistic is t Round to two decimal places as needed The P value is Round to three decimal places as needed Because the P value of the linear correlation coefficient is Should we expect that there would be a correlation OB 70 P 204 20 70 Best Actress years Q Q the significance level there CDD OC 70 OA Yes because Best Actors and Best Actresses typically appear in the same movies so we should expect the ages to be correlated OB Yes because Best Actors and Best Actresses are typically the same age 20 20 70 Best Actress years Q G Best Actresses and Best Actors Best Actress 28 29 29 64 33 34 46 Best Actor 44 35 38 47 47 46 59 Print OD 70 Done 20 20 70 Best Actress years Q S N 30 59 23 42 52 47 37 56 43 32 X sufficient evidence to support the claim that there is a linear correlation between the ages of Best Actresses and Best Actors Tim Time Remaining 00 39 30

Statistics
StatisticsUsing the latest in medical technology an orthopedic doctor has developed a new surgical procedure that he believes is an improvement over the standard procedure He wants to study whether the mean recovery time of patients who have the new procedure is less than the mean recovery time of patients who have the standard procedure The doctor studies a random sample of 11 patients who have the new procedure and a random sample of 10 patients who have the standard procedure These samples are chosen independently The doctor records each patient s recovery time in days The patients who had the new procedure have a sample mean recovery time of 363 5 with a sample variance of 2981 7 The patients who had the standard procedure have a sample mean recovery time of 415 4 with a sample variance of 249 8 Assume that the two populations of recovery times are approximately normally distributed Can the doctor conclude at the 0 01 level of significance that the population mean of the recovery times of patients who have the new procedure is less than the population mean of recovery times of patients who have the standard procedure Perform a one tailed test Then complete the parts below Carry your intermediate computations to three or more decimal places If necessary consult a list of formulas a State the null hypothesis Ho and the alternate hypothesis H Ho O H 0 b Determine the type of test statistic to use Choose one c Find the value of the test statistic Round to three or more decimal places d Find the critical value Round to three or more decimal places e At the 0 01 level of significance can the doctor conclude that the mean recovery time of patients who have the new procedure is less than the mean recovery time of patients who have the standard procedure QYes No XI 5 a S 0 0 OSO X 0 0 0 0 P B 20 O

Statistics
StatisticsA fish story The mean length of one year old spotted flounder in millimeters is 120 with standard deviation of 19 and the mean length of two year old spotted flounder is 157 with a standard deviation of 27 The distribution of flounder lengths is approximately bell shaped Part 1 of 4 a Anna caught a one year old flounder that was 155 millimeters in length What is the z score for this length Round the answers to at least two decimal places Anna s z score is Part 2 of 4 b Luis caught a two year old flounder that was 185 millimeters in length What is the z score for this length Round the answers to at least two decimal places Luis s z score is Part 3 of 4 c Joe caught a one year old flounder whose length had a z score of 1 3 How long was this fish Round the answer to at least one decimal place The length of Joe s fish is millimeters LE ola 10

Statistics
Statistics10 Managers rate employees according to job performance and attitude The results for several randomly selected employees are given below Use the given data to find the equation of the regression line 63 65 69 58 77 76 69 70 67 78 82 75 87 92 83 87 Performance 59 Attitude 72 64 78

Statistics
StatisticsIn a ninth grade homeroom class 3 of the 16 girls have red hair and 2 of the 15 boys have rec hair What is the probability of selecting a boy or a red haired person as homeroom representative to student council a 18 31 O b 5 31 O c 2 31 d 3 31

Statistics
StatisticsA dietician is researching two new weight gain supplements that have just hit the market Ripped and Gainz She wants to determine if there is any difference between the two supplements in the mean amount of weight gained in kg by the people who take them The dietician tracks the total weight gain in kg over a year of a random sample of 14 people taking Ripped and a random sample of 12 people taking Gainz These samples are chosen independently These data are shown in the table Ripped Gainz Send data to calculator v Total weight gains in kg 10 4 9 4 12 0 7 4 14 9 8 7 13 4 12 8 11 2 7 5 8 2 8 8 14 2 9 4 8 8 9 1 10 8 10 9 9 1 9 5 8 5 8 2 9 3 11 4 8 7 9 0 Send data to Excel Assume that the two populations of weight gains are approximately normally distributed Can the dietician conclude at the 0 10 level of significance that there is a difference between the population mean of the weights gained by people taking Ripped and the population mean of the weights gained by people taking Gainz Perform a two tailed test Then complete the parts below Carry your intermediate computations to three or more decimal places If necessary consult a list of formulas a State the null hypothesis H and the alternate hypothesis H Ho 0 H 0 b Determine the type of test statistic to use Choose one c Find the value of the test statistic Round to three or more decimal places 0 d Find the two critical values Round to three or more decimal places and YRE NO e At the 0 10 level of significance can the dietician conclude that there is a difference between the mean weight gained by people taking Ripped and the mean weight gained by people taking Gainz H X 0 0 a X S Do 0 0 OSO 020 O O P 00 A 0 0 A M

Statistics
StatisticsRyan is a human resources executive for a technology company He is deciding between two types of plans for vacation allowance for the employees of the company Unlimited and Traditional Ryan wants to determine for workers in the tech industry if the yearly mean number of vacation days taken by workers with an Unlimited plan is greater than the yearly mean number of vacation days taken by workers with a Traditional plan Ryan surveys a random sample of 17 workers who have the Unlimited plan and a random sample of 15 workers who have the Traditional plan These samples are chosen independently For each worker he records the number of vacation days taken last year For the workers with an Unlimited plan the sample mean is 18 2 with a sample variance of 24 7 For the workers with a Traditional plan the sample mean is 14 9 with a sample variance of 5 4 Assume that the two populations of vacation days taken are approximately normally distributed Can Ryan conclude at the 0 05 level of significance that the population mean of the yearly number of vacation days taken by workers with an Unlimited plan is greater than the population mean of the yearly number of vacation days taken by workers with a Traditional plan Perform a one tailed test Then complete the parts below Carry your intermediate computations to three or more decimal places If necessary consult a list of formulas a State the null hypothesis Ho and the alternate hypothesis H H 0 0 H 0 b Determine the type of test statistic to use Choose one c Find the value of the test statistic Round to three or more decimal places d Find the p value Round to three or more decimal places 0 e At the 0 05 level of significance can Ryan conclude that the yearly mean number of vacation days taken by workers with an Unlimited plan is greater than the yearly mean number of vacation days taken by workers with a Traditional plan Yo No H X 9 O S 0 0 OSO X P G B alo 0 0 0 0 20

Statistics
StatisticsYou roll a die 48 times with the following results Number Rolled 1 2 3 Frequency 4 13 2 st 4 5 6 14 13 2 Test the claim that the die is a fair die i e equal probability to roll each number with a 0 05 Explain how you tested the claim including what test you did am any calculations you made

Statistics
StatisticsThe US Census Bureau reports that 26 of all U S business are owned by women A Colorado consulting firm surveys a random sample of 410 businesses in the Denver area and finds that 115 of them have women owners Should the firm conclude that the Denver area is unusual Test an appropriate hypothesis and state your conclusions a State the appropriate null and alternative hypotheses H p 0 26 Ha p Select b Test your hypotheses and make and justify a statistical decision using the significance level of 5 p value rounded to 3 decimal places Select decision Select 0 26 c Interpret your decision in the context of the problem Conclusion There Select owners are women evidence to AN Select the claim that the Denver area is unusual in how many business

Statistics
StatisticsFaculty members at a large university have found that over the past several semesters that a cell phone rings in class on average 20 times per semester A reporter for the school newspaper claims that students are more courteous with their cell phones now than in past semesters and that the average has decreased The reporter finds that in a random sample of 19 classes the average number of times a cell phone rang last semester was 18 3 with a standard deviation of 2 7 calls Does the evidence support the reporters claim Perform a complete hypothesis test using a 5 level of significance a State the appropriate null and alternative hypotheses Ho 20 H Select 20 b Test your hypotheses and make and justify a statistical decision using the significance level of 1 Test Used Select p value rounded to 3 decimal places Select decision Select

Statistics
StatisticsAt CPU every student gets a college email address Data collected by the college showed a negative association between student grades and the number of emails the student sent during the semester Briefly explain what negative association means in this context

Statistics
ProbabilityAs a professional golfer you decide to experiment with two different golf balls Nike and Callaway After the experiment you will make a contract with one of the manufacturers and use their golf ball for the next year The experiment consists of using the driver and hitting 200 golf balls of each type and measuring the distance traveled in yards Your decision of which golf ball to use will be based upon consistency and maximal distance both of which is valued in the game of golf The box and whisker plot for each manufacturer is shown below Nike Callaway 225 220 230 240 245 250 255 5 V 252 250 260 266 268 5 270 280 280 287 290 Yards Based on these boxplots which golf balls would you use and why 300 A 305 310 2

Statistics
StatisticsA long jump competition took place recently at a local high school The coach is interested in performing as well as possible in the next competition so he is looking at the relationship between height and distance jumped both measured in inches He uses height to predict distance The data was analyzed to produce the following regression line 1 0345x 6 4852 R 82 A certain runner jumped a distance of 84 inches and is 74 inches tall What is the residual for this runner


Statistics
ProbabilityYou draw a card from a deck Find the probability round to 4 decimal places Drawing a face card Jack Queen King

Statistics
StatisticsThe statement below contains a mistake Explain the mistake with a sentence The correlation between a person s age and vision 20 20 is r 1 04

Statistics
ProbabilityAn instructor recommends to students in his introductory statistics class to spend at least 5 hours studying outside class One of the items on the student survey for this course was How many hours a week do you study for this class The instructor examined the data for men and women separately Below is the distribution of this variable for the 30 women in the class that 32CX 1 2 3 4 5 6 7 8 9 10 HOURS OF STUDY Part C Which of the following boxplots represents the same data set as the histogram shown above 2 3 Boxplot A HOURS OF STUDY 8 9 10 A B C

Statistics
StatisticsSuppose it is known that 20 of college students work full time Part A If we randomly select 12 college students what is the probability that exactly 3 of the 12 work full time Round your answer to 4 decimal places

Statistics
StatisticsSuppose our target population is very large and that our sample was realized by a method of andom selection Consider the following sample distribution Sample Frequency n 1970 Frequency 1300 1100 006 700 foe friend The sample proportion of friend is closest to 00 47295 00 313293 00 372589 0 51238 00 432057 00 231851 The standard error associated with this observed sample statistic is closest to 0 01845 00 010893 00 011161 00 01712 00 009508 00 018428 We can be 68 Confident that the proportion of friend in our population is between 00 296173 and 0 330413 00 420896 and 0 443218

Statistics
Statisticsuppose our target population is very large To each observational unit we have a two level factor ttribute called hotdogs with categories not hotdog and hotdog Consider the following inomial sampling distribution for number of hotdogs in 70 trials Binomial Sampling Distribution of number of hotdog 0 12 0 10 0 08 0 06 0 04 0 02 0 00 0 0 95 00 05 00 75 2 8 4 2 16 8 09 8 10 The population proportion of hotdog is closest to 00 2 00 5 The expected number of hotdog is closest to 012 6 014 Pr Y 56 5 is closest to 00 31856 00 99203 1e 04 00 99983 0 00367 20 30 00 98749 0 00227 Y 40 50 60 70 Using the normal or Gaussian approximation regardless of appropriateness Pr Y 56 5 is closest to

Statistics
ProbabilityFrequency 10 8 6 2 0 H 3 160 160 170 170 180 180 190 190 200 200 210 210 220 Mean yolk mass g 16 Based on the frequency distribution does a normal probability distribution reasonably model the mean yolk mass of eggs in past breeding seasons 220 17 Explain your answer to the previous question Be sure to discuss the assumptions of a normal probability distribution and why based on the frequency distribution those assumptions soom appropriate for not for modeling the mean volle mass

Statistics
StatisticsFrequency 10 8 6 4 20 160 Yolk Masses of Eggs in Past Breeding Seasons illo 11 160 170 170 180 180 190 190 200 200 210 210 220 Mean yolk mass g 220

Statistics
StatisticsSummer months You ask 20 students during the Summer months and get the following responses 0 3 4 4 7 11 8 7 3 1 5 8 10 17 12 7 4 5 0 the mean number days students travel outside verment

Statistics
StatisticsWhich of the following cannot be stored in a list in R O Nothing A list can store any object O Data Frames O Lists

Statistics
StatisticsWhat is the storage mode for any given data frame list O numeric logical O character O data frame O factor

Statistics
StatisticsWhich of the following commands will not properly extract the component of a list named Last Component with L Last Component L Last Component O L Last Component O L Last Component
Statistics
StatisticsWhat is the class for any given matrix matrix array O matrix O matrix array O array

Statistics
StatisticsWhat is the class for any given data frame data frame O integer O numeric O logical character factor O list

Statistics
StatisticsYou and your friends vote on where to go snowboarding next week You choose from Diamond Bar D Big Boulder B Arrowhead A and Camelback C Based on the preference schedule below which of the following statements is true about the pluralit winner votes 1 1 1 1 1 1 1 1st BD B C B C B 2nd ACAI 2nd A CADADA ADADA 3rd CA CB CB D 4th DB DADA C 1 point Arrowhead is the plurality winner Big Boulder is the plurality winner Diamond Bar is the plurality winner Camelback is the plura K
Statistics
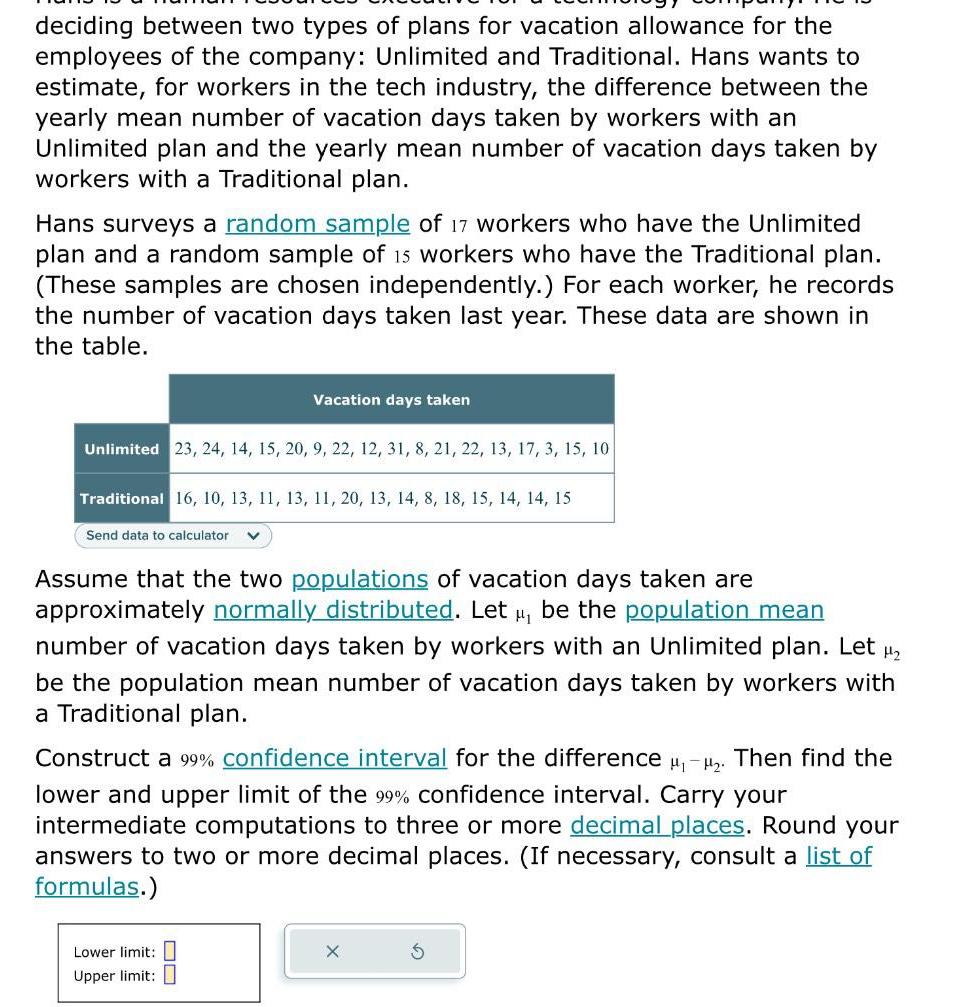
Statisticsdeciding between two types of plans for vacation allowance for the employees of the company Unlimited and Traditional Hans wants to estimate for workers in the tech industry the difference between the yearly mean number of vacation days taken by workers with an Unlimited plan and the yearly mean number of vacation days taken by workers with a Traditional plan Hans surveys a random sample of 17 workers who have the Unlimited plan and a random sample of 15 workers who have the Traditional plan These samples are chosen independently For each worker he records the number of vacation days taken last year These data are shown in the table Unlimited 23 24 14 15 20 9 22 12 31 8 21 22 13 17 3 15 10 Traditional 16 10 13 11 13 11 20 13 14 8 18 15 14 14 15 Send data to calculator V Vacation days taken Assume that the two populations of vacation days taken are approximately normally distributed Let be the population mean number of vacation days taken by workers with an Unlimited plan Let be the population mean number of vacation days taken by workers with a Traditional plan Construct a 99 confidence interval for the difference Then find the lower and upper limit of the 99 confidence interval Carry your intermediate computations to three or more decimal places Round your answers to two or more decimal places If necessary consult a list of formulas Lower limit Upper limit 8 X

Statistics
StatisticsTest scores Scores on a statistics exam had a mean of 68 with a standard deviation of 6 Scores on a calculus exam had a mean of 59 with a standard deviation of 11 Part 1 of 3 a Compute the coefficient of variation for statistics exam scores Round the answer to at least two decimal places The coefficient of variation for statistics exam scores is 0 09 Part 2 of 3 b Compute the coefficient of variation for calculus exam scores Round the answer to at least two decimal places The coefficient of variation for calculus exam scores is 0 19 Part 2 3 Part 3 of 3 c Which has greater spread relative to their mean statistics scores or calculus scores has greater spread relative to its mean SPRAUT B ol 6


Statistics
Statistics13 I noticed that the prices of avocados increased lately A few weeks ago the price for one regular avocado was on average 0 89 Below are prices in for one avocado at several randomly selected supermarkets 1 20 1 10 0 99 1 12 1 50 1 29 1 39 0 98 At 0 05 are the average process actually higher now Test using a a hypothesis test b confidence interval

Statistics
Statistics11 The chart below gives daily revenue of an ice cream truck and the temperature outside Sales 450 680 900 1000 560 120 34 120 33 Temp 70 85 88 94 78 67 50 65 54 a Calculate r and at a 0 05 determine if there is linear correlation b If there is linear correlation find the regression line c Predict the temperature outside if the truck made 600 Find the prediction interval for your prediction

Statistics
StatisticsVaccinated Vaccinated Unvaccinated and and not boosted boosted 56 Positive 30 for COVID Negative for COVID 67 56 129 28

Statistics
StatisticsLunch break In a recent survey of 618 working Americans ages 25 34 the average weekly amount spent on lunch as 44 48 with standard deviation 3 09 The weekly amounts are approximately bell shaped Part 1 of 3 a Estimate the percentage of amounts that were less than 38 30 Round the answer to one decimal place Approximately 2 5 of the amounts were less than 38 30 Part 1 3 Part 2 of 3 b Estimate the percentage of amounts that were greater than 47 57 Round the answer to one decimal place Approximately 2 5 of the amounts were greater than 47 57

Statistics
Probability14 The following data was collected at the local clinic Vaccinated Vaccinated Unvaccinated and not boosted 56 and boosted 30 Positive for COVID Negative for COVID If one patient is selected find the probability that they are a vaccinated and boosted and are positive b vaccinated and boosted or are negative c unvaccinated given that they are positive 67 56 129 28

Statistics
ProbabilityAt one high school girls can run the 100 yard dash in an average of 15 2 seconds with a standard deviation of 0 9 second The times are very closely approximated by a normal curve Find the percent of times that are 18 Between 14 3 and 16 1 seconds A 47 5 B 50 C 68 D 34

Statistics
ProbabilityAssume a Poisson distribution Find the following probabilities a Let 6 0 find P X 2 b Let 0 6 find P X 1 c Let 6 0 find P X 3 d Let 4 4 find P X 1 e Let 5 3 find P X 3 a When 6 0 P X 2 Round to three decimal places as needed

Statistics
ProbabilityGiven the probability distributions shown to the right complete the following parts a Compute the expected value for each distribution b Compute the standard deviation for each distribution c What is the probability that x will be at least 3 in Distribution A and Distribution B d Compare the results of distributions A and B a What is the expected value for distribution A P Type an integer or decimal rounded to three decimal places as needed Xi 01234 Distribution A P X x 0 54 0 20 0 14 0 10 0 02 XOTN34 X 0 1 2 Distribution B P X X 0 02 0 10 0 14 0 20 0 54
Statistics
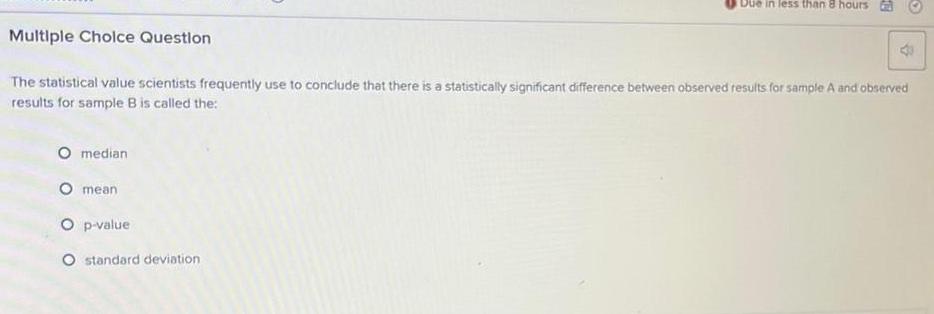
StatisticsMultiple Choice Question O median Due in less than 8 hours The statistical value scientists frequently use to conclude that there is a statistically significant difference between observed results for sample A and observed results for sample B is called the O mean O p value O standard deviation O B

Statistics
Probabilitystudent is taking a multiple choice exam in which each question has two choices Assuming that she has no knowledge of the correct answers to any of the questions she has decided on trategy in which she will place two balls marked A and B into a box She randomly selects one ball for each question and replaces the ball in the box The marking on the ball will determine nswer to the question There are six multiple choice questions on the exam Complete parts a through d below a What is the probability that she will get six questions correct Round to four decimal places as needed

Statistics
StatisticsAssume a Poisson distribution with 4 9 Find the following probabilities a X 1 a P X 1 Round to four decimal places as needed b X 1 c X 1 d
Statistics
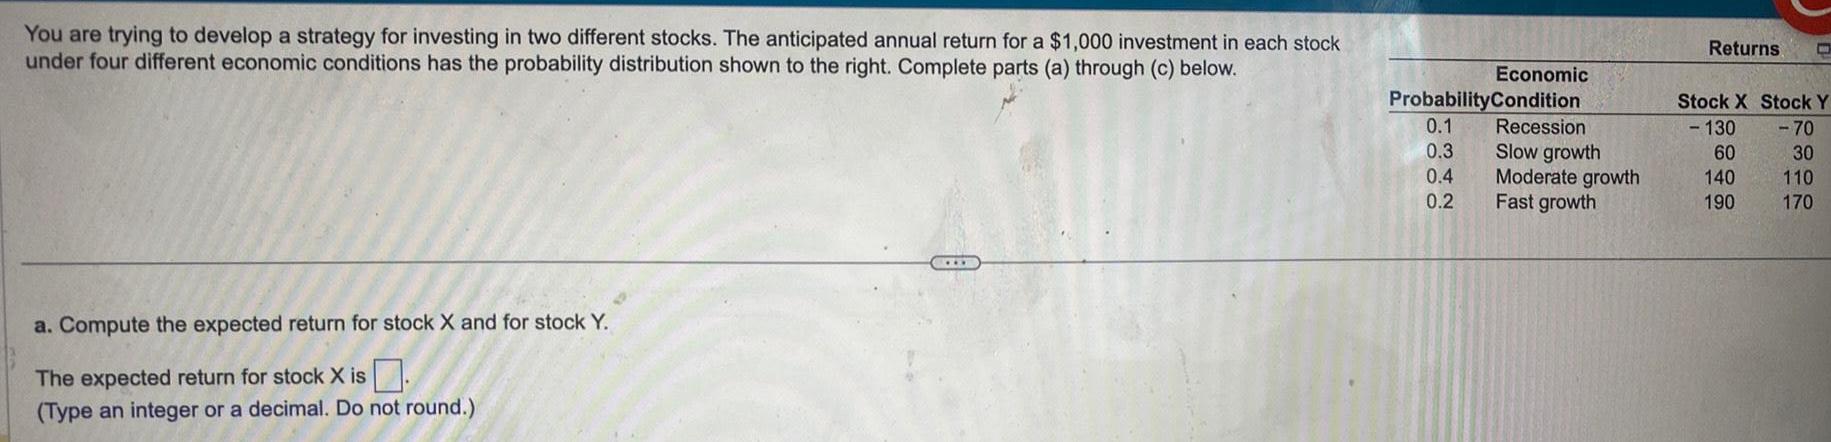
ProbabilityYou are trying to develop a strategy for investing in two different stocks The anticipated annual return for a 1 000 investment in each stock under four different economic conditions has the probability distribution shown to the right Complete parts a through c below a Compute the expected return for stock X and for stock Y The expected return for stock X is Type an integer or a decimal Do not round Economic Probability Condition 0 1 Recession 0 3 Slow growth 0 4 Moderate growth 0 2 Fast growth Returns C Stock X Stock Y 130 70 60 30 140 110 190 170