Statistics Questions
The best high school and college tutors are just a click away, 24×7! Pick a subject, ask a question, and get a detailed, handwritten solution personalized for you in minutes. We cover Math, Physics, Chemistry & Biology.
Statistics
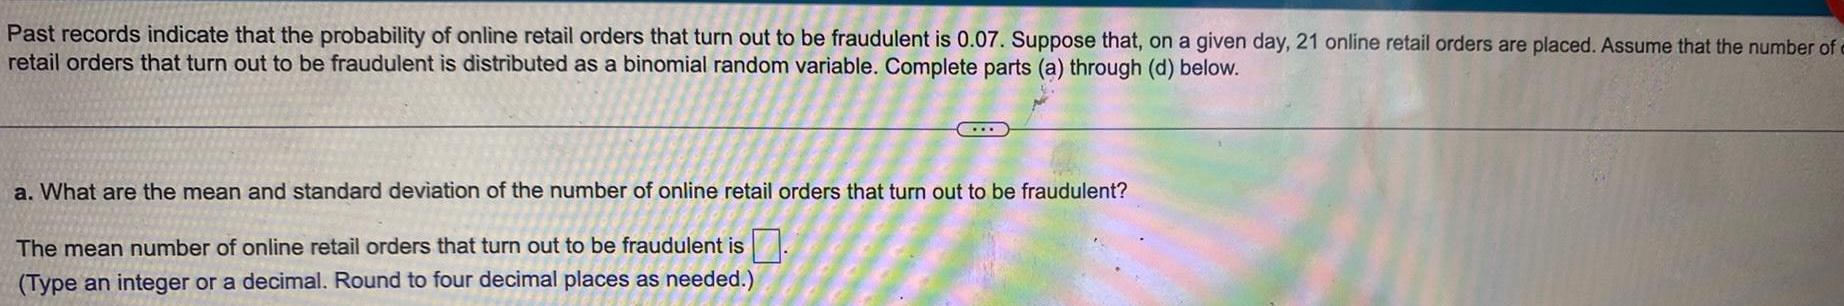
StatisticsPast records indicate that the probability of online retail orders that turn out to be fraudulent is 0 07 Suppose that on a given day 21 online retail orders are placed Assume that the number of retail orders that turn out to be fraudulent is distributed as a binomial random variable Complete parts a through d below a What are the mean and standard deviation of the number of online retail orders that turn out to be fraudulent The mean number of online retail orders that turn out to be fraudulent is Type an integer or a decimal Round to four decimal places as needed
Statistics
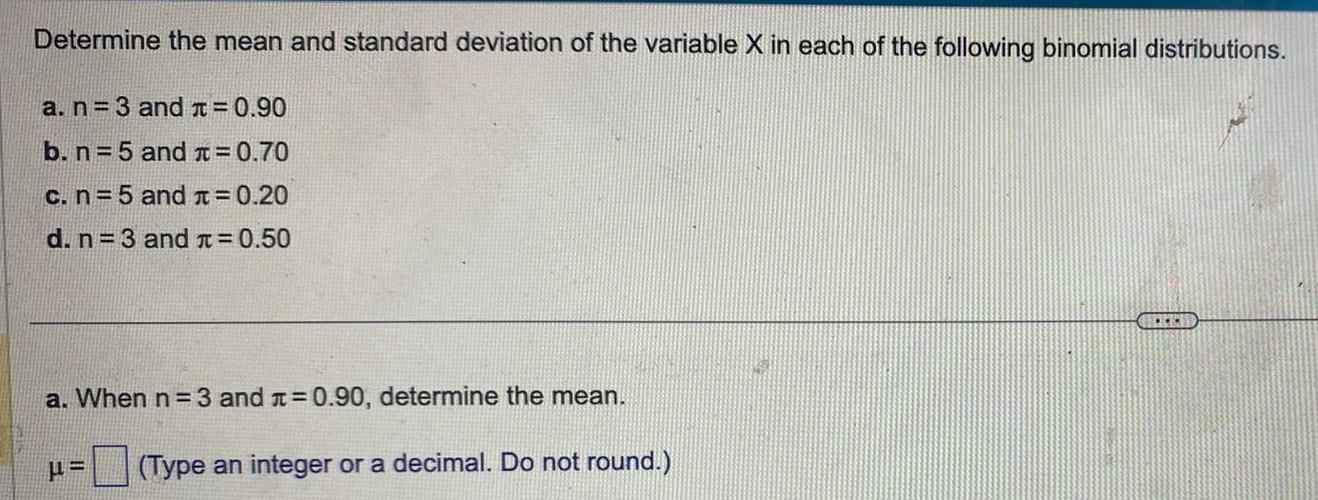
StatisticsDetermine the mean and standard deviation of the variable X in each of the following binomial distributions a n 3 and 0 90 b n 5 and 0 70 c n 5 and 0 20 d n 3 and 0 50 a When n 3 and 0 90 determine the mean Type an integer or a decimal Do not round BOCK
Statistics
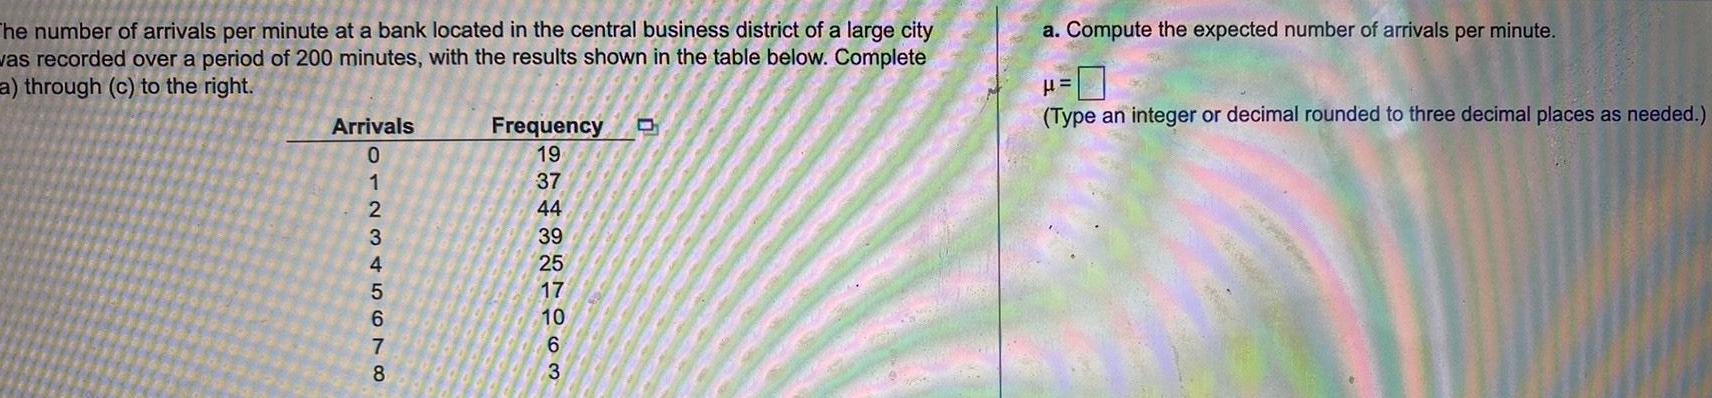
StatisticsThe number of arrivals per minute at a bank located in the central business district of a large city was recorded over a period of 200 minutes with the results shown in the table below Complete a through c to the right Arrivals 012345678 Frequency 19 37 44 39 25 17 10 6 3 D a Compute the expected number of arrivals per minute Type an integer or decimal rounded to three decimal places as needed
Statistics
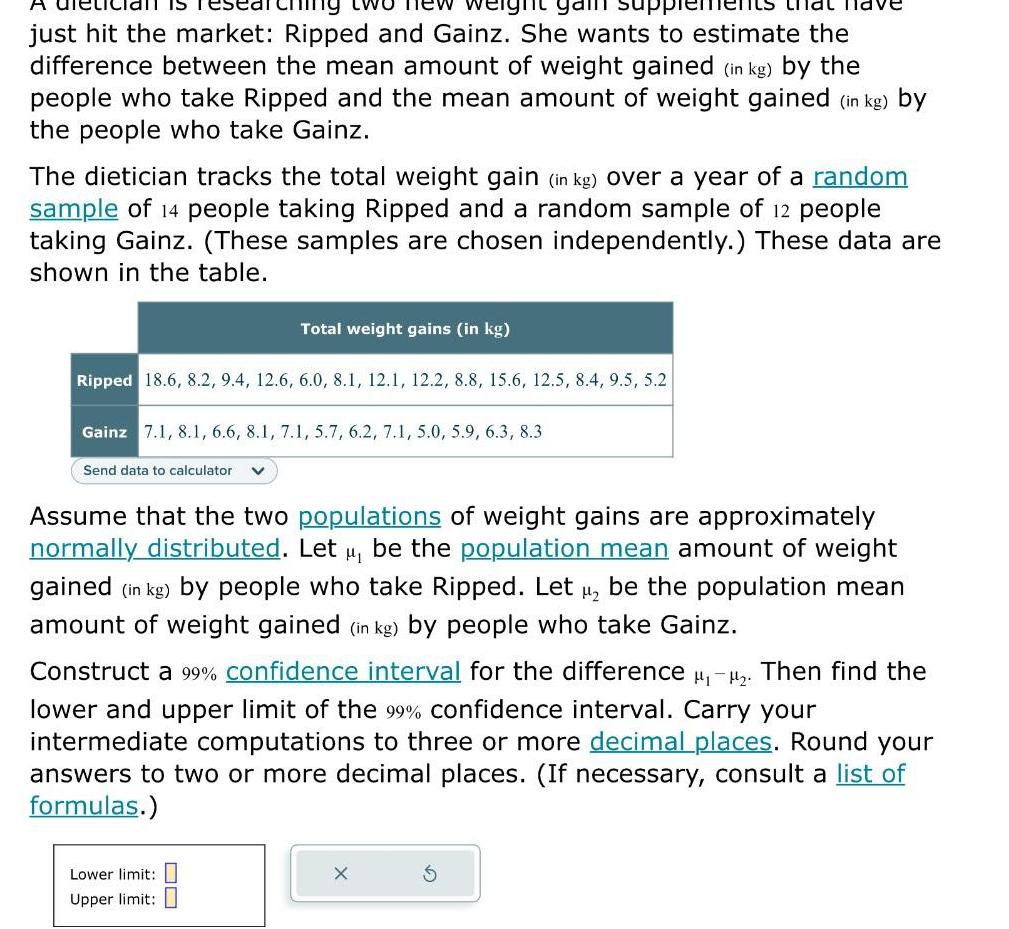
Statisticswo new eight gam su just hit the market Ripped and Gainz She wants to estimate the difference between the mean amount of weight gained in kg by the people who take Ripped and the mean amount of weight gained in kg by the people who take Gainz The dietician tracks the total weight gain in kg over a year of a random sample of 14 people taking Ripped and a random sample of 12 people taking Gainz These samples are chosen independently These data are shown in the table IS Ripped 18 6 8 2 9 4 12 6 6 0 8 1 12 1 12 2 8 8 15 6 12 5 8 4 9 5 5 2 Gainz 7 1 8 1 6 6 8 1 7 1 5 7 6 2 7 1 5 0 5 9 6 3 8 3 Send data to calculator Total weight gains in kg Assume that the two populations of weight gains are approximately normally distributed Let be the population mean amount of weight gained in kg by people who take Ripped Let H be the population mean amount of weight gained in kg by people who take Gainz Lower limit Construct a 99 confidence interval for the difference Then find the lower and upper limit of the 99 confidence interval Carry your intermediate computations to three or more decimal places Round your answers to two or more decimal places If necessary consult a list of formulas Upper limit 80 X 3
Statistics
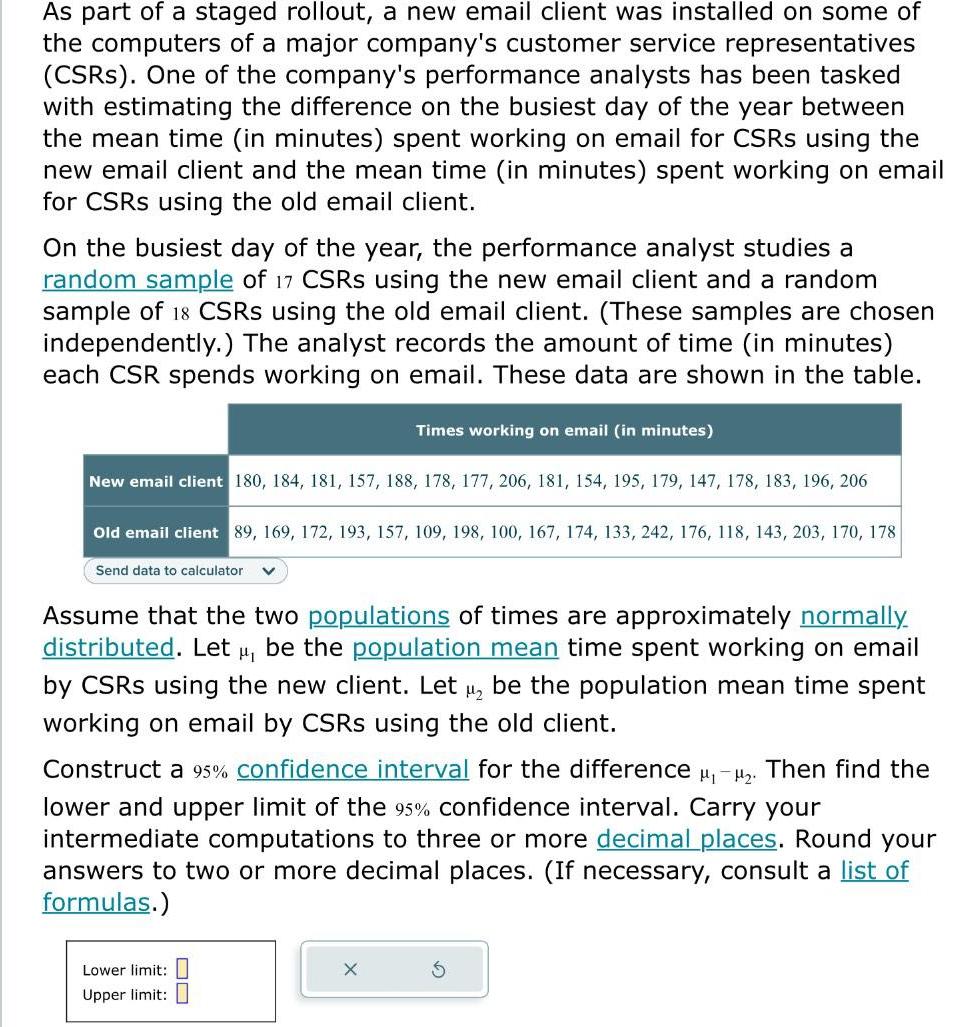
StatisticsAs part of a staged rollout a new email client was installed on some of the computers of a major company s customer service representatives CSRs One of the company s performance analysts has been tasked with estimating the difference on the busiest day of the year between the mean time in minutes spent working on email for CSRS using the new email client and the mean time in minutes spent working on email for CSRS using the old email client On the busiest day of the year the performance analyst studies a random sample of 17 CSRS using the new email client and a random sample of 18 CSRS using the old email client These samples are chosen independently The analyst records the amount of time in minutes each CSR spends working on email These data are shown in the table New email client 180 184 181 157 188 178 177 206 181 154 195 179 147 178 183 196 206 Old email client 89 169 172 193 157 109 198 100 167 174 133 242 176 118 143 203 170 178 Send data to calculator V Times working on email in minutes Assume that the two populations of times are approximately normally distributed Let be the population mean time spent working on email by CSRS using the new client Let be the population mean time spent working on email by CSRS using the old client Construct a 95 confidence interval for the difference Then find the lower and upper limit of the 95 confidence interval Carry your intermediate computations to three or more decimal places Round your answers to two or more decimal places If necess ry consult a list of formulas Lower limit Upper limit X

Statistics
StatisticsOn January 1 2017 the minimum wage for employers with 26 employees or more was 10 50 hour On January 1 2022 the minimum wage for employers with 26 employees or more was 15 00 hour Let W be the minimum wage and t be the year measured in years since 2017 Use this information to answer the questions below
Statistics
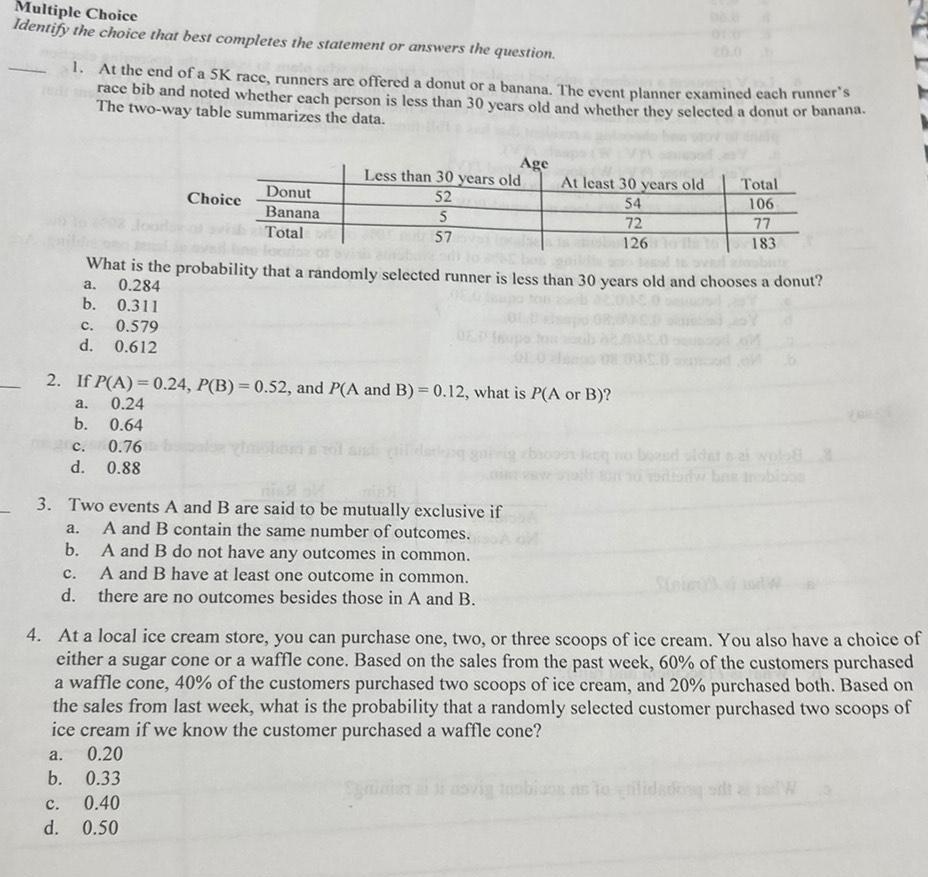
ProbabilityMultiple Choice Identify the choice that best completes the statement or answers the question 1 At the end of a 5K race runners are offered a donut or a banana The event planner examined each runner s race bib and noted whether each person is less than 30 years old and whether they selected a donut or banana The two way table summarizes the data 0 311 C 0 579 d 0 612 a Choice b Donut Banana Total 2 If P A 0 24 P B 0 52 and P A and B 0 12 what is P A or B a 0 24 b 0 64 c 0 76 d 0 88 Age Less than 30 years old At least 30 years old 52 54 5 57 3 Two events A and B are said to be mutually exclusive if A and B contain the same number of outcomes What is the probability that a randomly selected runner is less than 30 years old and chooses a donut a 0 284 b A and B do not have any outcomes in common C A and B have at least one outcome in common d there are no outcomes besides those in A and B C 0 40 d 0 50 72 126 Total 106 77 183 4 At a local ice cream store you can purchase one two or three scoops of ice cream You also have a choice of either a sugar cone or a waffle cone Based on the sales from the past week 60 of the customers purchased a waffle cone 40 of the customers purchased two scoops of ice cream and 20 purchased both Based on the sales from last week what is the probability that a randomly selected customer purchased two scoops of ice cream if we know the customer purchased a waffle cone a 0 20 b 0 33
Statistics
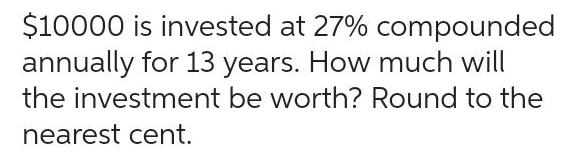
Statistics10000 is invested at 27 compounded annually for 13 years How much will the investment be worth Round to the nearest cent
Statistics
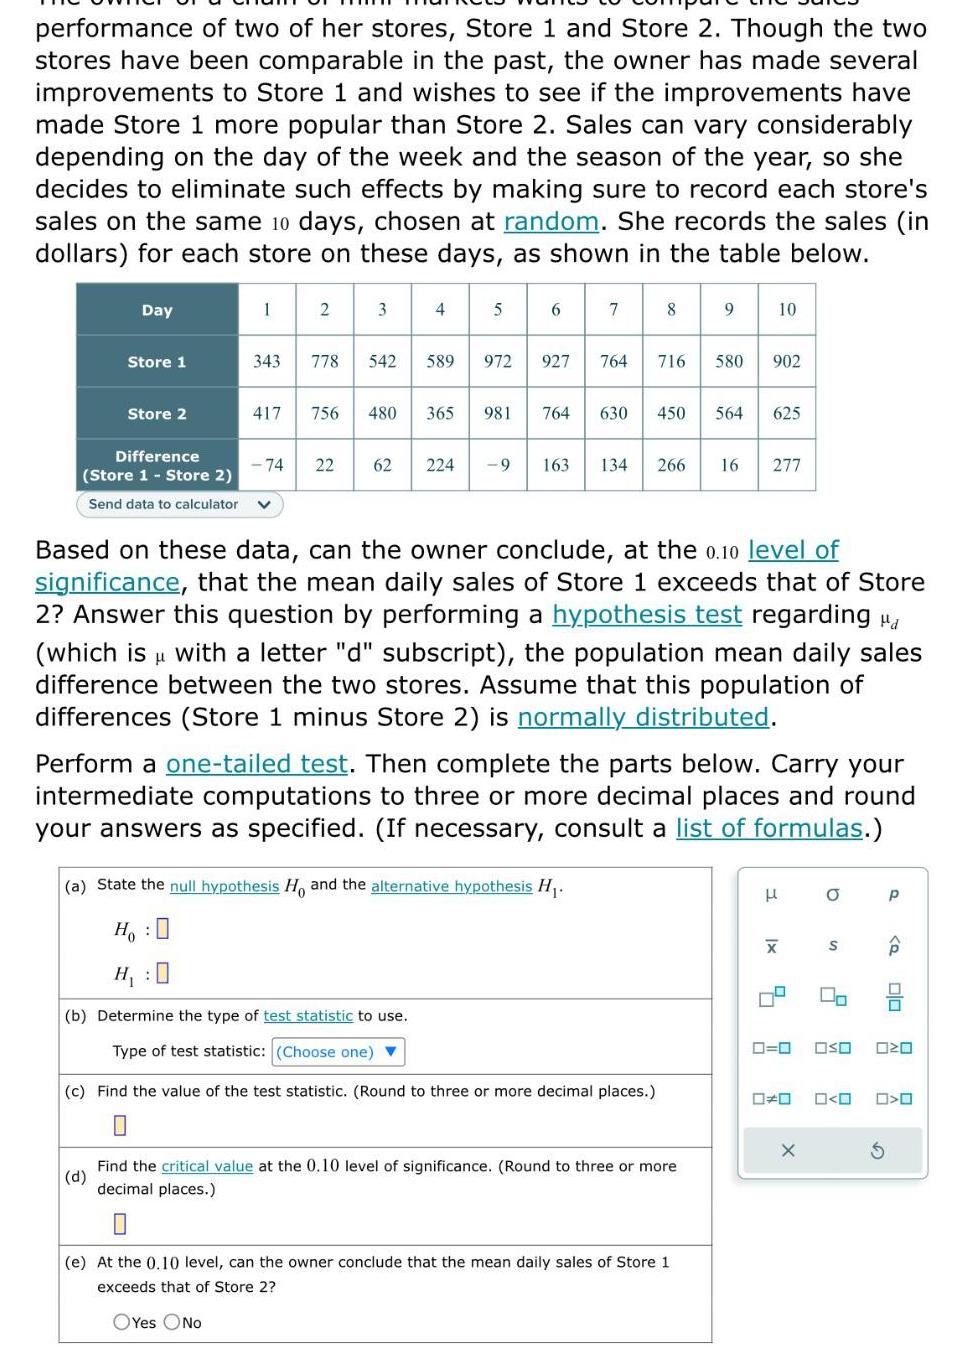
Statisticsperformance of two of her stores Store 1 and Store 2 Though the two stores have been comparable in the past the owner has made several improvements to Store 1 and wishes to see if the improvements have made Store 1 more popular than Store 2 Sales can vary considerably depending on the day of the week and the season of the year so she decides to eliminate such effects by making sure to record each store s sales on the same 10 days chosen at random She records the sales in dollars for each store on these days as shown in the table below Day Store 1 Store 2 Difference Store 1 Store 2 Send data to calculator 1 343 2 74 778 3 542 4 589 417 756 480 365 5 972 981 22 62 224 9 6 7 8 927 764 716 580 902 764 630 450 564 625 9 163 134 266 16 277 Based on these data can the owner conclude at the 0 10 level of significance that the mean daily sales of Store 1 exceeds that of Store 2 Answer this question by performing a hypothesis test regarding H which is with a letter d subscript the population mean daily sales difference between the two stores Assume that this population of differences Store 1 minus Store 2 is normally distributed a State the null hypothesis Ho and the alternative hypothesis H H H b Determine the type of test statistic to use Type of test statistic Choose one c Find the value of the test statistic Round to three or more decimal places Perform a one tailed test Then complete the parts below Carry your intermediate computations to three or more decimal places and round your answers as specified If necessary consult a list of formulas d Find the critical value at the 0 10 level of significance Round to three or more decimal places e At the 0 10 level can the owner conclude that the mean daily sales of Store 1 exceeds that of Store OYes No H Ix X 0 0 0 0 X O S OSO 0 0 P P S 010 030 O
Statistics
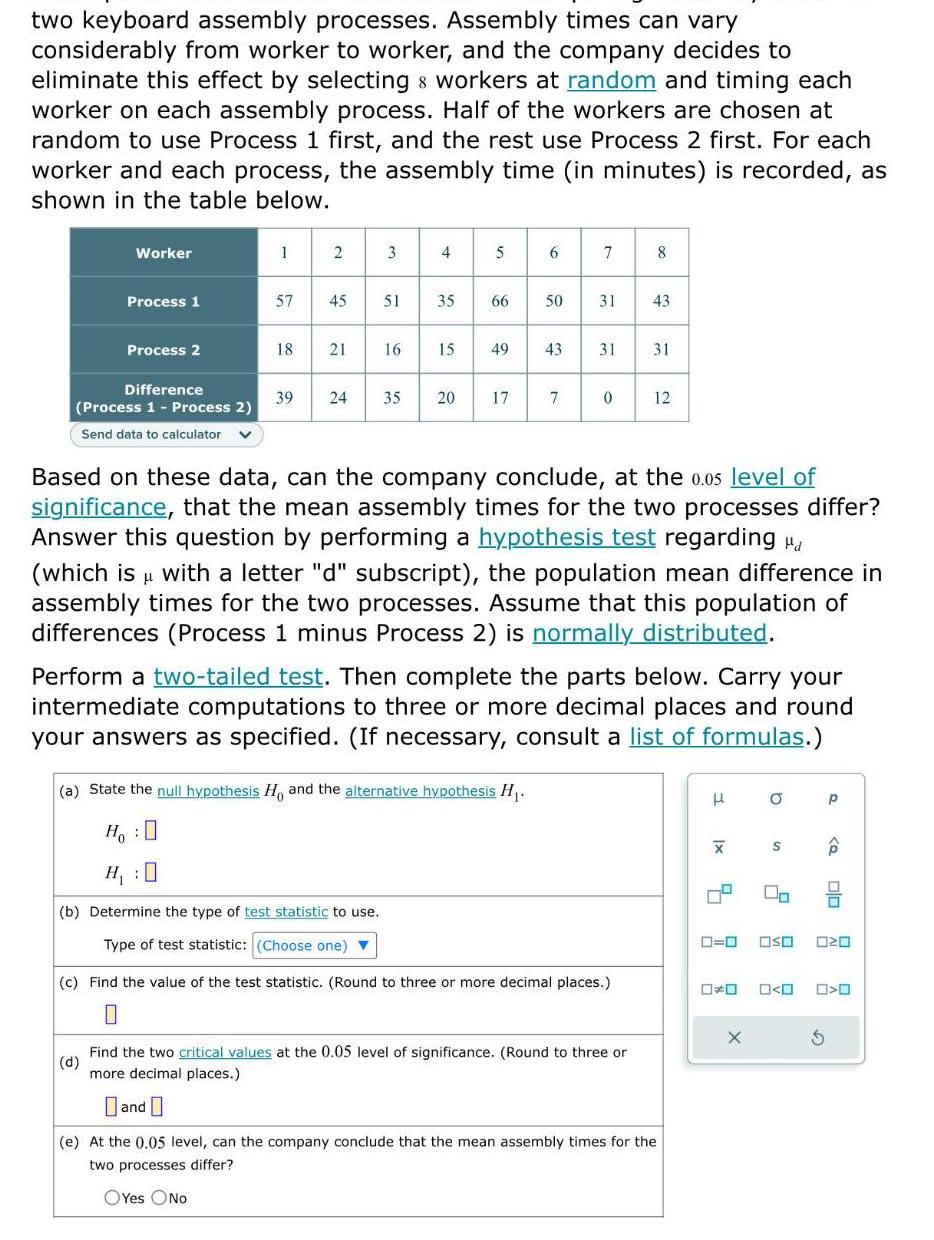
Statisticstwo keyboard assembly processes Assembly times can vary considerably from worker to worker and the company decides to eliminate this effect by selecting workers at random and timing each worker on each assembly process Half of the workers are chosen at random to use Process 1 first and the rest use Process 2 first For each worker and each process the assembly time in minutes is recorded as shown in the table below Worker Process 1 Process 2 Difference Process 1 Process 2 Send data to calculator 1 2 3 57 45 51 18 21 16 4 35 15 39 24 35 20 5 66 17 6 49 43 50 31 a State the null hypothesis Ho and the alternative hypothesis H Ho H 0 b Determine the type of test statistic to use Type of test statistic Choose one 7 7 0 8 31 31 43 Based on these data can the company conclude at the 0 05 level of significance that the mean assembly times for the two processes differ Answer this question by performing a hypothesis test regarding d L which is with a letter d subscript the population mean difference in assembly times for the two processes Assume that this population of differences Process 1 minus Process 2 is normally distributed c Find the value of the test statistic Round to three or more decimal places 0 12 Perform a two tailed test Then complete the parts below Carry your intermediate computations to three or more decimal places and round your answers as specified If necessary consult a list of formulas d Find the two critical values at the 0 05 level of significance Round to three or more decimal places and e At the 0 05 level can the company conclude that the mean assembly times for the two processes differ OYes No H x 0 0 O 4 2 X S OSO 0 0 P S Q olo OZO O
Statistics
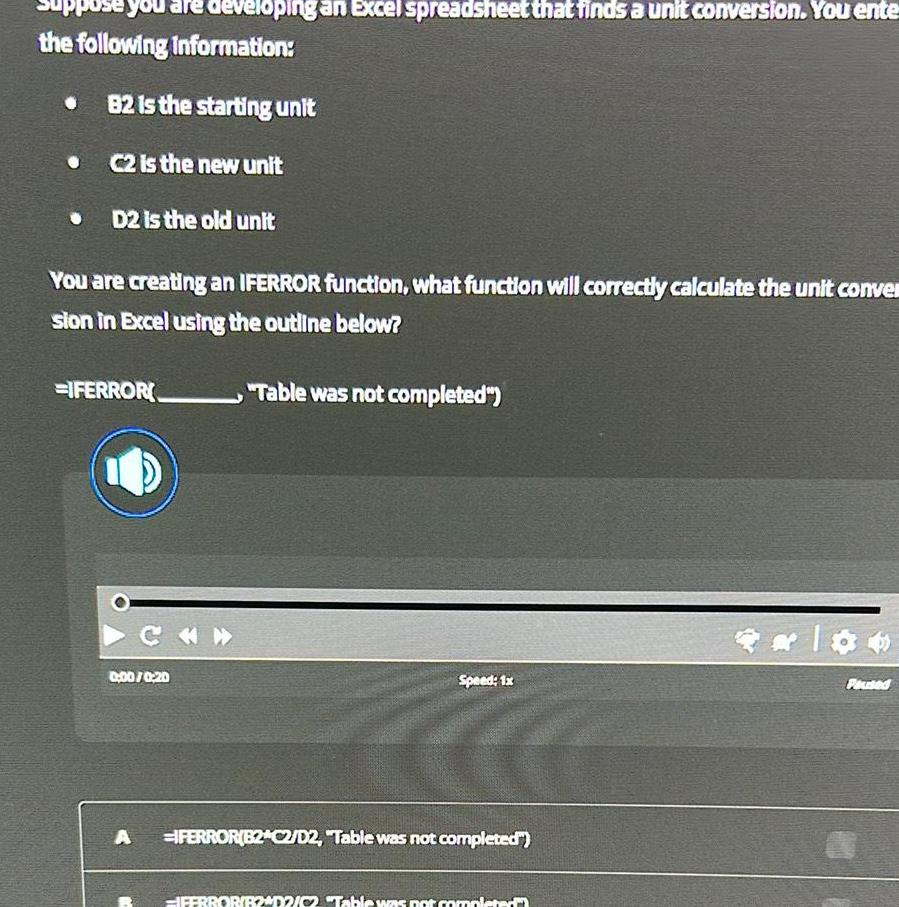
Statisticspuse you are developing an Excel spreadsheet that finds a unit conversion You ente the following information B2 is the starting unit C2 is the new unit D2 is the old unit You are creating an IFERROR function what function will correctly calculate the unit conve sion in Excel using the outline below IFERROR CH 0 00 0 20 A Table was not completed Speed 1x IFERROR B2 C2 D2 Table was not completed IFERROR B2 02 02 Table was not completed Paused
Statistics
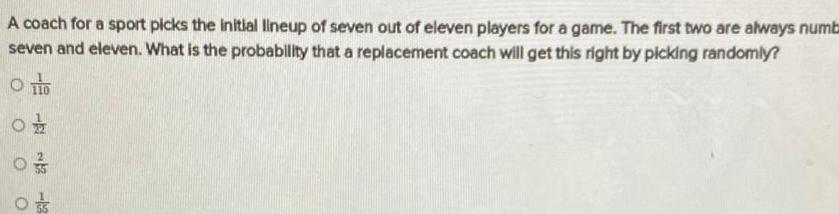
StatisticsA coach for a sport picks the initial lineup of seven out of eleven players for a game The first two are always numb seven and eleven What is the probability that a replacement coach will get this right by picking randomly O TO 0 03 1 O O 2 12 05
Statistics
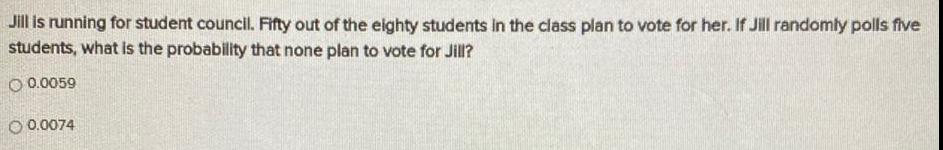
ProbabilityJill is running for student council Fifty out of the eighty students in the class plan to vote for her If Jill randomly polls five students what is the probability that none plan to vote for Jill O 0 0059 O 0 0074
Statistics
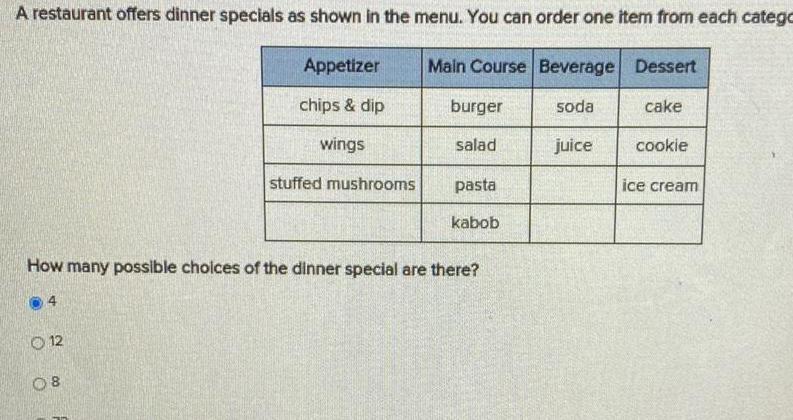
ProbabilityA restaurant offers dinner specials as shown in the menu You can order one item from each catego 12 Appetizer chips dip wings 08 stuffed mushrooms Main Course Beverage Dessert burger salad pasta How many possible choices of the dinner special are there kabob soda juice cake cookie ice cream
Statistics
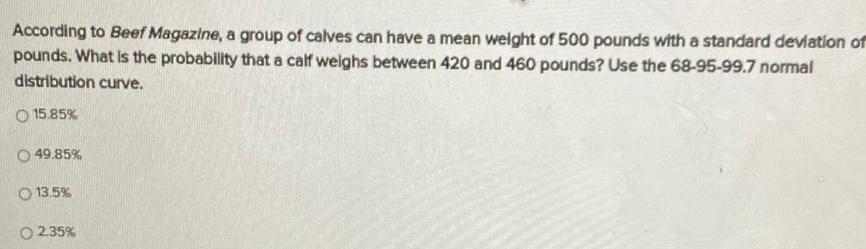
StatisticsAccording to Beef Magazine a group of calves can have a mean weight of 500 pounds with a standard deviation of pounds What is the probability that a calf weighs between 420 and 460 pounds Use the 68 95 99 7 normal distribution curve O 15 85 49 85 O 13 5 O2 35
Statistics
StatisticsSam feels that students score better on math tests that take place on Fridays The school provides Sam with the school math test average but they cannot separate them by date taken The school is too large for him to ask every student se he randomly selects a sample of willing students test scores after the next Friday s math test He uses the method of hypothesis testing to compare the Friday scores against the true average of all scores Frame the correct set of hypotheses for his research Decide where the rejection region will lie
Statistics
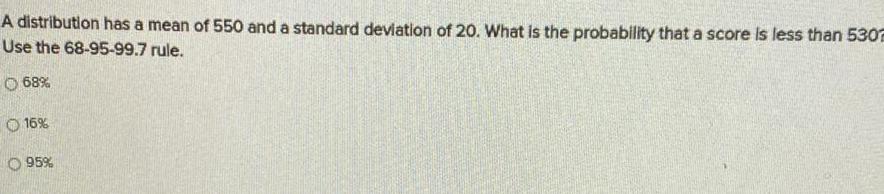
StatisticsA distribution has a mean of 550 and a standard deviation of 20 What is the probability that a score is less than 5302 Use the 68 95 99 7 rule O 68 16 O 95
Statistics
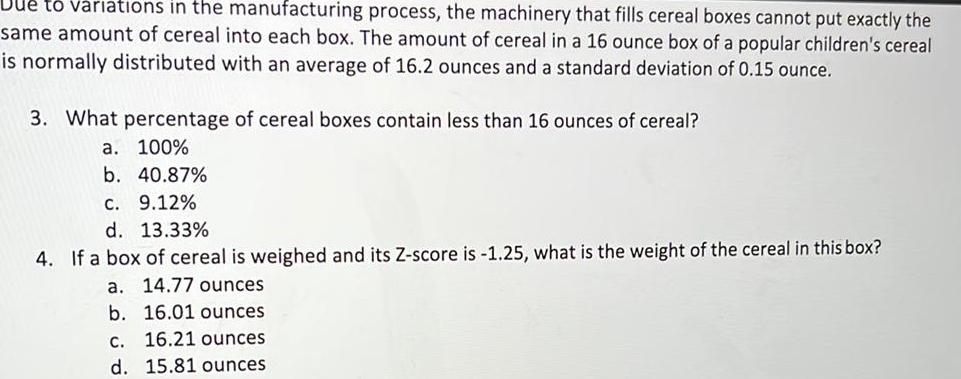
StatisticsDue to variations in the manufacturing process the machinery that fills cereal boxes cannot put exactly the same amount of cereal into each box The amount of cereal in a 16 ounce box of a popular children s cereal is normally distributed with an average of 16 2 ounces and a standard deviation of 0 15 ounce 3 What percentage of cereal boxes contain less than 16 ounces of cereal a 100 b 40 87 c 9 12 d 13 33 4 If a box of cereal is weighed and its Z score is 1 25 what is the weight of the cereal in this box a 14 77 ounces b 16 01 ounces c 16 21 ounces d 15 81 ounces
Statistics
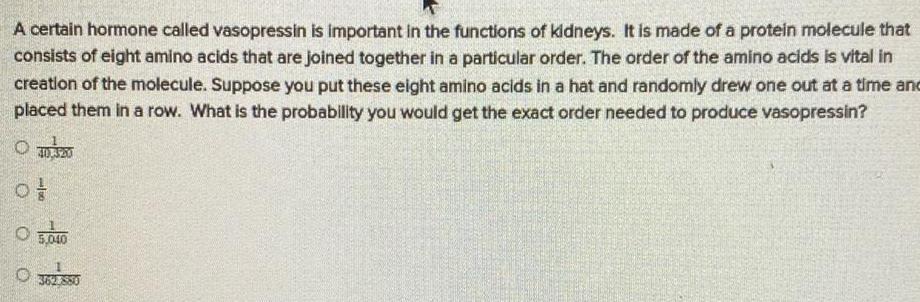
StatisticsA certain hormone called vasopressin is important in the functions of kidneys It is made of a protein molecule that consists of eight amino acids that are joined together in a particular order The order of the amino acids is vital in creation of the molecule Suppose you put these eight amino acids in a hat and randomly drew one out at a time and placed them in a row What is the probability you would get the exact order needed to produce vasopressin of 0 5 040 800
Statistics
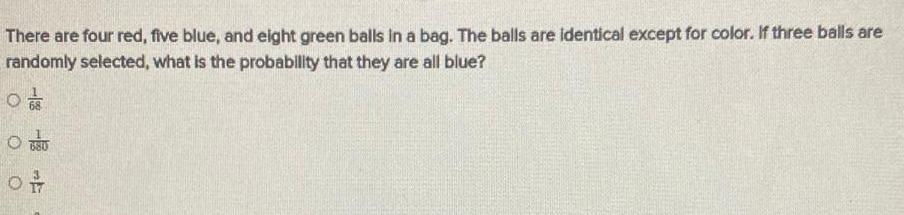
ProbabilityThere are four red five blue and eight green balls in a bag The balls are identical except for color If three balls are randomly selected what is the probability that they are all blue O O OF
Statistics
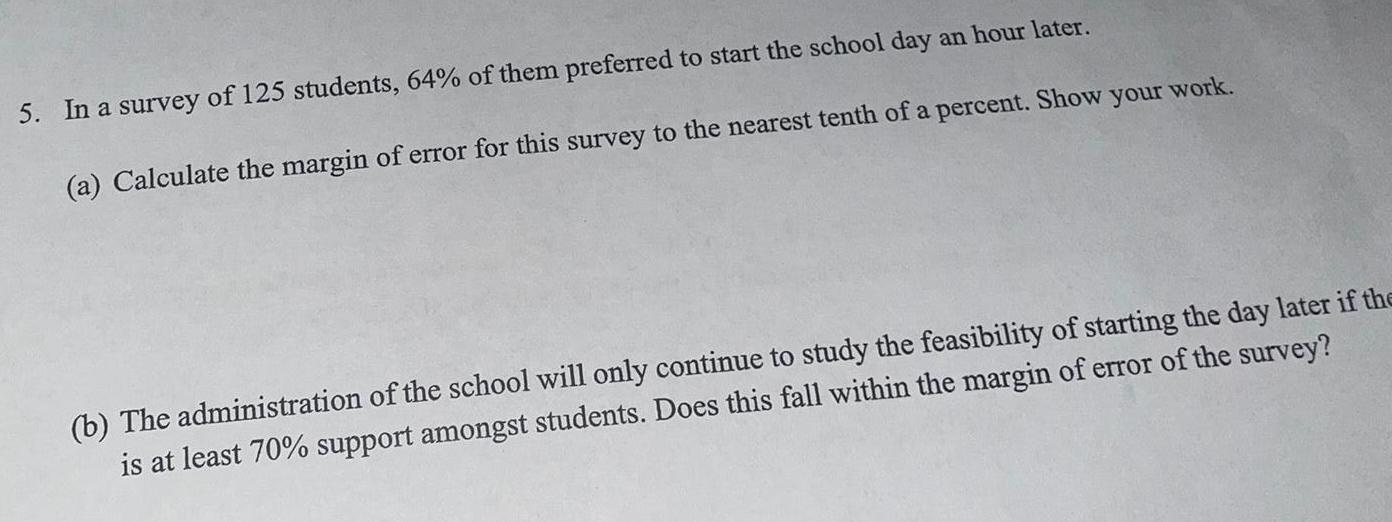
Statistics5 In a survey of 125 students 64 of them preferred to start the school day an hour later a Calculate the margin of error for this survey to the nearest tenth of a percent Show your work b The administration of the school will only continue to study the feasibility of starting the day later if the is at least 70 support amongst students Does this fall within the margin of error of the survey
Statistics
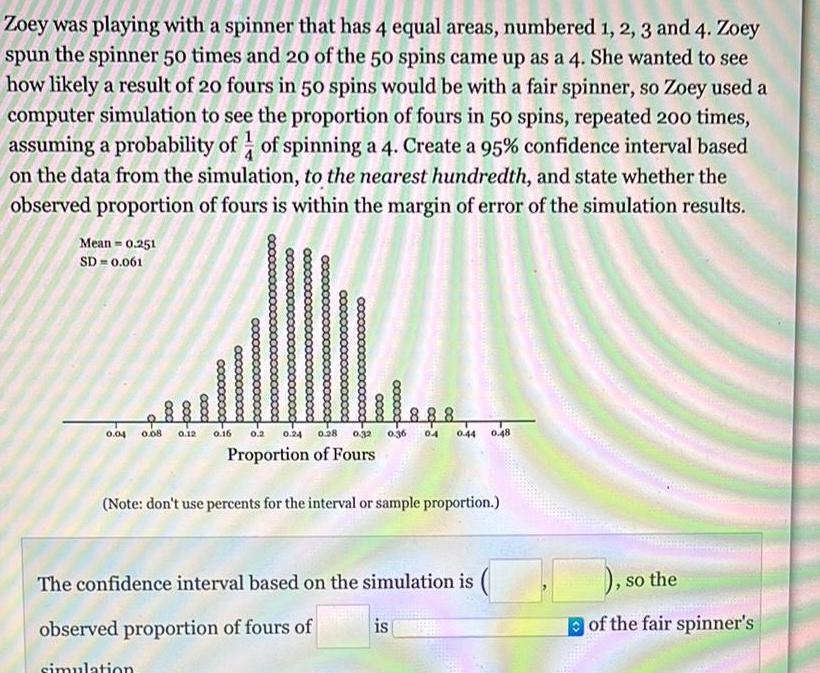
StatisticsZoey was playing with a spinner that has 4 equal areas numbered 1 2 3 and 4 Zoey spun the spinner 50 times and 20 of the 50 spins came up as a 4 She wanted to see how likely a result of 20 fours in 50 spins would be with a fair spinner so Zoey used a computer simulation to see the proportion of fours in 50 spins repeated 200 times assuming a probability of of spinning a 4 Create a 95 confidence interval based on the data from the simulation to the nearest hundredth and state whether the observed proportion of fours is within the margin of error of the simulation results Mean 0 251 SD 0 061 booo 0 04 0 08 0 12 0 16 888 0 2 0 24 0 28 0 32 0 36 0 4 0 44 0 48 Proportion of Fours cxxxxx Note don t use percents for the interval or sample proportion The confidence interval based on the simulation is observed proportion of fours of simulation is so the of the fair spinner s
Statistics
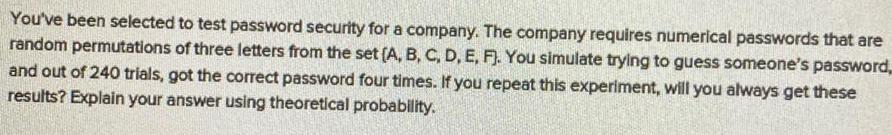
StatisticsYou ve been selected to test password security for a company The company requires numerical passwords that are random permutations of three letters from the set A B C D E F You simulate trying to guess someone s password and out of 240 trials got the correct password four times If you repeat this experiment will you always get these results Explain your answer using theoretical probability
Statistics
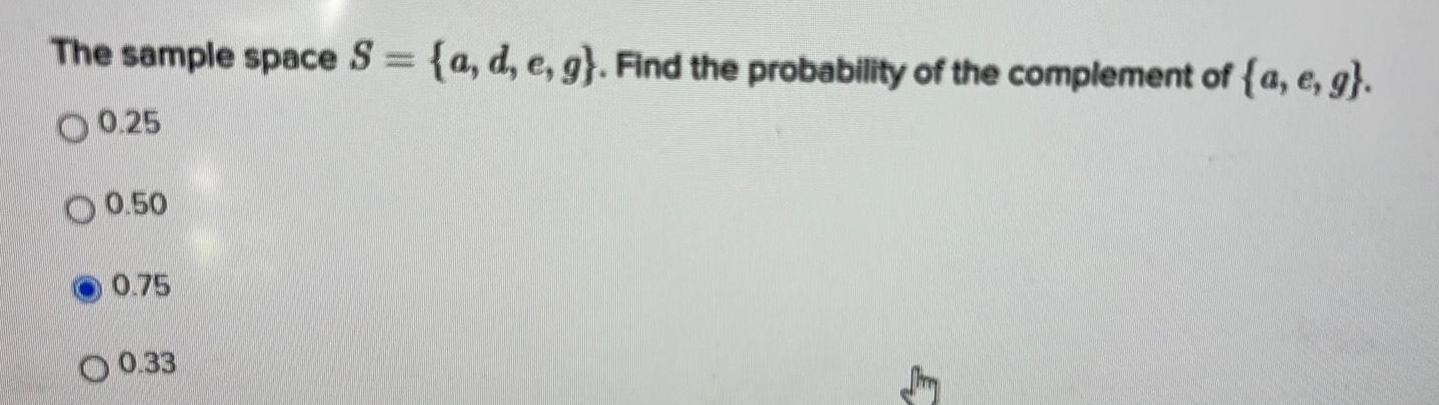
StatisticsThe sample space S a d e g Find the probability of the complement of a e g 00 25 O 0 50 0 75 0 33 E
Statistics
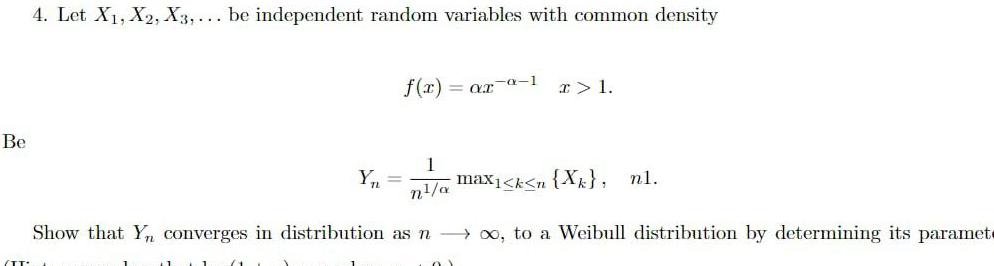
StatisticsBe 4 Let X X2 X3 be independent random variables with common density Y f x ar a 1 I 1 1 n a max k n X nl Show that Yn converges in distribution as no to a Weibull distribution by determining its paramet
Statistics
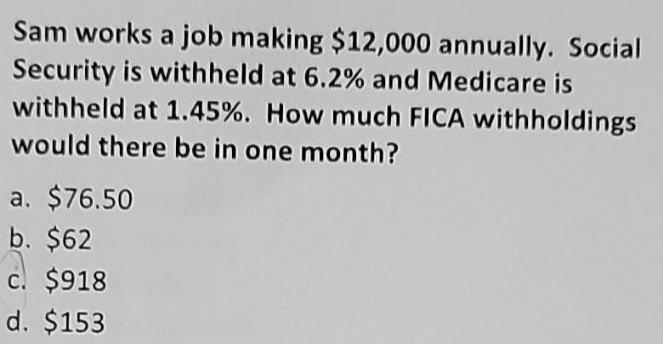
StatisticsSam works a job making 12 000 annually Social Security is withheld at 6 2 and Medicare is withheld at 1 45 How much FICA withholdings would there be in one month a 76 50 b 62 c 918 d 153
Statistics
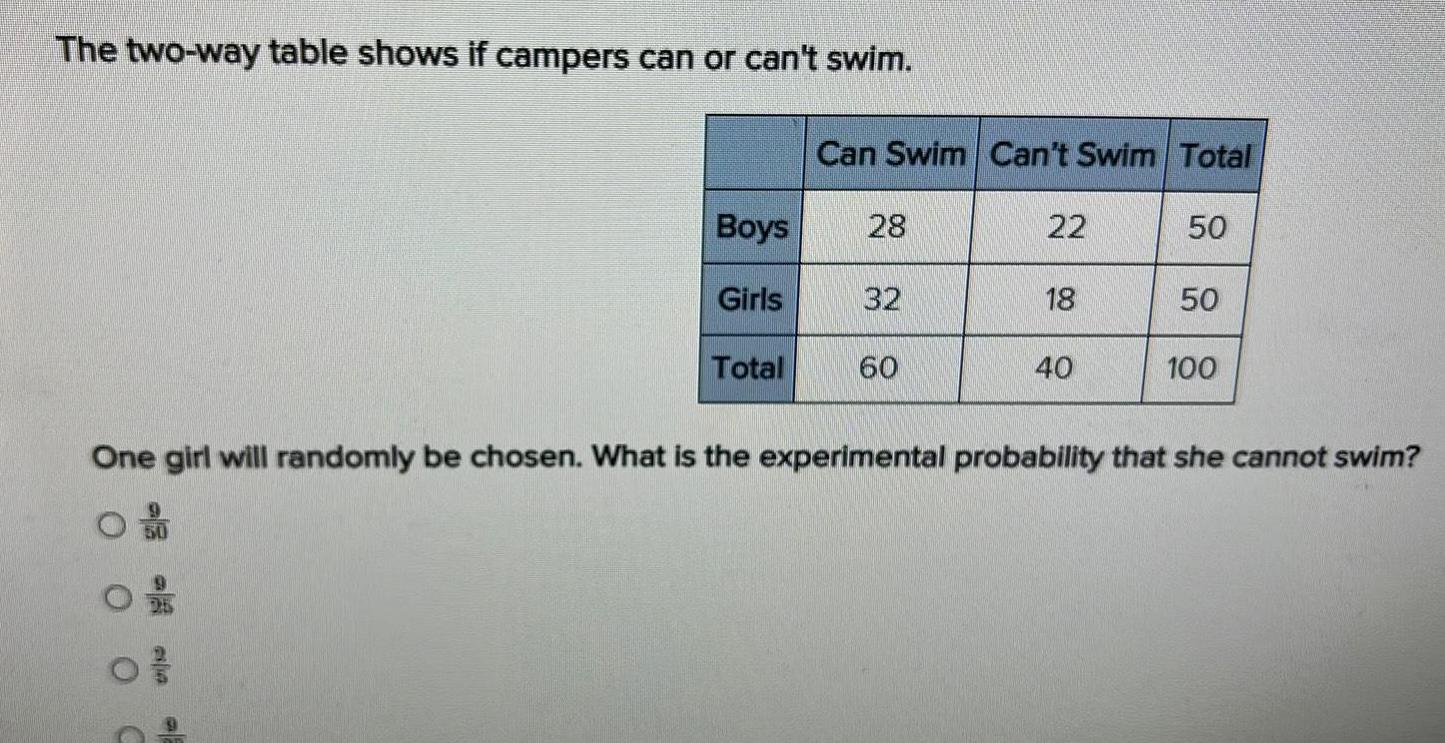
ProbabilityThe two way table shows if campers can or can t swim Boys Girls Total Can Swim Can t Swim Total 28 32 60 22 18 40 50 50 100 One girl will randomly be chosen What is the experimental probability that she cannot swim
Statistics
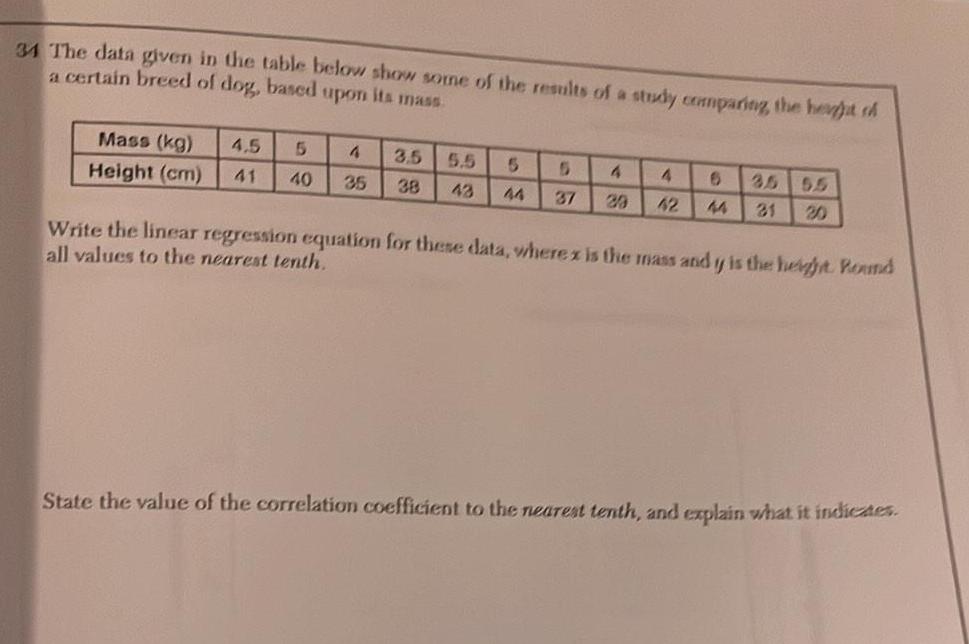
Statistics34 The data given in the table below show some of the results of a study comparing the height ch a certain breed of dog based upon its mass Mass kg Height cm 4 5 5 41 40 4 35 3 5 38 5 5 5 5 4 4 6 43 44 37 29 42 44 31 35 55 Write the linear regression equation for these data wherex is the mass and y is the height Round all values to the nearest tenth State the value of the correlation coefficient to the nearest tenth and explain what it indicates
Statistics
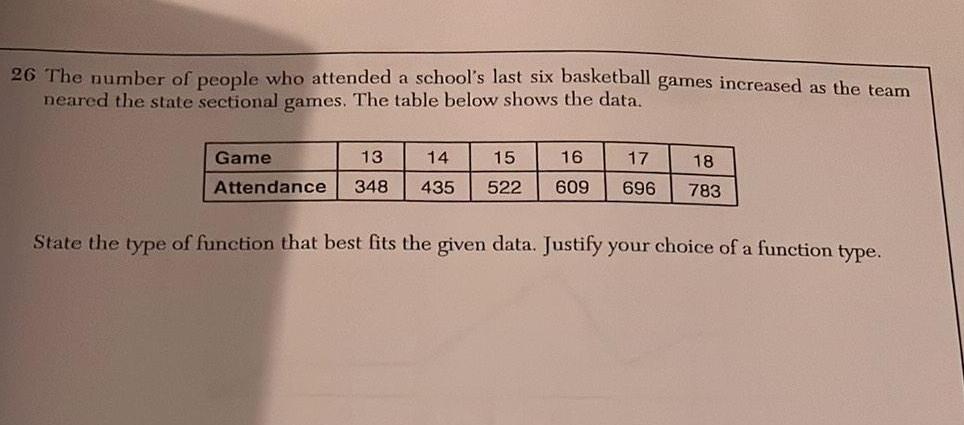
Statistics26 The number of people who attended a school s last six basketball games increased as the team neared the state sectional games The table below shows the data Game Attendance 13 14 15 16 17 348 435 522 609 696 18 783 State the type of function that best fits the given data Justify your choice of a function type
Statistics
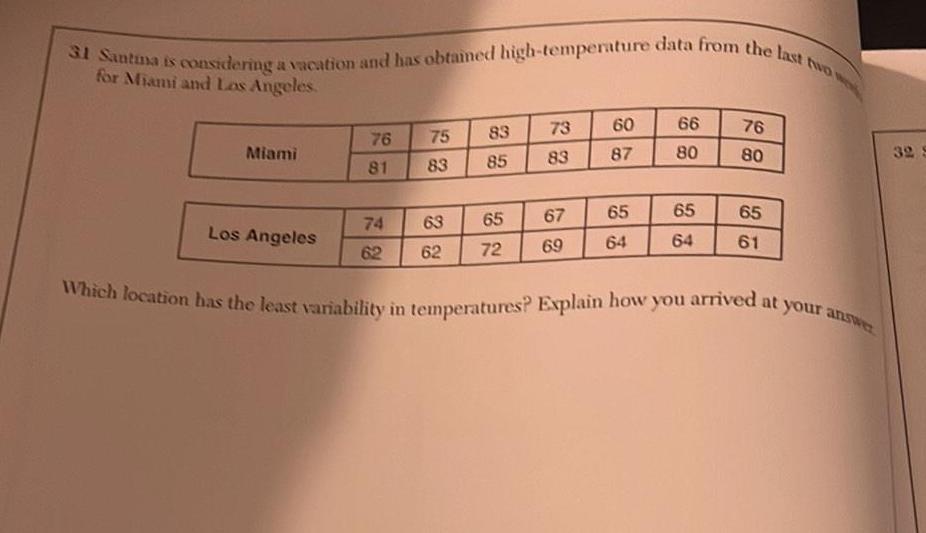
Probability31 Santia is considering a vacation and has obtained high temperature data from the last two we for Miami and Los Angeles Miami Los Angeles 76 81 74 75 83 63 62 83 85 65 72 73 83 67 69 60 87 65 64 66 80 65 64 76 80 65 61 Which location has the least variability in temperatures Explain how you arrived at your answer 32 S
Statistics
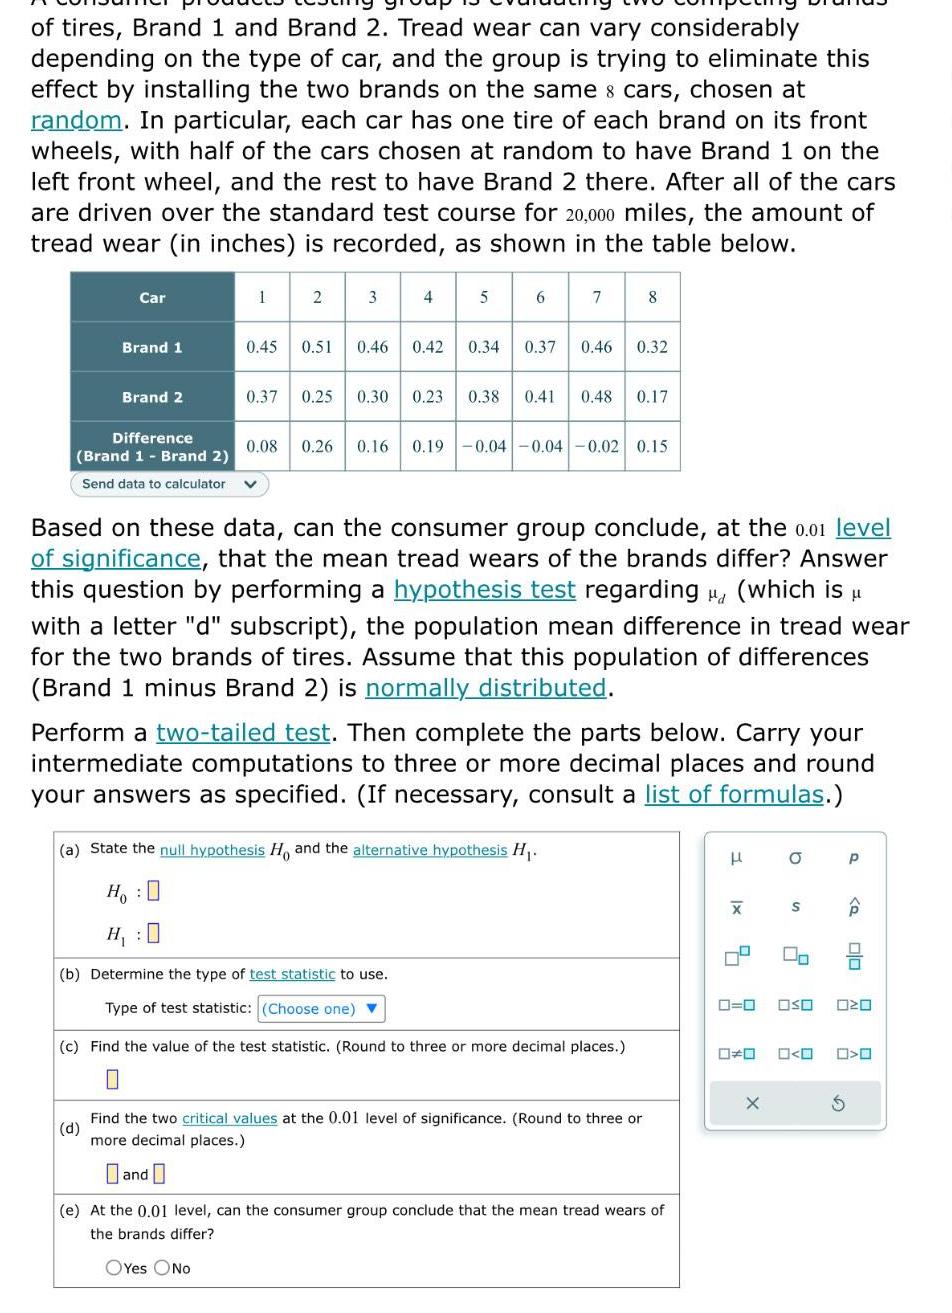
Statisticsof tires Brand 1 and Brand 2 Tread wear can vary considerably depending on the type of car and the group is trying to eliminate this effect by installing the two brands on the same cars chosen at random In particular each car has one tire of each brand on its front wheels with half of the cars chosen at random to have Brand 1 on the left front wheel and the rest to have Brand 2 there After all of the cars are driven over the standard test course for 20 000 miles the amount of tread wear in inches is recorded as shown in the table below 34 4 Car Brand 1 Brand 2 Difference Brand 1 Brand 2 Send data to calculator 1 2 5 7 0 45 0 51 0 46 0 42 0 34 0 37 0 46 0 32 8 0 37 0 25 0 30 0 23 0 38 0 41 0 48 0 17 0 08 0 26 0 16 0 19 0 04 0 04 0 02 0 15 Based on these data can the consumer group conclude at the 0 01 level of significance that the mean tread wears of the brands differ Answer this question by performing a hypothesis test regarding which is with a letter d subscript the population mean difference in tread wear for the two brands of tires Assume that this population of differences Brand 1 minus Brand 2 is normally distributed a State the null hypothesis Ho and the alternative hypothesis H HO H 0 b Determine the type of test statistic to use Type of test statistic Choose one Perform a two tailed test Then complete the parts below Carry your intermediate computations to three or more decimal places and round your answers as specified If necessary consult a list of formulas c Find the value of the test statistic Round to three or more decimal places 0 d Find the two critical values at the 0 01 level of significance Round to three or more decimal places and e At the 0 01 level can the consumer group conclude that the mean tread wears of the brands differ OYes ONO H XI O X S 00 0 0 OSO O O P Q S 0 0 020 O O
Statistics
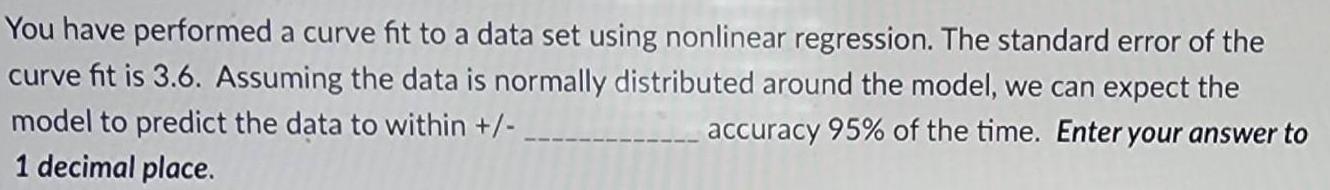
StatisticsYou have performed a curve fit to a data set using nonlinear regression The standard error of the curve fit is 3 6 Assuming the data is normally distributed around the model we can expect the model to predict the data to within accuracy 95 of the time Enter your answer to 1 decimal place
Statistics
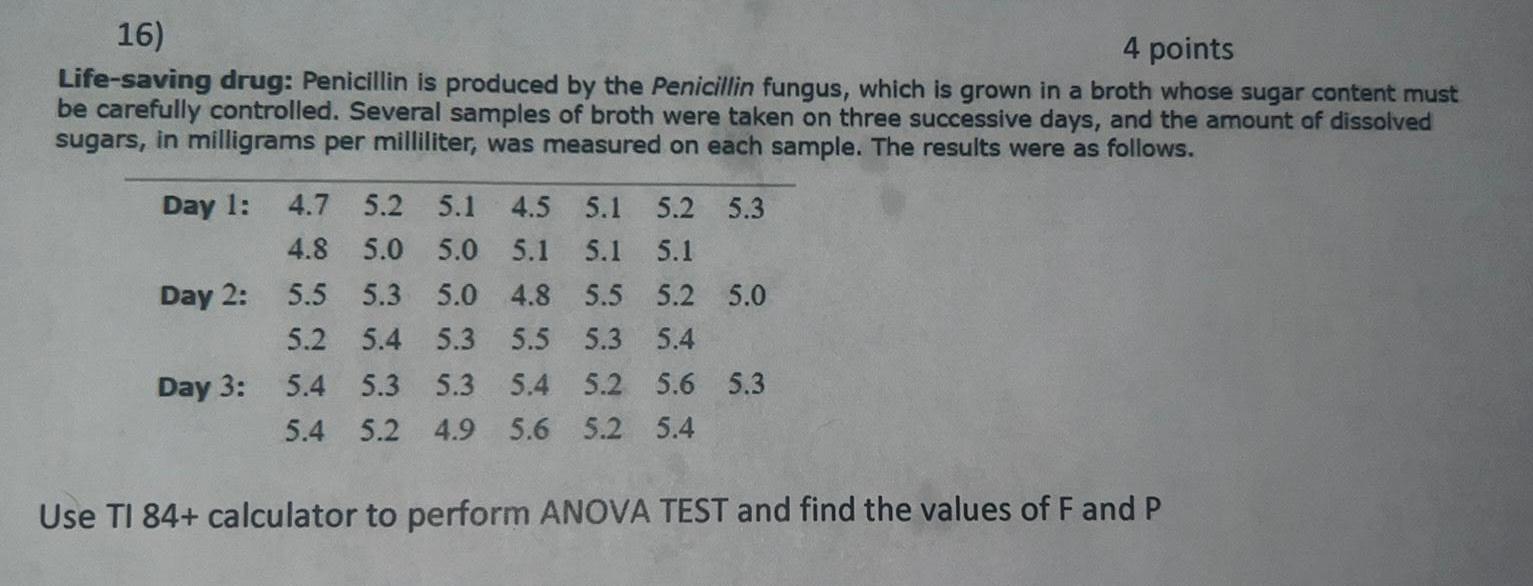
Statistics16 4 points Life saving drug Penicillin is produced by the Penicillin fungus which is grown in a broth whose sugar content must be carefully controlled Several samples of broth were taken on three successive days and the amount of dissolved sugars in milligrams per milliliter was measured on each sample The results were as follows Day 1 Day 2 Day 3 4 7 5 2 5 1 4 5 5 1 5 2 5 3 4 8 5 0 5 0 5 1 5 1 5 1 5 5 5 3 5 0 4 8 5 5 5 2 5 0 5 2 5 4 5 3 5 5 5 3 5 4 5 4 5 3 5 3 5 4 5 2 5 6 5 3 5 4 5 2 4 9 5 6 5 2 5 4 Use TI 84 calculator to perform ANOVA TEST and find the values of F and P
Statistics
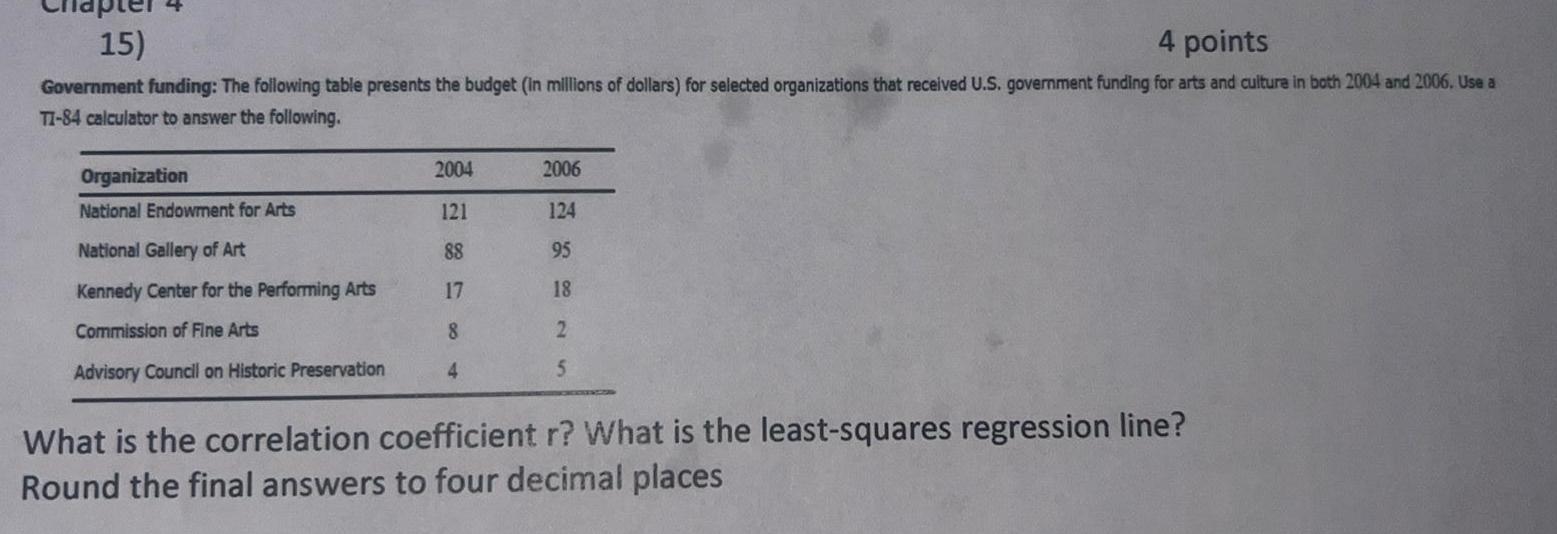
Statistics15 4 points Government funding The following table presents the budget in millions of dollars for selected organizations that received U S government funding for arts and culture in both 2004 and 2006 Use a TI 84 calculator to answer the following Organization National Endowment for Arts National Gallery of Art Kennedy Center for the Performing Arts Commission of Fine Arts Advisory Council on Historic Preservation 2004 121 88 17 8 4 2006 124 95 18 2 5 What is the correlation coefficient r What is the least squares regression line Round the final answers to four decimal places
Statistics
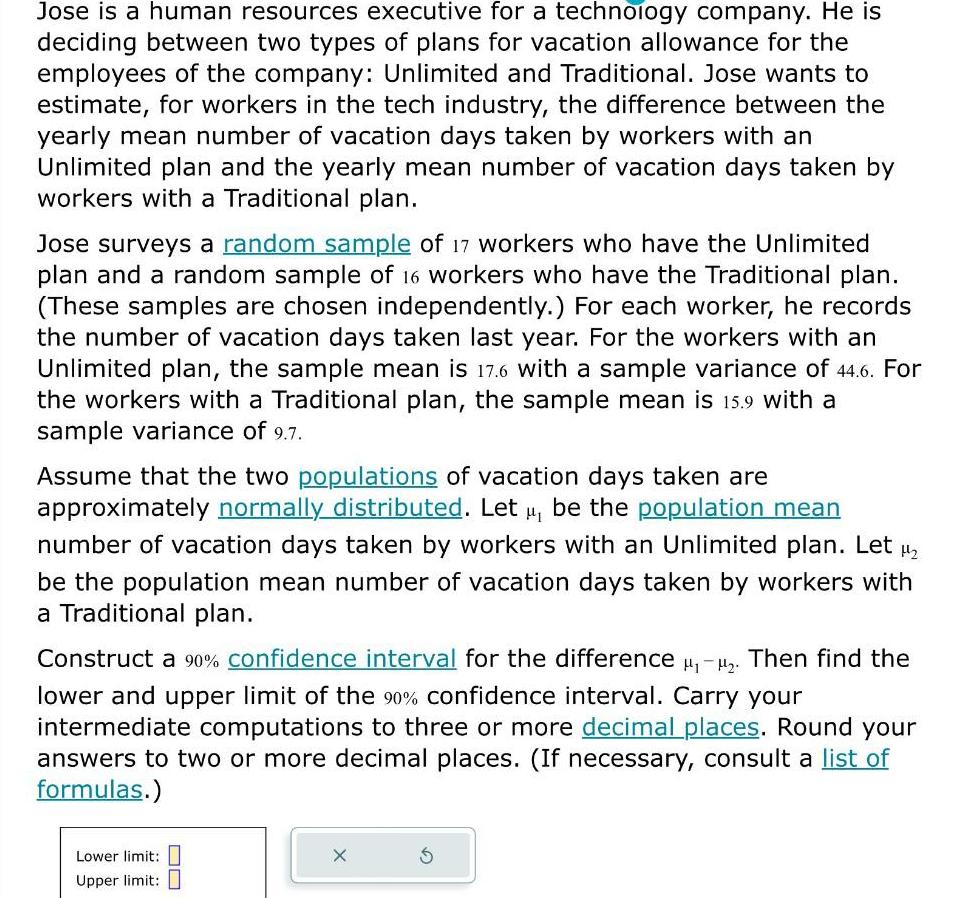
StatisticsJose is a human resources executive for a technology company He is deciding between two types of plans for vacation allowance for the employees of the company Unlimited and Traditional Jose wants to estimate for workers in the tech industry the difference between the yearly mean number of vacation days taken by workers with an Unlimited plan and the yearly mean number of vacation days taken by workers with a Traditional plan Jose surveys a random sample of 17 workers who have the Unlimited plan and a random sample of 16 workers who have the Traditional plan These samples are chosen independently For each worker he records the number of vacation days taken last year For the workers with an Unlimited plan the sample mean is 17 6 with a sample variance of 44 6 For the workers with a Traditional plan the sample mean is 15 9 with a sample variance of 9 7 Assume that the two populations of vacation days taken are approximately normally distributed Let u be the population mean number of vacation days taken by workers with an Unlimited plan Let be the population mean number of vacation days taken by workers with a Traditional plan Construct a 90 confidence interval for the difference Then find the lower and upper limit of the 90 confidence interval Carry your intermediate computations to three or more decimal places Round your answers to two or more decimal places If necessary consult a list of formulas Lower limit Upper limit X S
Statistics
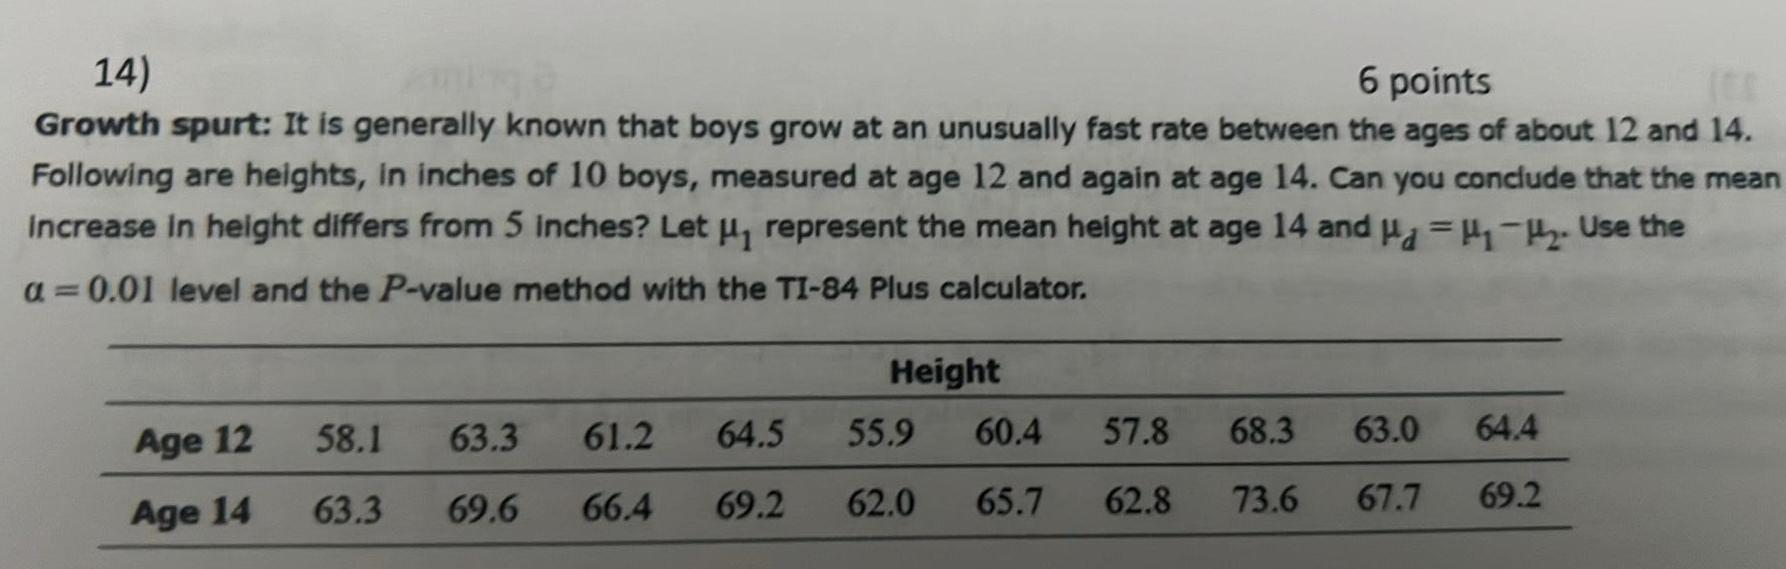
Statistics14 6 points ES Growth spurt It is generally known that boys grow at an unusually fast rate between the ages of about 12 and 14 Following are heights in inches of 10 boys measured at age 12 and again at age 14 Can you conclude that the mean Increase in height differs from 5 inches Let represent the mean height at age 14 and H 2 Use the a 0 01 level and the P value method with the TI 84 Plus calculator Age 12 Age 14 58 1 63 3 63 3 69 6 61 2 64 5 66 4 69 2 Height 55 9 60 4 62 0 65 7 57 8 68 3 62 8 73 6 63 0 64 4 67 7 69 2
Statistics
StatisticsAlexis works at a health care facility She has measured the hemoglobin levels of 400 people The data follows a normal distribution with a mean of 16 g dL and a standard deviation of 2 What is the chance that if Alexis pulls a file randomly that that patient would have a hemoglobin level between 12 and 20 g dL Select one O a 99 7 Ob 20 O c 68 O d 50 95
Statistics
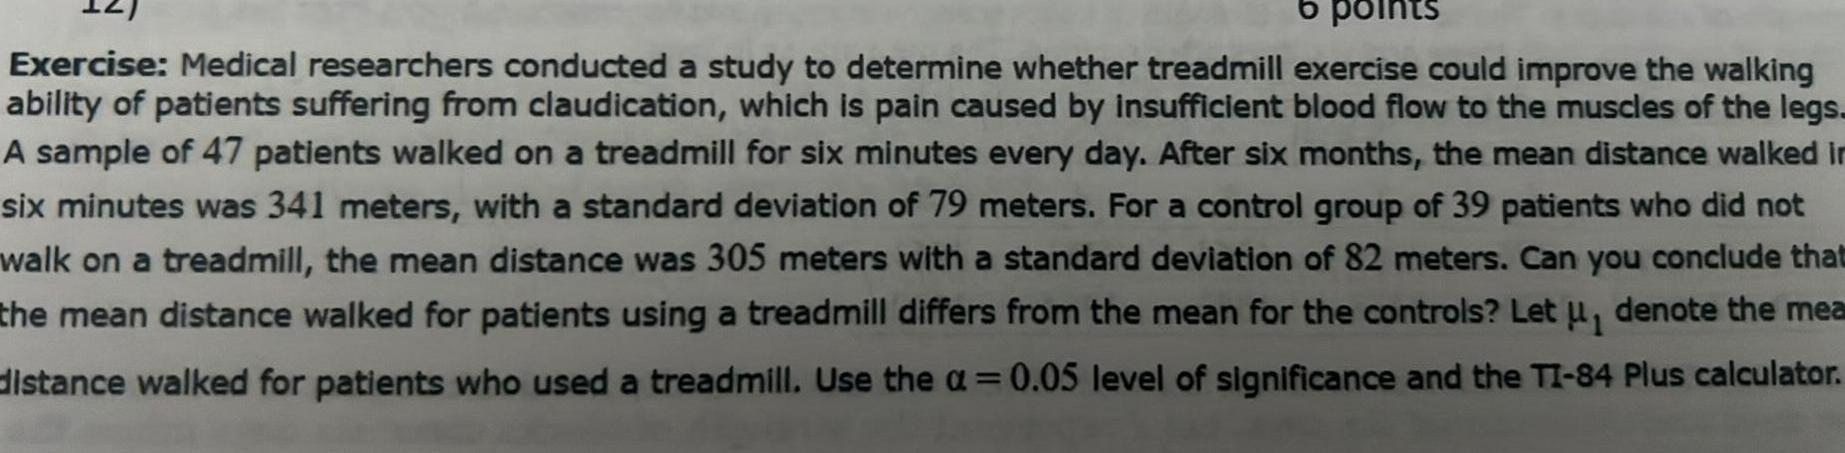
Statistics6 points Exercise Medical researchers conducted a study to determine whether treadmill exercise could improve the walking ability of patients suffering from claudication which is pain caused by insufficient blood flow to the muscles of the legs A sample of 47 patients walked on a treadmill for six minutes every day After six months the mean distance walked in six minutes was 341 meters with a standard deviation of 79 meters For a control group of 39 patients who did not walk on a treadmill the mean distance was 305 meters with a standard deviation of 82 meters Can you conclude that the mean distance walked for patients using a treadmill differs from the mean for the controls Let u denote the mea distance walked for patients who used a treadmill Use the 0 05 level of significance and the TI 84 Plus calculator
Statistics
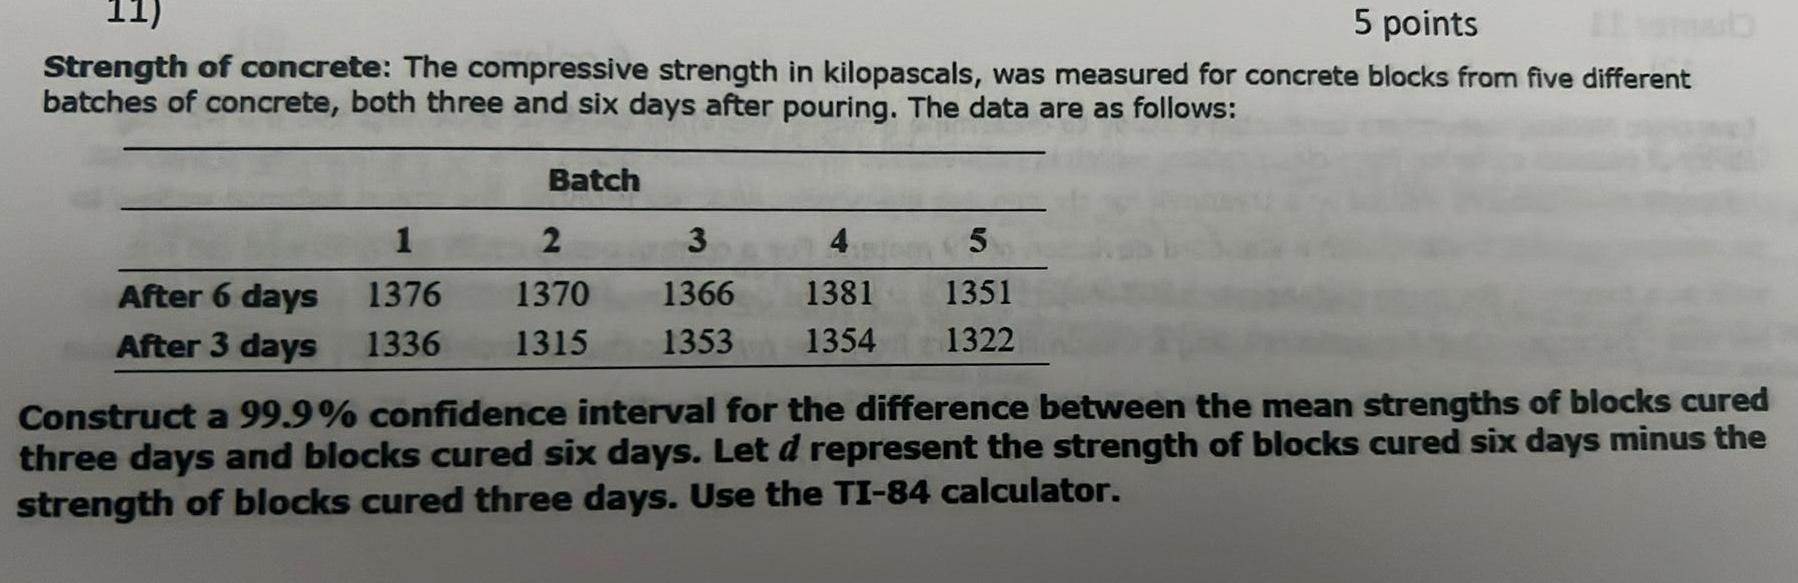
Statistics11 5 points Strength of concrete The compressive strength in kilopascals was measured for concrete blocks from five different batches of concrete both three and six days after pouring The data are as follows After 6 days After 3 days 1 1376 1336 Batch 2 1370 1315 3 4 1366 1381 1353 1354 5 1351 1322 Construct a 99 9 confidence interval for the difference between the mean strengths of blocks cured three days and blocks cured six days Let d represent the strength of blocks cured six days minus the strength of blocks cured three days Use the TI 84 calculator
Statistics
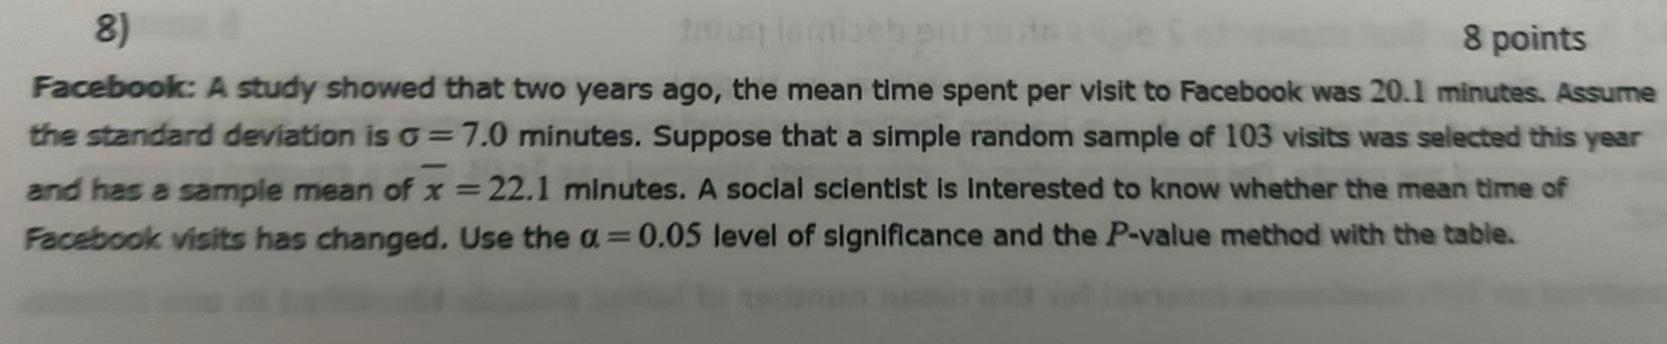
Statistics8 8 points Facebook A study showed that two years ago the mean time spent per visit to Facebook was 20 1 minutes Assume the standard deviation is G 7 0 minutes Suppose that a simple random sample of 103 visits was selected this year and has a sample mean of x 22 1 minutes A social scientist is interested to know whether the mean time of Facebook visits has changed Use the a 0 05 level of significance and the P value method with the table

Statistics
Statistics5 points 10 Cancer prevention Colonoscopy is a medical procedure that is designed to find and remove precancerous lesions in the colon before they become cancerous In a sample of 51 560 people without colorectal cancer 6084 had previously had a colonoscopy and in a sample of 9247 people diagnosed with colorectal cancer 959 had previously had a colonoscopy Construct a 90 confidence interval for the difference in the proportions of people who had colonoscopies between those who were diagnosed with colorectal cancer and those who were not Let p denote the proportion of people without colorectal cancer who had colonoscopies and let p2 denote the proportion of people with colorectal cancer who had
Statistics
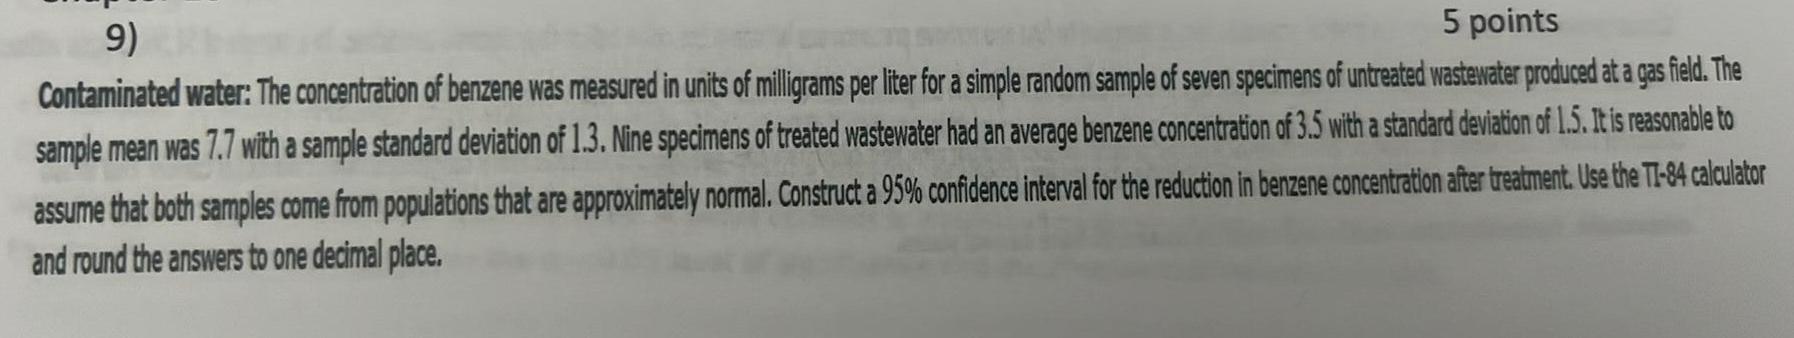
Statistics9 5 points Contaminated water The concentration of benzene was measured in units of milligrams per liter for a simple random sample of seven specimens of untreated wastewater produced at a gas field The sample mean was 7 7 with a sample standard deviation of 1 3 Nine specimens of treated wastewater had an average benzene concentration of 3 5 with a standard deviation of 1 5 It is reasonable to assume that both samples come from populations that are approximately normal Construct a 95 confidence interval for the reduction in benzene concentration after treatment Use the TI 84 calculator and round the answers to one decimal place
Statistics
StatisticsChapter 8 6 points 7 Round your final answer to 2 digits after the decimal point Sound it out Phonics is an instructional method in which children are taught to connect sounds with letters or groups of letters A sample of 135 first graders who were learning English were asked to identify as many letter sounds as possible in a period of one minute The average number of letter sounds identified was 34 04 with a standard deviation of 23 62 a Construct an 80 confidence interval for the mean number of letter sounds identified in one minu
Statistics
Statistics13 6 points Pollution and altitude In a random sample of 346 cars driven at low altitudes 51 of them exceeded a standard of 11 grams of particulate pollution per gallon of fuel consumed In an independent random sample of 80 cars driven at high altitudes 20 of them exceeded the standard Can you conclude that the proportion of high altitude vehicles exceeding the standard differs from the proportion of low altitude vehicles exceeding the standard Let p denote the proportion of low altitude vehicles exceeding the standard and p2 denote the proportion of high altitude vehicles exceeding the standard Use the a 0 05 level of significance and the P value method with the TI 84 Plus calculator
Statistics
Probabilityb What is the probability that the sample mean income is between 38 and 46 5 points
Statistics
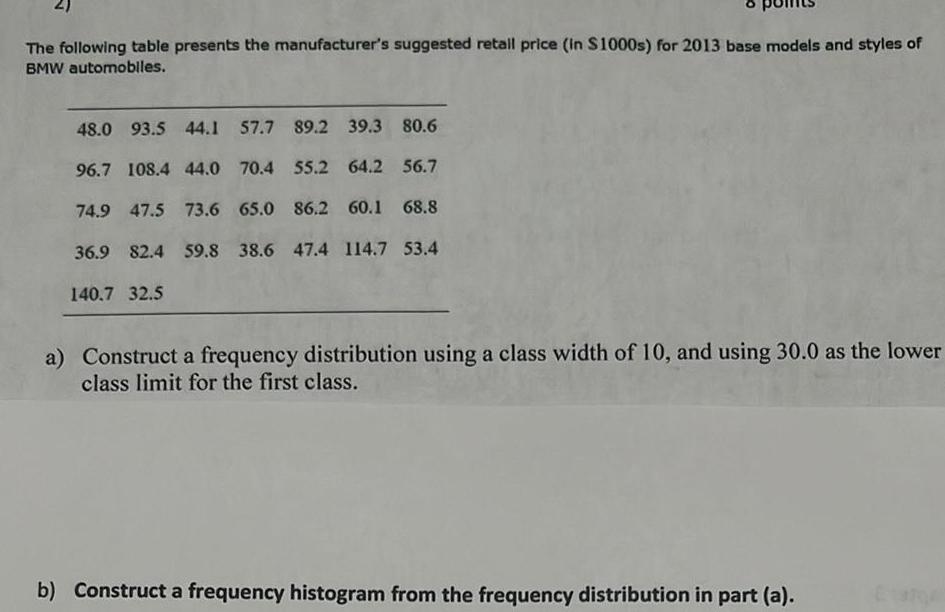
StatisticsThe following table presents the manufacturer s suggested retail price in 1000s for 2013 base models and styles of BMW automobiles 48 0 93 5 44 1 57 7 89 2 39 3 80 6 96 7 108 4 44 0 70 4 55 2 64 2 56 7 74 9 47 5 73 6 65 0 86 2 60 1 68 8 36 9 82 4 59 8 38 6 47 4 114 7 53 4 140 7 32 5 a Construct a frequency distribution using a class width of 10 and using 30 0 as the lower class limit for the first class b Construct a frequency histogram from the frequency distribution in part a
Statistics
Probability5 Big babies A public health organization reports that 20 of baby boys 6 8 months old in the United States weigh more than 20 pounds A sample of 17 babies is studied Round the answers to three decimal places a What is the probability that exactly 8 of them weigh more than 20 pounds 2 points h What is the probability that more than 6 weigh more than 20 pounds
Statistics
StatisticsChapter 7 6 Give your final answers rounded to 4 digits after the decimal point Annual income The mean annual income for people in a certain city in thousands of dollars is 40 with a standard deviation of 28 A pollster draws a sample of 90 people to interview a What is the probability that the sample mean income is less than 38 5 points
Statistics
ProbabilityChapter 3 3 A population has mean 30 and standard deviation o 7 a Find the Z score for a population value of 9 2 points b Find the z score for a population value of 51 c What number has a z score of 2 3 2 points 2 points

Statistics
Probability10 points Lottery Every day Jorge buys a lottery ticket Each ticket has a probability of 0 2 of winning a prize After five days what is the probability that Jorge has won at least one prize Round your answer to four decimal places