Statistics Questions
The best high school and college tutors are just a click away, 24×7! Pick a subject, ask a question, and get a detailed, handwritten solution personalized for you in minutes. We cover Math, Physics, Chemistry & Biology.

Statistics
Statistics1 point A description of different houses for sale includes the square footage of the house whether or not the house has a finished basement and the monthly electric bill Which of the variables is categorical All of the answer options are correct the monthly electric bill whether or not the house has a finished basement the square footage of the house

Statistics
Statistics1 point You measure the lifetime of a random sample of 64 tires of a certain brand The sample mean is x 50 months Suppose that the lifetimes for tires of this brand follow a Normal distribution with unknown mean and standard deviation o 5 months A 90 confidence interval for u is 49 8 to 50 2

Statistics
Statistics7 1 point What is the area under the standard Normal curve corresponding to z 0 32 0 7734 0 5562 0 6255 0 9599

Statistics
Statistics1 point A statistician wishes to test a hypothesis that students score at least 75 on the final exam in an introductory statistics course The statistician decides to randomly select 20 students in the class and have them take the exam early The average score for these students on the exam is 78 Suppose the standard deviation in the population is known to be a 15 The P value for the hypothesis Hu 75 vs Hu 75 is 0 371 OOO 0 814 0 186

Statistics
StatisticsIn a large population of college educated adults the mean IQ is 112 with standard deviation 25 Suppose 36 adults from this population are randomly selected for a market research campaign The probability that the sample mean IQ is greater than 103 is 0 019 0 985 0 884 DURA

Statistics
StatisticsI choose a card at random from a well shuffled deck of 52 cards The probability that the card chosen is either a club or a jack is 14 52 13 52

Statistics
Statistics1 point Running times for a 400 meter race are Normally distributed for students at a certain school with a mean of 93 seconds and a standard deviation of 16 seconds What would a student s running time have to be to put the student in the top 1 among runners at the school 55 8 seconds 134 2 seconds 130 2 seconds 51 8 seconds

Statistics
Statistics1 point Veterinarians often use nonsteroidal anti inflammatory drugs NSAIDs to treat lameness in horses A group of veterinary researchers wanted to find out how widespread the practice is in the United States They obtained a list of all veterinarians treating large animals including horses They sent questionnaires to all the veterinarians on the list Such a survey is called a census The response rate was 40 What is the population of interest all veterinarians treating large animals all veterinarians All of the answer options are correct all veterinarians in the United States treating large animals including horses O O

Statistics
Statistics8 1 point A student wonders whether people with similar heights tend to date each other She measures herself her dormitory roommate and the women in the adjoining rooms then she measures the next man each woman dates Here are the pairs of data heights in inches Women 64 66 70 65 68 distribution 66 72 O O 70 74 Men 68 Which of the following statements is true Correlation makes no sense here because gender is a categorical variable The variables measured are all categorical There is a positive correlation between the heights of men and women who are dating each other There is a strong positive correlation between the heights of men and women because the women are always shorter than the men they date D

Statistics
ProbabilityA large university is divided into six colleges with most students graduating from one of four of these colleges The following bar chart gives the distribution of the percents graduating from these four most popular colleges in 2003 Percent OO 30 25 20 15 10 0 Biobgical sciences il Engineering Math and physical sciences College The percent of students graduating not from either biological sciences is approximately 70 approximately 50 over 80 Business

Statistics
Statistics1 point Archaeologists often find only parts of ancient human remains For example they may find a small finger bone called the metacarpal bone Because of this researchers often ask questions like Is it possible to predict the height of a human from the length of a metacarpal bone To investigate a researcher measures the heights and metacarpal lengths of 200 adults In making the scatterplot the researcher should use a plotting scale that makes the overall trend roughly linear plot the metacarpal length on the horizontal axis plot the height of the person on the horizontal axis first determine whether the heights of humans follow a Normal distribution O O O O DOL

Statistics
StatisticsA violin student records the number of hours she spends practicing during each of nine consecutive weeks 6 2 5 0 4 3 7 4 5 8 7 2 8 4 1 2 6 3 Considering the smallest data value 9 1 and using the 1 5 IQR rule we would classify the value 9 1 as an outlier because it is more than 1 5 x IQR above the third quartile classify the value 9 1 as an outlier because it is more than 1 5 x IQR above the third quartile not classify the value 9 1 as an outlier because it is not more than 1 5 x IQR above the third quartile classify the value 9 1 as an outlier because it is more than 1 5 x IQR above the third quartile

Statistics
StatisticsA frequent flyer was interested in the relationship between dollars spent on flying and the distance flown She randomly sampled 20 frequent flyers of a certain airline She collected the number of miles flown in the previous year and the total amount of money the flyer spent A regression line of distance flown on money spent was fit to the data and the intercept and slope were calculated to be a 24 000 and b 10 One of the randomly sampled frequent flyers was found to have spent 2500 and to have flown 53 000 miles The residual for this observation is 4000 8000 16 000 12 000

Statistics
Statistics1 point A researcher studying the effect of price cuts on consumers expectations makes up two different histories of the store price of a hypothetical brand of laundry detergent for the past year Eight students in a business class view one or the other price history on a computer Some students see a steady price whereas others see regular sales that temporarily cut the price Students are asked what price they would expect to pay The experimental units are the business students who were in the fluctuating price group the eight business students who participated the price the students would expect to pay all business students at the college O O O

Statistics
Probability1 point The regression equation below relates the scores students in an advanced statistics course received for homework completed and for the subsequent midterm exam Homework scores are based on assignments that preceded the exam The maximum homework score a student could obtain was 500 and the maximum midterm score was 350 The regression line that was obtained is given by y 84 4 0 91x If a student had a homework score of 396 the midterm score would be predicted to be rounded to an integer OOO O 282 298 268 276

Statistics
StatisticsA simple random sample of 25 recent birth records was selected from a local hospital In the sample the average birth weight was 119 6 ounces Suppose the distribution for all birth weights for this hospital is known to be Normal with mean u and standard deviation 4 1 ounces Based on the 25 recent birth records the sampling distribution of the sample mean x can be represented by N 1 30 N 0 82 N 0 76 N u 6 5

Statistics
ProbabilityA marketing consultant is hired by a major restaurant chain that wants to investigate the preferences and spending patterns of lunch customers The CEO of the chain hypothesized that the average customer spends at least 13 50 on lunch A survey of 25 customers sampled at one of the restaurants found the average lunch bill per customer to be x 14 50 Based on previous surveys the restaurant informs the marketing manager that the standard deviation is o 3 50 To address the CEO s conjecture the marketing manager decides to carry out a test of significance The null hypothesis should be Hou 14 50 Hou 13 50 oooo Hou 14 50 H 13 50

Statistics
ProbabilityIn the scatter plot shown below what type of correlation exists between years worked and salary See SCATTER PLOT from the final exam consolidated file O a negative O b neutral c positive d absolute

Statistics
StatisticsAcme toy company prints baseball cards The company claims that 30 of the cards are rookies 60 veterans but not All Stars and 10 are veteran All Stars Suppose a random sample of 100 cards has 50 rookies 45 veteran and 5 All starts Is this consistent with Acme s claim Use a 0 05 level of significance to perform a complete hypothesis test Show all work 1 Calculate the Expected values for opening a sample of 100 cards 2 State the null and alternative hypotheses 3 Calculate the degrees of freedom 4 Complete your hypothesis test using the procedures covered in the lecture for Chapter 11 What are the results 5 State your conclusions

Statistics
StatisticsApril May June b Whi Use a 0 05 significance level to test whether homicides in this city are equally likely for each of the 12 months a Which is the null hypothesis 41 47 50 HO At least one month has a different frequency of homicides than the others HO Homicides occur with equal frequency throughout the different months HO At least two months have a different frequency of homicides than the others HO Homicides occur with all different frequencies in the different months 42 83 Only need the blank ones H1 Homicides occur with all different frequencies throughout the different months H1 Homicides occur with equal frequency throughout the different months Oct Nov Dec 43 36 36 H1 Homicides do not occur with equal frequency throughout the different months H1 At least two months have a different frequency of homicides than the others C What is the expected frequency for each month Round to 3 decimal places d What is the test statistic X Round to 2 decimal places f What is the p value Round to 4 decimal places g Which is the decision and reasoning e What are the degrees of freedom needed to find the p value Reject the null hypothesis There is not enough evidence to reject the claim that homicides in this city are equally likely for each of the 12 months Reject the null hypothesis There is enough evidence to reject the claim that homicides in this city qually likely for each of the 12 months

Statistics
Probabilitythe wait times in their drive thru for all customers is 3 23 minutes You work for a competitor and you want to test that claim To do so you select a random sample of 40 of the chain s drive thru customers and record the wait time in the drive thru for each Assume it is known that the population standard deviation of the wait times in the drive thru for the hamburger chain s restaurants is 2 91 minutes Based on your sample follow the steps below to construct a 95 confidence interval for the population mean of the wait times in the drive thru for all customers Then state whether the confidence interval you construct contradicts the restaurant chain s claim If necessary consult a list of formulas a Click on Take Sample to see the results from your random sample of 40 customers Take Sample Sample size 0 Point estimate 0 Enter the values of the sample size the point estimate for the population mean the population standard deviation and the critical value you need for your 95 confidence interval Choose the correct critical value from the table of critical values provided When you are done select Compute Population standard deviation 0 Critical value Compute 0 00 Number of customers 0 00 Sample mean Sample standard deviation 2 00 Standard error Margin of error 4 00 95 confidence interval 95 confidence interval b Based on your sample graph the 95 confidence interval for the population mean of the wait times in the drive thru for all customers 5 00 Enter the lower and upper limits on the graph to show your confidence interval For the point enter the restaurant chain s claim of 3 23 minutes 6 00 O No the confidence interval does not contradict the claim The restaurant chain s claim of 3 23 minutes is inside the 95 confidence interval O No the confidence interval does not contradict the claim The restaurant chain s claim of 3 23 minutes is outside the 95 confidence interval Yes the confidence interval contradicts the claim The restaurant chain s claim of 3 23 minutes is inside the 95 confidence interval Population standard deviation 2 91 8 00 Yes the confidence interval contradicts the claim The restaurant chain s claim of 3 23 minutes is outside the 95 confidence interval Critical values x 0 005 2 576 0 010 2 326 0 025 1 960 X 0 050 1 645 0 100 1 282 X c Does the 95 confidence interval you constructed contradict the restaurant chain s claim Choose the best answer from the choices below 5 10 00 10 00

Statistics
StatisticsThe table shows results from polygraph lie detector experiments conducted by researchers on 58 subjects In each case it was known if the subjected lied or did not lie Actually lied Polygraph indicated subject lied a Which is the nu Polygraph indicated subject did not lie Total 13 11 b Which is the alternative hypothesis 24 Did not actually lie 26 8 e What is the test statistic Round to 2 decimal places 34 Use a 0 05 significance level to test the claim that whether a subject lies is independent of the polygraph test indication Only need the blank ones Total f What are the degrees of freedom needed to find the p value g What is the p value Round to 4 decimal places 39 HO Whether a subject lies is independent of not related to the polygraph test indication OHO Polygraph testing is not accurate HO Polygraph testing is accurate HO Whether a subject lies is dependent of related to the polygraph test indication 19 58 H1 Whether a subject lies is independent of not related to the polygraph test indication H1 Polygraph testing is not accurate H1 Whether a subject lies is dependent of related to the polygraph test indication H1 Polygraph testing is accurate Before calculating the test statistic the expected values for each category must be found c What is the expected number of subjects who lied AND were accurately detected as lying by the polygraph Round to 2 decimal places d What is the expected number of subjects who lied BUT were detected as telling the truth by the polygraph Round to 2 decimal places h Do the results suggest that polygraphs are effective in distinguishing between truth and lies In other

Statistics
Statisticsfor a competitor and you want to test that claim To do so you select a random sample of 40 of the chain s drive thru customers and record the wait time in the drive thru for each Assume it is known that the population standard deviation of the wait times in the drive thru for the hamburger chain s restaurants is 2 91 minutes Based on your sample follow the steps below to construct a 99 confidence interval for the population mean of the wait times in the drive thru for all customers Then state whether the confidence interval you construct contradicts the restaurant chain s claim If necessary consult a list of formulas a Click on Take Sample to see the results from your random sample of 40 customers c Take Sample Sample size D Point estimate 0 Population standard deviation 0 Critical value 0 Compute 0 00 Number of customers Enter the values of the sample size the point estimate for the population mean the population standard deviation and the critical value you need for your 99 confidence interval Choose the correct critical value from the table of critical values provided When you are done select Compute 0 00 40 2 00 Sample mean 5 67 4 00 Sample standard deviation Standard error Margin of error 99 confidence interval 99 confidence interval 2 34 5 00 b Based on your sample graph the 99 confidence interval for the population mean of the wait times in the drive thru for all customers 6 00 Enter the lower and upper limits on the graph to show your confidence interval For the point enter the restaurant chain s claim of 3 59 minutes O No the confidence interval does not contradict the claim The restaurant chain s claim of 3 59 minutes is inside the 99 confidence interval O No the confidence interval does not contradict the claim The restaurant chain s claim of 3 59 minutes is outside the 99 confidence interval Population standard deviation O Yes the confidence interval contradicts the claim The restaurant chain s claim of 3 59 minutes is inside the 99 confidence interval 2 91 8 00 O Yes the confidence interval contradicts the claim The restaurant chain s claim of 3 59 minutes is outside the 99 confidence interval X Critical values 20 005 2 576 0 010 2 326 20 025 1 960 0 050 1 645 0 100 1 282 X Does the 99 confidence interval you constructed contradict the restaurant chain s claim Choose the best answer from the choices below S 3 5 10 00 10 00 S A M

Statistics
StatisticsThe average weight in pounds of boys who are three years old or younger can be approximated by the function f x 7 6 6 36in x where x represents the age in months Use the function to determine the average weight of boys who are 12 months old

Statistics
Probabilityprefer printed textbooks to electronic textbooks You want to test this claim by surveying a random sample of 45 college students Follow the steps below to construct a 90 confidence interval for the population proportion of all college students who prefer printed textbooks to electronic textbooks Then state whether the confidence interval you construct contradicts the study s claim If necessary consult a list of formulas a Click on Take Sample to see the results from the random sample Take Sample Sample size 0 Point estimate 0 Critical value 0 Compute Prefers printed textbooks to electronic textbooks 0 000 Does not prefer printed textbooks to electronic textbooks 0 000 Enter the values of the sample size the point estimate of the population proportion and the critical value you need for your 90 confidence interval Choose the correct critical value from the table of critical values provided When you are done select Compute Standard error Margin of error 90 confidence interval 90 confidence interval 0 500 Number O No the confidence interval does not contradict the claim The proportion 0 45 from the study is inside the 90 confidence interval 27 b Based on your sample graph the 90 confidence interval for the population proportion of all college students who prefer printed textbooks to electronic textbooks O No the confidence interval does not contradict the claim The proportion 0 45 from the study is outside the 90 confidence interval 18 Enter the values for the lower and upper limits on the graph to show your confidence interval For the point enter the claim 0 45 from the study O Yes the confidence interval contradicts the claim The proportion 0 45 from the study is inside the 90 confidence interval O Yes the confidence interval contradicts the claim The proportion 045 from the study is outside the Proportion 0 6 0 4 Critical values 20 005 2 576 20 010 2 326 0 025 1 960 0 050 1 645 20 100 1 282 X X c Does the 90 confidence interval you constructed contradict the claim from the study Choose the best answer from the choices below 1 000 1 000

Statistics
Probability3 The plot below shows a frequency distribution in gray bars and a normal probability distribution as a red line Frequency Enter here 40 35 30 25 20 15 10 5 0 L 40 44 48 52 56 60 64 68 72 Body mass kg 0 1 0 08 0 06 0 04 0 02 0 Probability How well does the normal probability distribution describe the frequency distribution Which assumptions of the normal probability function seem appropriate for describing the data in the frequency distribution Which do not

Statistics
StatisticsOn a television show eight contestants try to lose the highest percentage of weight in order to win a cash prize As part of the show the contestants are timed as they run an obstacle course The table shows the times in seconds of the contestants at the beginning of the season and at the end of the season At a 0 05 is there enough evidence to support the claim that the contestants times have changed Assume the samples are random and dependent and the population is normally distributed Complete parts a through e below Contestant 1 2 3 4 5 6 7 8 Time beginning 139 3 142 8 119 5 133 3 122 2 152 6 145 8 146 9 Time end 139 1 143 0 119 2 133 1 122 1 152 5 146 0 146 5 a Identify the claim and state Ho and Ha What is the claim OA The contestants times have not changed B The contestants times have changed OC The contestants times have increased OD The contestants times have decreased Let Hd be the hypothesized mean of the difference in the times beginning end What are Ho and H O A Ho Hasd O B Ho Hd 0 OC Ho Hd SO Ha Hd 0 Ha Hd d Ha Hd 0 O D Ho Hd 20 Ha Hd 0 OE H Hd zd Ha Hd d OF Ho Hd 0 Ha Hd 0

Statistics
Statistics1 The plot below shows a frequency distribution in gray bars and a normal probability distribution as a red line Frequency Enter here 10 8 8 2 0 40 60 80 100 Score on exam 120 0 030 140 0 025 0 020 0 015 0 010 0 005 0 000 Probability How well does the normal probability distribution describe the frequency distribution Which assumptions of the normal probability function seem appropriate for describing the data in the frequency distribution Which do not

Statistics
ProbabilityProbability Distribution Use the frequency distributions below labeled A D to answer the questions that follow Frequency Frequency 200 A 150 8 8 50 292 888 20 160 140 C 120 100 40 10 20 30 40 50 70 80 90 100 110 120 130 140 Frequency Frequency 180 160 B 140 120 100 80 60 40 20 0 250 200 150 100 50 O 24 D 6 8 10 20 30 40 10 12 50 60 70 80
Statistics
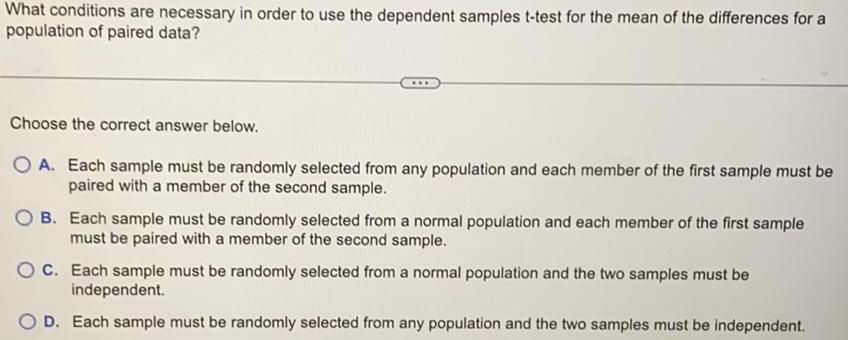
StatisticsWhat conditions are necessary in order to use the dependent samples t test for the mean of the differences for a population of paired data Choose the correct answer below OA Each sample must be randomly selected from any population and each member of the first sample must be paired with a member of the second sample OB Each sample must be randomly selected from a normal population and each member of the first sample must be paired with a member of the second sample OC Each sample must be randomly selected from a normal population and the two samples must be independent OD Each sample must be randomly selected from any population and the two samples must be independent

Statistics
Statistics17 points Periodically the county Water Department tests the drinking water of homeowners for contaminants such as lead and co levels in water specimens collected in 1998 for a sample of 5 residents of a subdevelopement of the county is shown below lead g L 5 2 3 5 2 1 1 0 a Fill in the following chart to determine the sample mean and sample standard deviation S x Then X S 72 X 5 2 3 5 2 1 1 0 H n 1 H b Determine the critical value t 99 t 99 c Determine the maximal margin of error M

Statistics
Statisticsweights for all Boer goats is 2 81 kg A veterinary service has hired you to test that claim To do so you select a random sample of 35 Boer goats and record the birth weights Assume it is known that the population standard deviation of the birth weights of Boer goats is 1 36 kg Based on your sample follow the steps below to construct a 99 confidence interval for the population mean of the birth weights for all Boer goats Then state whether the confidence interval you construct contradicts the publication s claim If necessary consult a list of formulas a Click on Take Sample to see the results from your random sample of 35 Boer goats c Take Sample Sample size 1 Point estimate 0 Population standard deviation 0 Critical value 0 Compute Number of goats Sample mean Enter the values of the sample size the point estimate for the population mean the population standard deviation and the critical value you need for your 99 confidence interval Choose the correct critical value from the table of critical values provided When you are done select Compute 0 00 0 00 35 2 00 1 38 Sample standard Standard error 4 00 Margin of error 99 confidence interval deviation b Based on your sample graph the 99 confidence interval for the population mean of the birth weights for all Boer goats 99 confidence interval 5 00 1 06 Enter the lower and upper limits on the graph to show your confidence interval For the point enter the publication s claim of 2 81 kg 6 00 O No the confidence interval does not contradict the claim The publication s claim of 2 81 kg is inside the 99 confidence interval O No the confidence interval does not contradict the claim The publication s claim of 2 81 kg is outside the 99 confidence interval Population standard deviation 1 36 Critical values 8 00 O Yes the confidence interval contradicts the claim The publication s claim of 2 81 kg is inside the 99 confidence interval 20 005 2 576 0 010 2 326 0 025 1 960 0 050 1 645 20 100 1 282 X X Does the 99 confidence interval you constructed contradict the publication s claim Choose the best answer from the choices below 10 00 10 00
Statistics
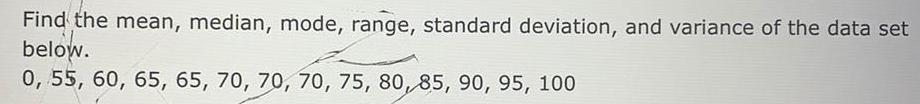
StatisticsFind the mean median mode range standard deviation and variance of the data set below 0 55 60 65 65 70 70 70 75 80 85 90 95 100

Statistics
ProbabilityPlease answer the following essay question Consider the data set given below Which of the two options do you think is best for representing the data Explain your reasoning Pay of 10 Individuals at a School 25 30026 62052 000125 00062 052 45 05638 05832 48050 589 23 584 Option 1 Use the mean to describe the pay Option 2 Use the median to describe the pay Answer in paragraph form using complete sentences and include any calculations graphs and labeled diagrams as appropriate

Statistics
Statisticsdecision using the standardized test statistic and using the P value Assume the sample sizes are equal Click the icon to view the technology display Choose the correct answer below O A Reject the null hypothesis because the P value is greater than the level of significance OB Fail to reject the null hypothesis because the P value is greater than the level of significance OC Fail to reject the null hypothesis because the P value is less than the level of significance OD Reject the null hypothesis because the P value is less than the level of significance Technology Output 2 Samp2Test l 2 z 0 929816399 p 0 3524661541 x1 2400 x2 2350 n1 110 lake tr X

Statistics
StatisticsWhat conditions are necessary in order to use the z test to test the difference between two population means Select all the necessary conditions below A The samples must be randomly selected B Each population has a normal distribution with a known standard deviation C The samples must be independent D The samples are paired

Statistics
StatisticsCreate a data set of 10 data points where the mean and the mode are the same and show that your data set works

Statistics
StatisticsWhat is the relationship between variance and standard deviation Can either be negative Explain

Statistics
ProbabilityDetermine whether the statement is true and justify your response The mean is th measure of central tendency most likely to be affected by outliers

Statistics
StatisticsChoose the correct answer below OA They are equivalent through algebraic manipulation OB The values of and are equivalent in every population Therefore these hypotheses are equivaler OC They are equivalent because the null hypothesis Ho is always assumed to be true OD By definition the null hypothesis is always equal to 0 Therefore these hypotheses are equivalent

Statistics
ProbabilityYou roll a number cube numbered one to six 12 times P 5 What type of probability is illustrated and why OA experimental the result is based on the number of possible outcomes OB experimental the result is found by repeating an experiment OC theoretical the result is based on the number of possible outcomes O D theoretical the result is found by repeating an experiment
Statistics
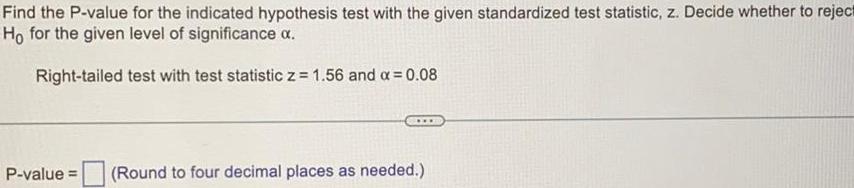
StatisticsFind the P value for the indicated hypothesis test with the given standardized test statistic z Decide whether to reject Ho for the given level of significance Right tailed test with test statistic z 1 56 and x 0 08 P value Round to four decimal places as needed

Statistics
StatisticsL a 0 27 Ob 1 c 2 d 3 requency of the value 3 e I don t know the answer 3 What is the relative frequency of the value 5 a 0 09 b 0 18 O c 2 O d 5

Statistics
StatisticsThe following set of numbers represents a sample of the data 2 3 3 3 4 4 5 5 6 6 7 Use this sample to answer the following questions Please answer the following questions 1 What is the frequency of the value 2 O a 0 09 O b 1 O c 2 O d 3 I don t know the answer

Statistics
StatisticsThe website of the large coporation CorpPlus claims that 93 of the population of all employees say the corporation is a great place to work You work for a competitor and think that this percentage is not a true indicator of CorpPlus s employee satisfaction To test the claim from the website you will survey a random sample of 75 employees from CorpPlus and ask them whether they think the corporation is a great place to work Follow the steps below to construct a 99 confidence interval for the population proportion of all employees who say the corporation is a great place to work Then state whether the confidence interval you construct contradicts the website s claim If necessary consult a list of formulas a Click on Take Sample to see the results from the random sample Take Sample Sample size 0 Point estimate 0 Critical value 0 Compute Says the corporation is a great place to work 0 000 Does not say the corporation is a great place to work 0 000 Enter the values of the sample size the point estimate of the population proportion and the critical value you need for your 99 confidence interval Choose the correct critical value from the table of critical values provided When you are done select Compute Standard error Margin of error 99 confidence interval Number 99 confidence interval 0 500 63 O No the confidence interval does not contradict the claim The proportion 0 93 from the website is inside the 99 confidence interval 12 O No the confidence interval does not contradict the claim The proportion 0 93 from the website is outside the 99 confidence interval b Based on your sample graph the 99 confidence interval for the population proportion of all employees who say the corporation is a great place to work O Yes the confidence interval contradicts the claim The proportion 0 93 from the website is inside the 99 confidence interval Enter the values for the lower and upper limits on the graph to Ishow your confidence interval For the point enter the claim 0 93 from the website Yes the confidence interval contradicts the claim The proportion 0 93 from the website is outside the Proportion 0 84 X 0 16 values 0 005 2 576 0 010 2 326 X 0 025 1 960 20 050 1 645 20 100 1 282 X c Does the 99 confidence interval you constructed contradict the claim from the website Choose the best answer from the choices below S 1 000 1 000 3

Statistics
Statistics1 How does the Condorcet method differ from the Borda count 1 point O The Condorcet method does not assign points for all of the values The Condorcet method requires a majority of the available voters to choose one candidate The Borda count cannot have a tie vote however tie votes are permitted in the Condorcet meth The Borda count winner must win against each candidate every time

Statistics
Statisticsadvertisement for this lottery claims that 42 of the population of all the scratchers are winning ones You want to research this claim by selecting a random sample of 48 scratchers Follow the steps below to construct a 95 confidence interval for the population proportion of all winning scratchers Then state whether the confidence interval you construct contradicts the advertisement s claim If necessary consult a list of formulas a Click on Take Sample to see the results from the random sample Take Sample Sample size Point estimate 0 Critical value 0 Compute Winning scratcher Losing scratcher Enter the values of the sample size the point estimate of the population proportion and the critical value you need for your 95 confidence interval Choose the correct critical value from the table of critical values provided When you are done select Compute 0 000 Number 0 000 12 36 Proportion 0 25 0 75 Standard error Margin of error 95 confidence interval 95 confidence interval 0 500 b Based on your sample graph the 95 confidence interval for the population proportion of all winning scratchers Enter the values for the lower and upper limits on the graph to show your confidence interval For the point enter the claim 0 42 from the advertisement X O No the confidence interval does not contradict the claim The proportion 0 42 from the advertisement is inside the 95 confidence interval Critical values No the confidence interval does not contradict the claim The proportion 0 42 from the advertisement is outside the 95 confidence interval 0 005 2 576 20 010 2 326 20 025 1 960 0 050 1 645 0 100 1 282 O Yes the confidence interval contradicts the claim The proportion 0 42 from the advertisement is inside the 95 confidence interval Yes the confidence interval contradicts the claim c Does the 95 confidence interval you constructed contradict the claim from the advertisement Choose the best answer from the choices below S 1 000 1 000 5 A M

Statistics
StatisticsHow does a preference ballot give a voter more choices in an election 1 point O Every candidate on a preference ballot is ranked by the voter instead of just one candidate There are more candidate names on a preference ballot than there are on a traditional ballot The voter has more line items to fill out on a traditional ballot than on a preference ballot There are fewer candidates on the preference ballot but a vote on a preference ballot carries mor weight

Statistics
StatisticsWhich best expresses a potential difficulty with preference ballots 1 point Because preference ballots are so rare it is easy to forge extra copies of them and vote illegally Preference ballots only work in two candidate races and most races have at least three candidates Preference ballots are easy to understand but hard to produce and distribute to polling places OFilling out a preference ballot for each position being voted on can be time consuming