Statistics Questions
The best high school and college tutors are just a click away, 24×7! Pick a subject, ask a question, and get a detailed, handwritten solution personalized for you in minutes. We cover Math, Physics, Chemistry & Biology.
Statistics
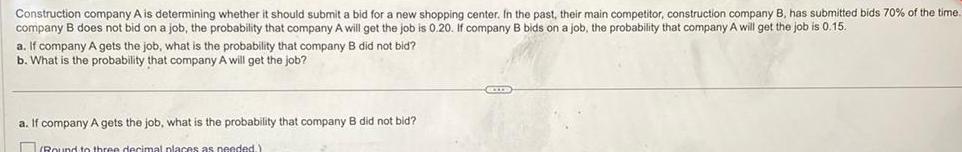
ProbabilityConstruction company A is determining whether it should submit a bid for a new shopping center In the past their main competitor construction company B has submitted bids 70 of the time company B does not bid on a job the probability that company A will get the job is 0 20 If company B bids on a job the probability that company A will get the job is 0 15 a If company A gets the job what is the probability that company B did not bid b What is the probability that company A will get the job a If company A gets the job what is the probability that company B did not bid Round to three decimal places as needed CCIDIS
Statistics
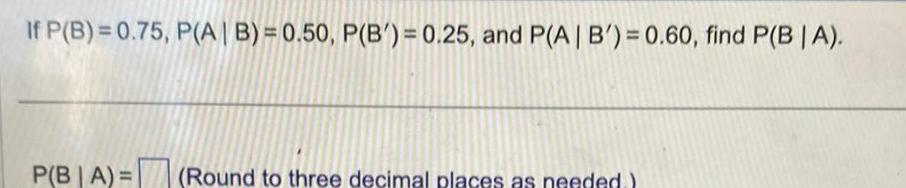
StatisticsIf P B 0 75 P A B 0 50 P B 0 25 and P A B 0 60 find P B A P B A Round to three decimal places as needed
Statistics
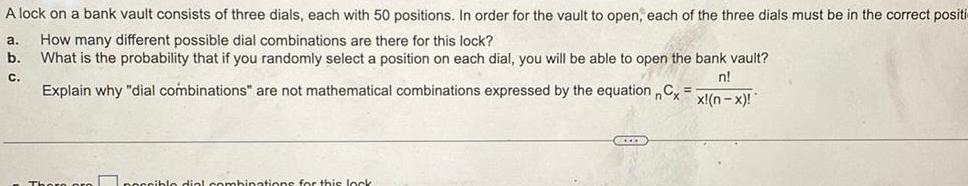
ProbabilityA lock on a bank vault consists of three dials each with 50 positions In order for the vault to open each of the three dials must be in the correct positi a How many different possible dial combinations are there for this lock b What is the probability that if you randomly select a position on each dial you will be able to open the bank vault C n Explain why dial combinations are not mathematical combinations expressed by the equation Cx x n x poccible dial combinations for this lock GEXEM
Statistics
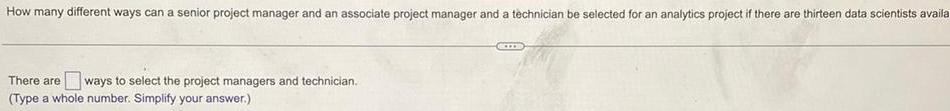
StatisticsHow many different ways can a senior project manager and an associate project manager and a technician be selected for an analytics project if there are thirteen data scientists availa There are ways to select the project managers and technician Type a whole number Simplify your answer
Statistics
ProbabilityA daily lottery is conducted in which 4 winning numbers are selected out of 39 numbers without duplication How many different combinations of winning numbers are possible There are different combinations of winning numbers Type a whole number
Statistics
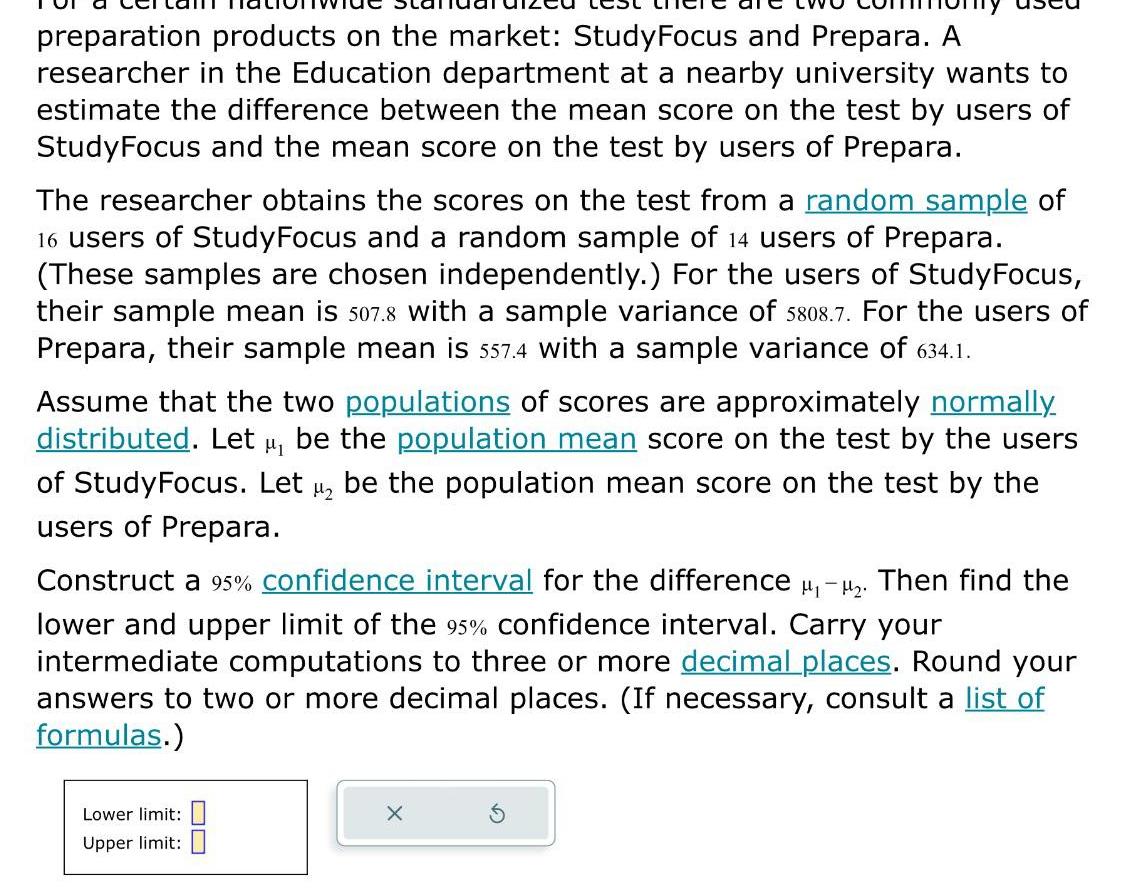
Statisticspreparation products on the market Study Focus and Prepara A researcher in the Education department at a nearby university wants to estimate the difference between the mean score on the test by users of StudyFocus and the mean score on the test by users of Prepara The researcher obtains the scores on the test from a random sample of 16 users of StudyFocus and a random sample of 14 users of Prepara These samples are chosen independently For the users of StudyFocus their sample mean is 507 8 with a sample variance of 5808 7 For the users of Prepara their sample mean is 557 4 with a sample variance of 634 1 Assume that the two populations of scores are approximately normally distributed Let be the population mean score on the test by the users of StudyFocus Let 1 be the population mean score on the test by the users of Prepara Construct a 95 confidence interval for the difference Then find the lower and upper limit of the 95 confidence interval Carry your intermediate computations to three or more decimal places Round your answers to two or more decimal places If necessary consult a list of formulas Lower limit Upper limit X
Statistics
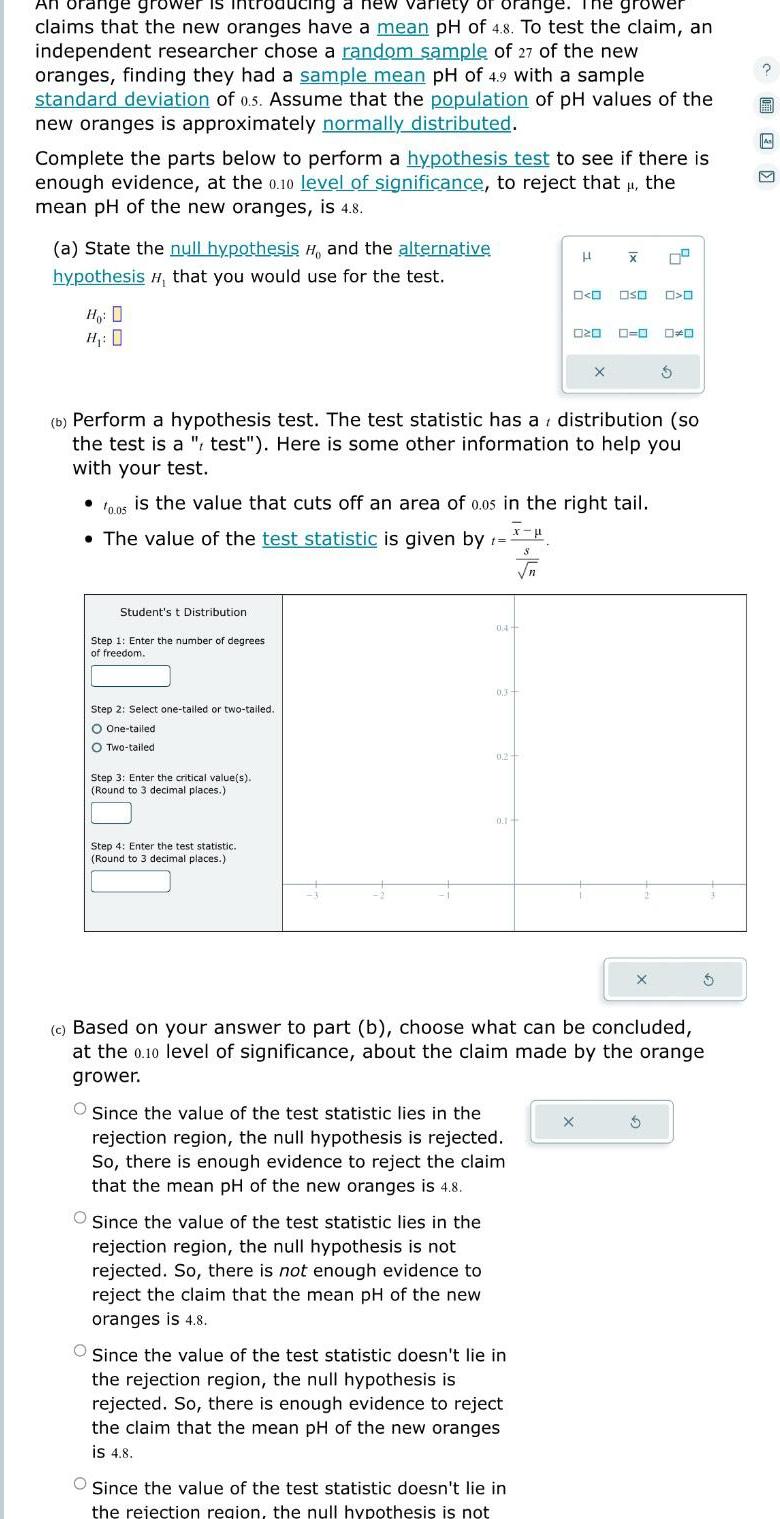
StatisticsAn orange grower is introducing a new variety of orange The grower claims that the new oranges have a mean pH of 4 8 To test the claim an independent researcher chose a random sample of 27 of the new oranges finding they had a sample mean pH of 4 9 with a sample standard deviation of 0 5 Assume that the population of pH values of the new oranges is approximately normally distributed Complete the parts below to perform a hypothesis test to see if there is enough evidence at the 0 10 level of significance to reject that the mean pH of the new oranges is 4 8 a State the null hypothesis H and the alternative hypothesis that you would use for the test Ho D H 0 Student s t Distribution Step 1 Enter the number of degrees of freedom Step 2 Select one tailed or two tailed O One tailed O Two tailed Step 3 Enter the critical value s Round to 3 decimal places Step 4 Enter the test statistic Round to 3 decimal places 10 05 is the value that cuts off an area of 0 05 in the right tail The value of the test statistic is given by t 04 b Perform a hypothesis test The test statistic has a distribution so the test is a test Here is some other information to help you with your test 0 3 Since the value of the test statistic lies in the rejection region the null hypothesis is not rejected So there is not enough evidence to reject the claim that the mean pH of the new oranges is 4 8 0 2 0 1 O Since the value of the test statistic lies in the rejection region the null hypothesis is rejected So there is enough evidence to reject the claim that the mean pH of the new oranges is 4 8 Since the value of the test statistic doesn t lie in the rejection region the null hypothesis is rejected So there is enough evidence to reject the claim that the mean pH of the new oranges is 4 8 H O O S Since the value of the test statistic doesn t lie in the rejection region the null hypothesis is not 020 X X X OSO 0 0 c Based on your answer to part b choose what can be concluded at the 0 10 level of significance about the claim made by the orange grower X O O S 1997 As M
Statistics
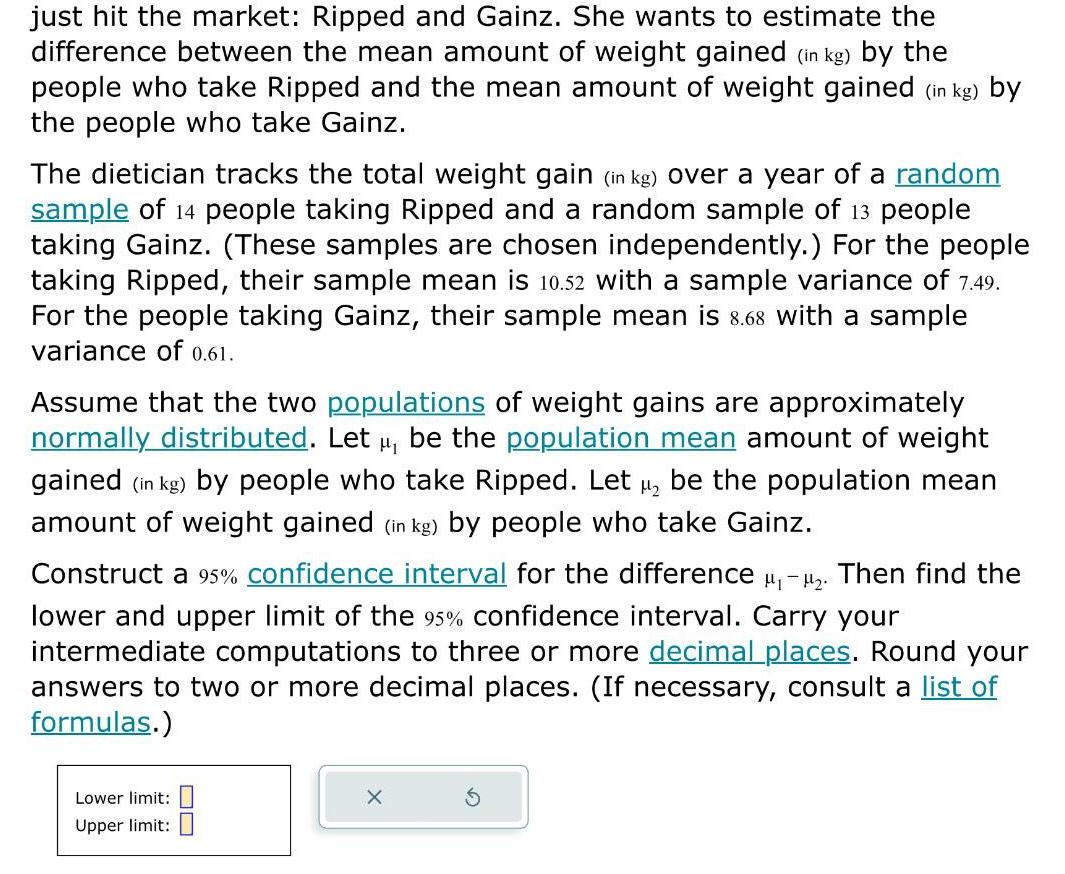
Statisticsjust hit the market Ripped and Gainz She wants to estimate the difference between the mean amount of weight gained in kg by the people who take Ripped and the mean amount of weight gained in kg by the people who take Gainz The dietician tracks the total weight gain in kg over a year of a random sample of 14 people taking Ripped and a random sample of 13 people taking Gainz These samples are chosen independently For the people taking Ripped their sample mean is 10 52 with a sample variance of 7 49 For the people taking Gainz their sample mean is 8 68 with a sample variance of 0 61 Assume that the two populations of weight gains are approximately normally distributed Let be the population mean amount of weight gained in kg by people who take Ripped Let be the population mean amount of weight gained in kg by people who take Gainz Construct a 95 confidence interval for the difference Then find the lower and upper limit of the 95 confidence interval Carry your intermediate computations to three or more decimal places Round your answers to two or more decimal places If necessary consult a list of formulas Lower limit Upper limit 8
Statistics
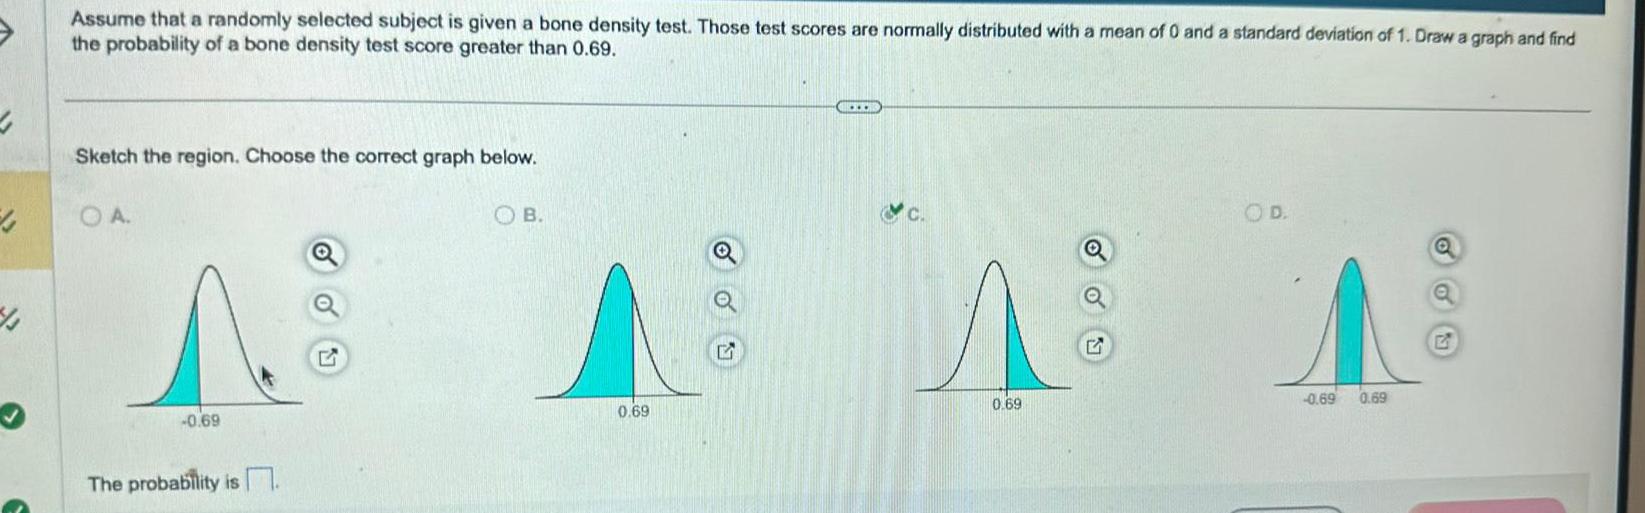
Probability4 43 Assume that a randomly selected subject is given a bone density test Those test scores are normally distributed with a mean of 0 and a standard deviation of 1 Draw a graph and find the probability of a bone density test score greater than 0 69 Sketch the region Choose the correct graph below OA 0 69 The probability is OB 0 69 0 69 OD A 0 69 0 69

Statistics
StatisticsWhen a scientist conducted a genetics experiments with peas one sample of offspring consisted of 909 peas with 686 of them having red flowers If we assume as the scientist did that under these circumstances there is a 3 4 probability that a pea will have a red flower we would expect that 681 75 or about 682 of the peas would have red flowers so the result of 686 peas with red flowers is more than expected a If the scientist s assumed probability is correct find the probability of getting 686 or more peas with red flowers b Is 686 peas with red flowers significantly high c What do these results suggest about the scientist s assumption that 3 4 of peas will have red flowers
Statistics
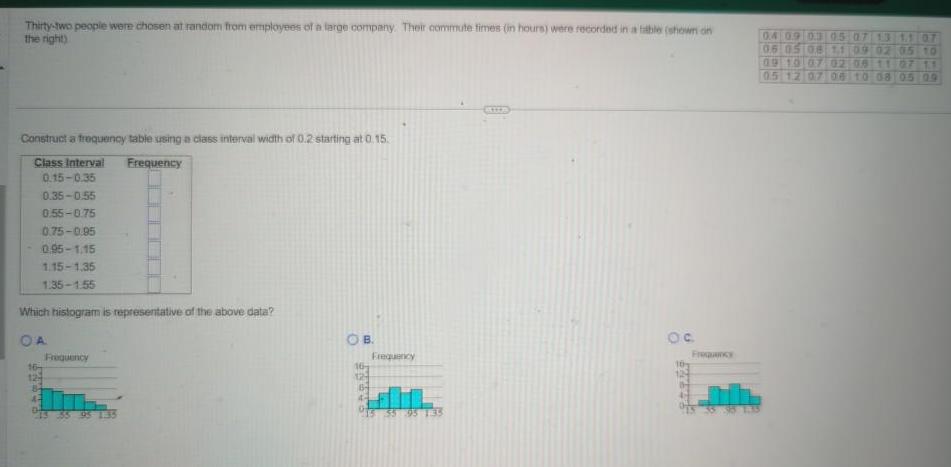
ProbabilityThirty two people were chosen at random from employees of a large company Their commute times in hours were recorded in a table shown on the right Construct a frequency table using a class interval width of 0 2 starting at 0 15 Class Interval Frequency 0 15 0 35 0 35 0 55 0 55 0 75 0 75 0 95 0 95 1 15 1 15 1 35 1 35 1 55 Which histogram is representative of the above data OA 16 124 84 43 Frequency 55 95 1 35 OB 16 13522 Frequency 55 95 135 Oc 0 4 0 9 0 3 05 07 13 11 07 06 05 08 11 09 02 05 10 09 10 07 02 08 11 07 11 0 5 12 07 06 10 08 05 09
Statistics
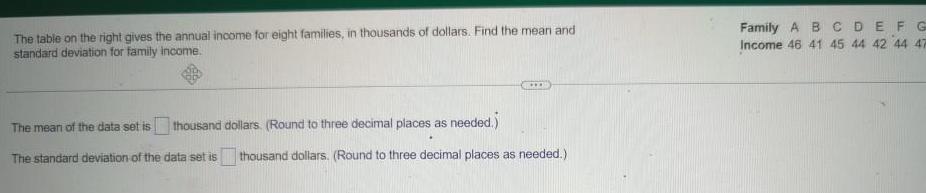
StatisticsThe table on the right gives the annual income for eight families in thousands of dollars Find the mean and standard deviation for family income thousand dollars Round to three decimal places as needed The mean of the data set is The standard deviation of the data set is thousand dollars Round to three decimal places as needed Family ABCDEFG Income 46 41 45 44 42 44 47
Statistics
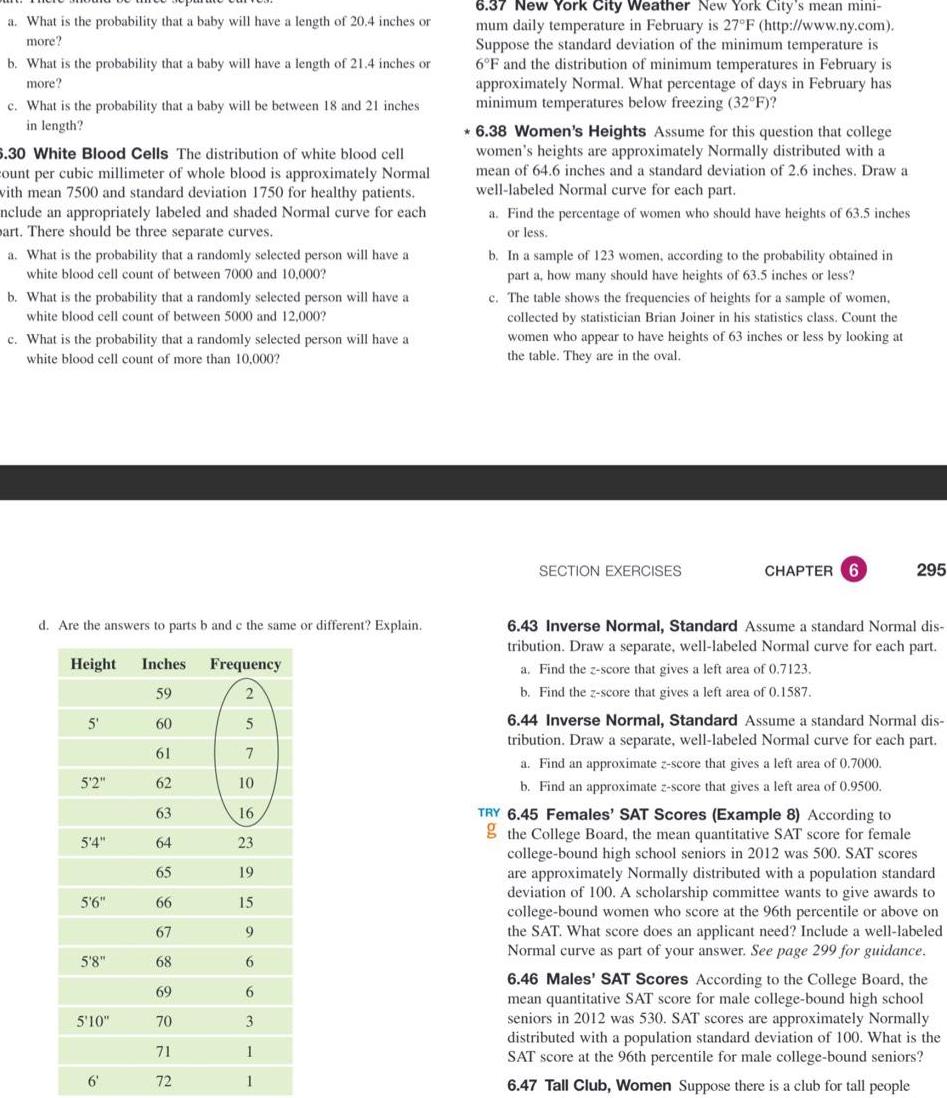
Statisticsa What is the probability that a baby will have a length of 20 4 inches or more b What is the probability that a baby will have a length of 21 4 inches or more c What is the probability that a baby will be between 18 and 21 inches in length 5 30 White Blood Cells The distribution of white blood cell count per cubic millimeter of whole blood is approximately Normal with mean 7500 and standard deviation 1750 for healthy patients nclude an appropriately labeled and shaded Normal curve for each mart There should be three separate curves a What is the probability that a randomly selected person will have a white blood cell count of between 7000 and 10 000 b What is the probability that a randomly selected person will have a white blood cell count of between 5000 and 12 000 c What is the probability that a randomly selected person will have a white blood cell count of more than 10 000 d Are the answers to parts b and c the same or different Explain Height Inches Frequency 59 5 5 2 5 4 5 6 5 8 5 10 6 60 61 62 63 64 65 66 67 68 69 70 71 72 5 7 10 16 23 19 15 9 6 6 3 1 1 6 37 New York City Weather New York City s mean mini mum daily temperature in February is 27 F http www ny com Suppose the standard deviation of the minimum temperature is 6 F and the distribution of minimum temperatures in February is approximately Normal What percentage of days in February has minimum temperatures below freezing 32 F 6 38 Women s Heights Assume for this question that college women s heights are approximately Normally distributed with a mean of 64 6 inches and a standard deviation of 2 6 inches Draw a well labeled Normal curve for each part a Find the percentage of women who should have heights of 63 5 inches or less b In a sample of 123 women according to the probability obtained in part a how many should have heights of 63 5 inches or less c The table shows the frequencies of heights for a sample of women collected by statistician Brian Joiner in his statistics class Count the women who appear to have heights of 63 inches or less by looking at the table They are in the oval SECTION EXERCISES CHAPTER 6 295 6 43 Inverse Normal Standard Assume a standard Normal dis tribution Draw a separate well labeled Normal curve for each part a Find the z score that gives a left area of 0 7123 b Find the z score that gives a left area of 0 1587 6 44 Inverse Normal Standard Assume a standard Normal dis tribution Draw a separate well labeled Normal curve for each part a Find an approximate z score that gives a left area of 0 7000 b Find an approximate z score that gives a left area of 0 9500 TRY 6 45 Females SAT Scores Example 8 According to the College Board the mean quantitative SAT score for female college bound high school seniors in 2012 was 500 SAT scores are approximately rmally distributed with a population standard deviation of 100 A scholarship committee wants to give awards to college bound women who score at the 96th percentile or above on the SAT What score does an applicant need Include a well labeled Normal curve as part of your answer See page 299 for guidance 6 46 Males SAT Scores According to the College Board the mean quantitative SAT score for male college bound high school seniors in 2012 was 530 SAT scores are approximately Normally distributed with a population standard deviation of 100 What is the SAT score at the 96th percentile for male college bound seniors 6 47 Tall Club Women Suppose there is a club for tall people
Statistics
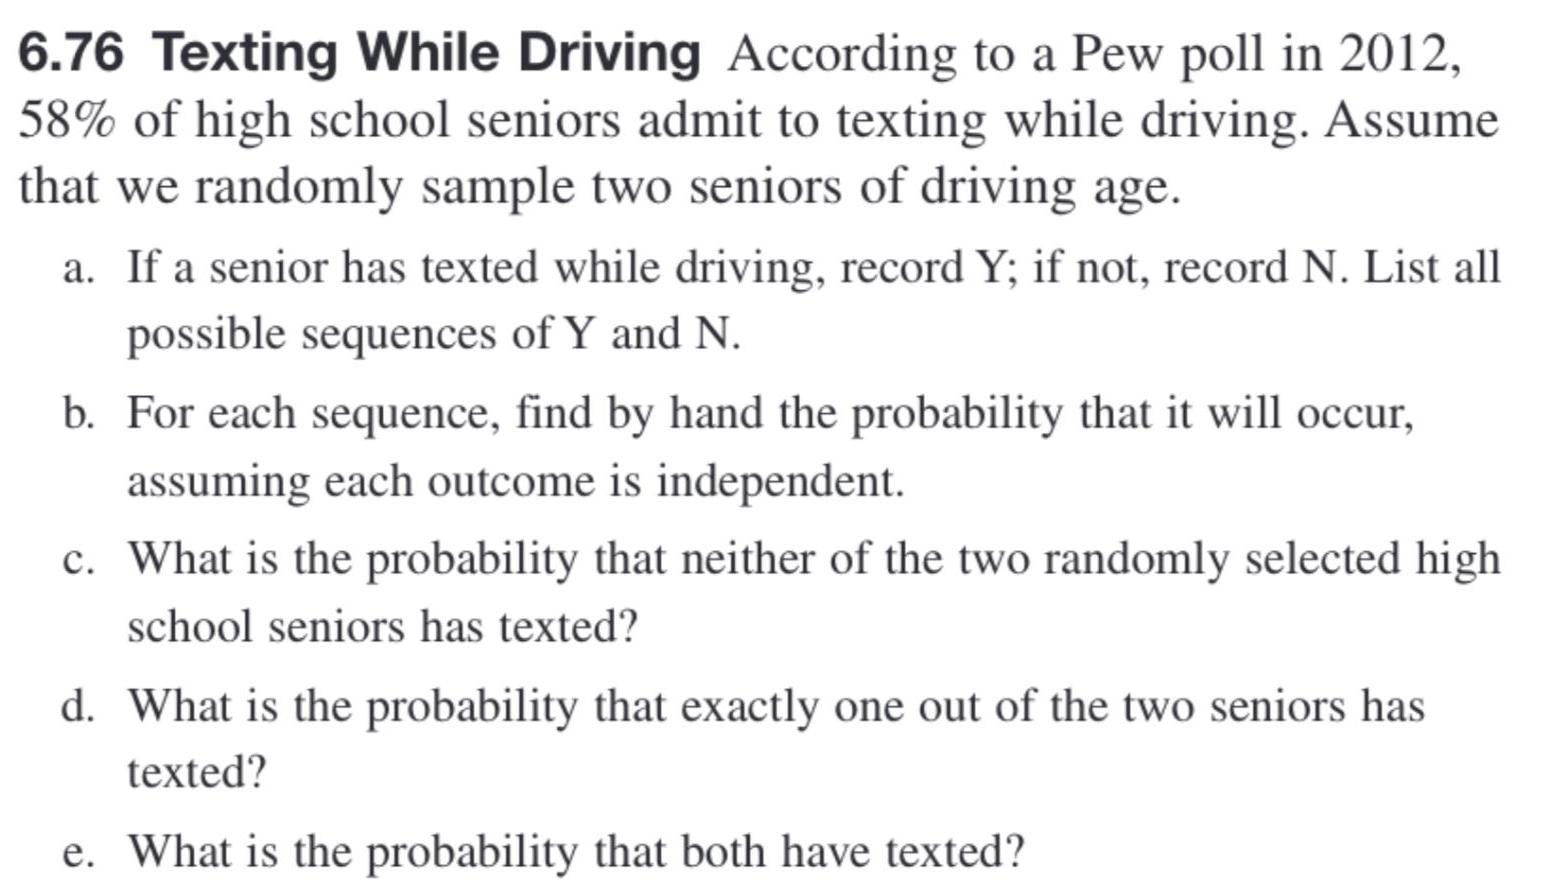
Probability6 76 Texting While Driving According to a Pew poll in 2012 58 of high school seniors admit to texting while driving Assume that we randomly sample two seniors of driving age a If a senior has texted while driving record Y if not record N List all possible sequences of Y and N b For each sequence find by hand the probability that it will occur assuming each outcome is independent c What is the probability that neither of the two randomly selected high school seniors has texted d What is the probability that exactly one out of the two seniors has texted e What is the probability that both have texted
Statistics
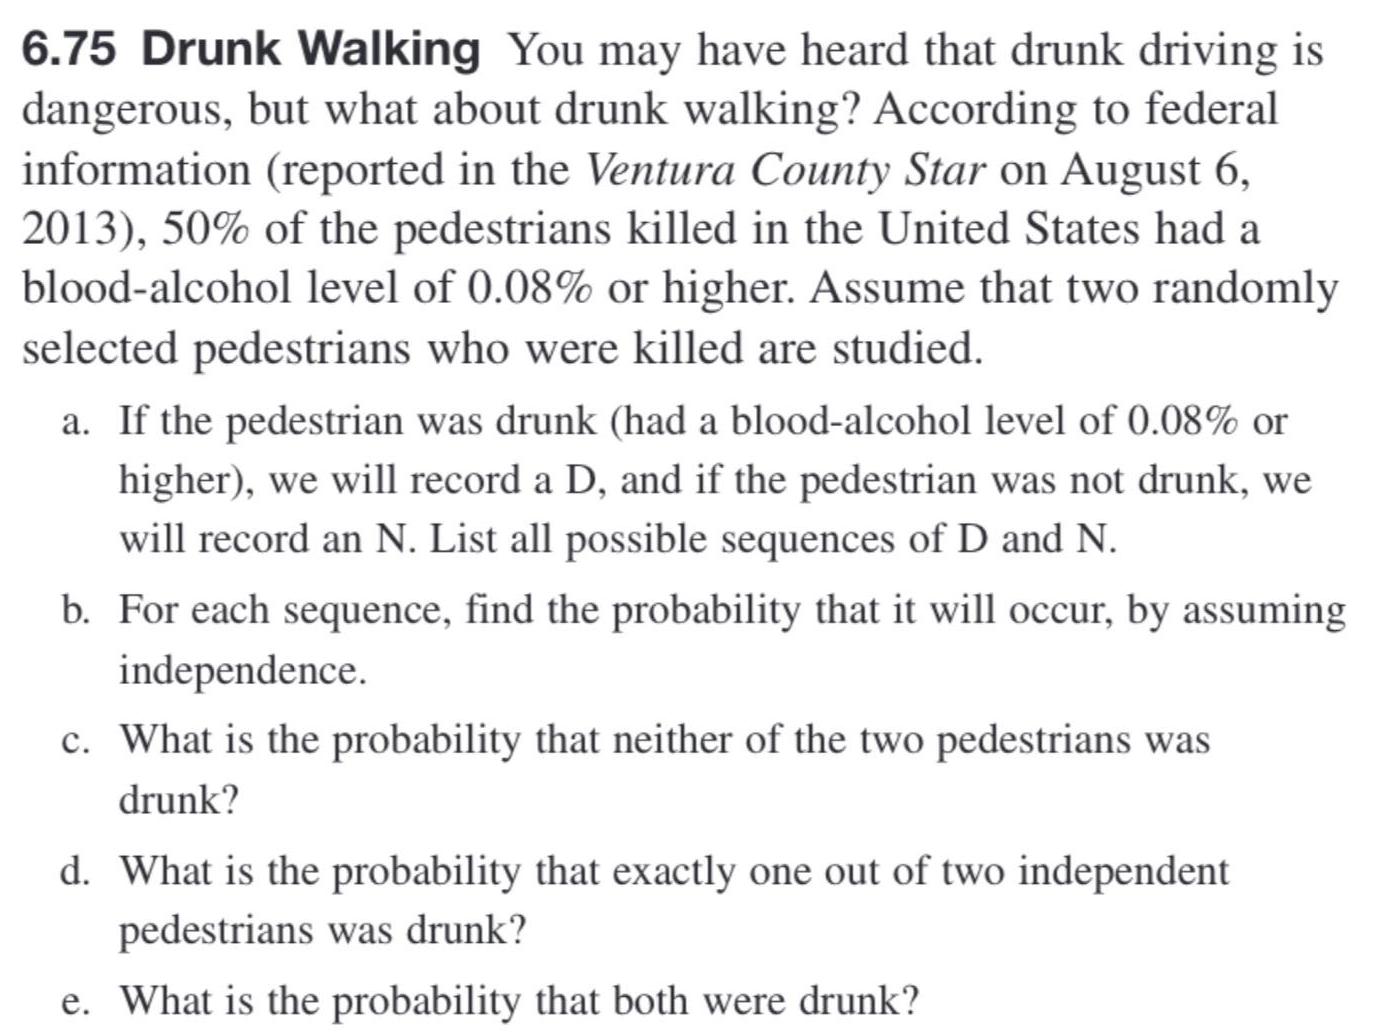
Probability6 75 Drunk Walking You may have heard that drunk driving is dangerous but what about drunk walking According to federal information reported in the Ventura County Star on August 6 2013 50 of the pedestrians killed in the United States had a blood alcohol level of 0 08 or higher Assume that two randomly selected pedestrians who were killed are studied a If the pedestrian was drunk had a blood alcohol level of 0 08 or higher we will record a D and if the pedestrian was not drunk we will record an N List all possible sequences of D and N b For each sequence find the probability that it will occur by assuming independence c What is the probability that neither of the two pedestrians was drunk d What is the probability that exactly one out of two independent pedestrians was drunk e What is the probability that both were drunk
Statistics
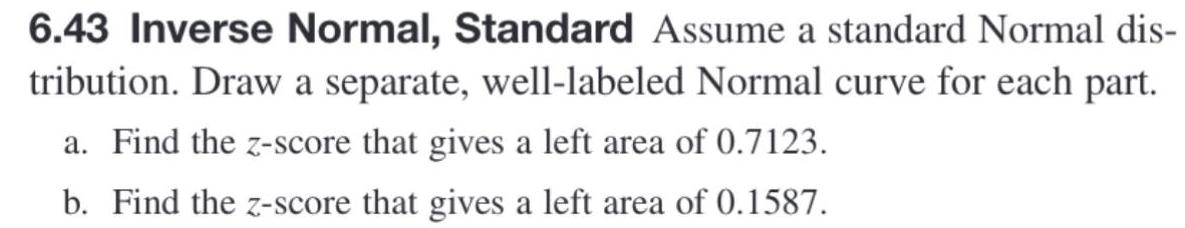
Statistics6 43 Inverse Normal Standard Assume a standard Normal dis tribution Draw a separate well labeled Normal curve for each part a Find the z score that gives a left area of 0 7123 b Find the z score that gives a left area of 0 1587

Statistics
Statistics1 20210401 634615 Los Angeles Dodgers 2 20210401 634615 Colorado Rockies 3 20210401 634618 Arizona Diamondbacks 4 20210401 634618 San Diego Padres 5 20210401 634622 Atlanta Braves 6 20210401 634622 Philadelphia Phillies 6 rows 1 10 of 12 columns I I I V H V H V H simp S27323 8 8 KUND OOT210 4 Kind 6 422049 12 10 10 13 COP
Statistics
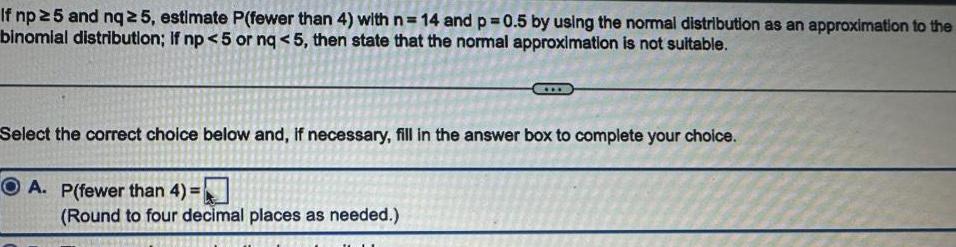
ProbabilityIf np 5 and nq 5 estimate P fewer than 4 with n 14 and p 0 5 by using the normal distribution as an approximation to the binomial distribution If np 5 or nq 5 then state that the normal approximation is not suitable Select the correct choice below and if necessary fill in the answer box to complete your choice A P fewer than 4 Round to four decimal places as needed
Statistics
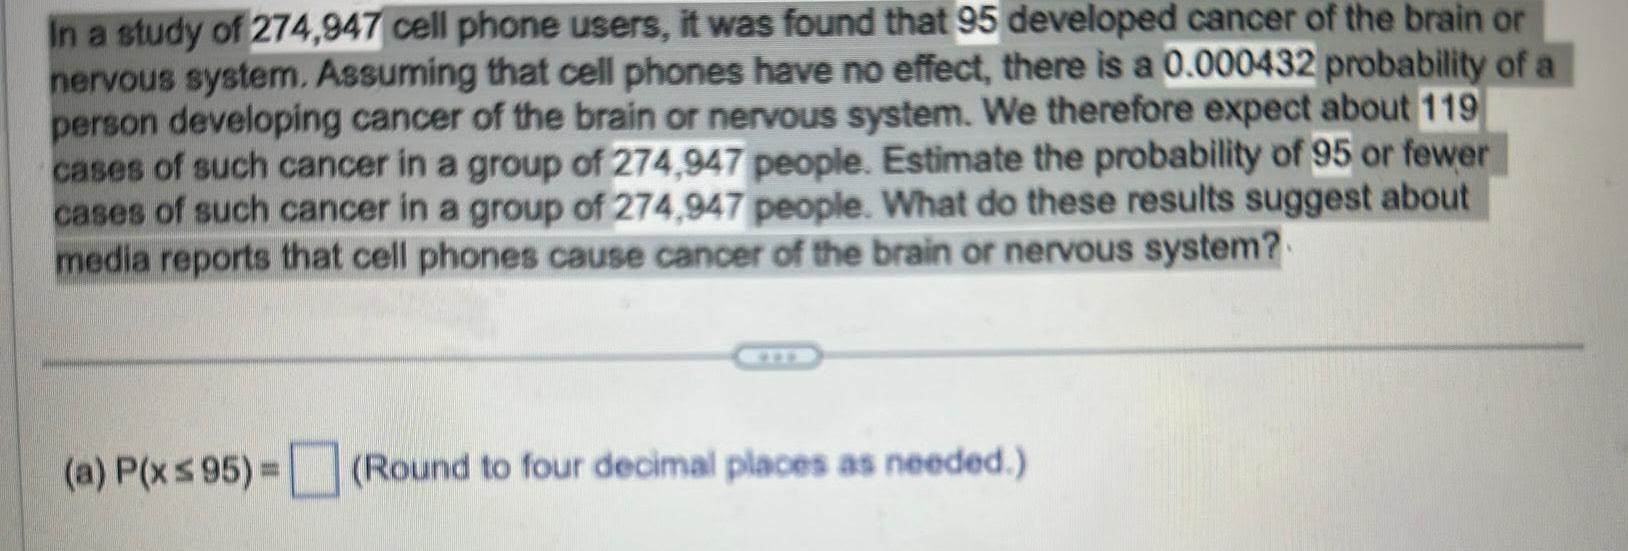
StatisticsIn a study of 274 947 cell phone users it was found that 95 developed cancer of the brain or nervous system Assuming that cell phones have no effect there is a 0 000432 probability of a person developing cancer of the brain or nervous system We therefore expect about 119 cases of such cancer in a group of 274 947 people Estimate the probability of 95 or fewer cases of such cancer in a group of 274 947 people What do these results suggest about media reports that cell phones cause cancer of the brain or nervous system a P x 95 Round to four decimal places as needed
Statistics
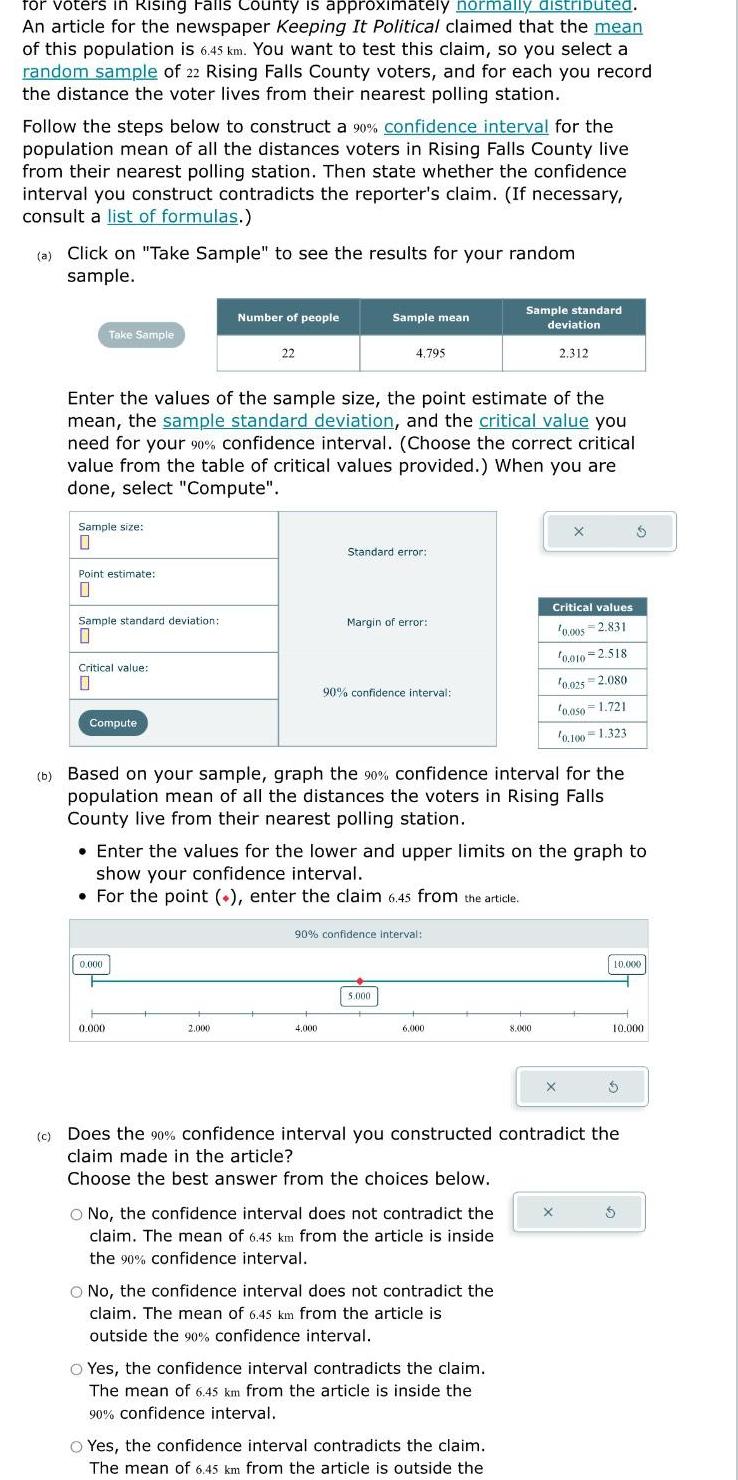
Statisticsfor voters in Rising Falls County is approximately normally distributed An article for the newspaper Keeping It Political claimed that the mean of this population is 6 45 km You want to test this claim so you select a random sample of 22 Rising Falls County voters and for each you record the distance the voter lives from their nearest polling station Follow the steps below to construct a 90 confidence interval for the population mean of all the distances voters in Rising Falls County live from their nearest polling station Then state whether the confidence interval you construct contradicts the reporter s claim If necessary consult a list of formulas a Click on Take Sample to see the results for your random sample Take Sample Sample size 0 Point estimate 0 Sample standard deviation 0 Critical value 0 Enter the values of the sample size the point estimate of the mean the sample standard deviation and the critical value you need for your 90 confidence interval Choose the correct critical value from the table of critical values provided When you are done select Compute Compute 0 000 Number of people 0 000 22 2 000 Sample mean 4 795 Standard error 4 000 Margin of error 90 confidence interval b Based on your sample graph the 90 confidence interval for the population mean of all the distances the voters in Rising Falls County live from their nearest polling station Enter the values for the lower and upper limits on the graph to show your confidence interval For the point enter the claim 6 45 from the article 90 confidence interval 5 000 6 000 Sample standard deviation 2 312 O No the confidence interval does not contradict the claim The mean of 6 45 km from the article is inside the 90 confidence interval O No the confidence interval does not contradict the claim The mean of 6 45 km from the article is outside the 90 confidence interval O Yes the confidence interval contradicts the claim The mean of 6 45 km from the article is inside the 90 confidence interval Critical values 0 005 2 831 O Yes the confidence interval contradicts the claim The mean of 6 45 km from the article is outside the 0 010 2 518 10 025 2 080 10 050 1 721 0 100 1 323 8 000 c Does the 90 confidence interval you constructed contradict the claim made in the article Choose the best answer from the choices below 10 000 10 000
Statistics
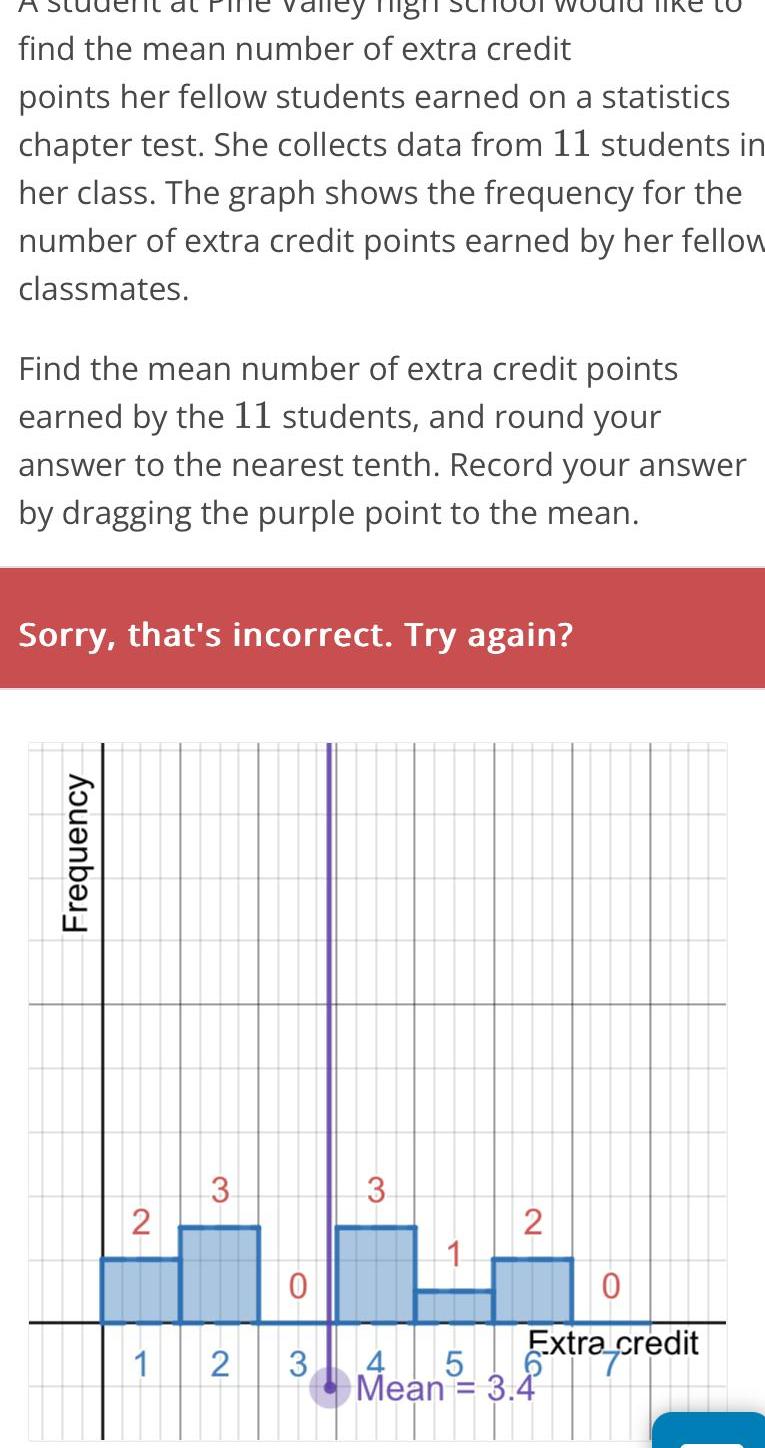
StatisticsTey mig find the mean number of extra credit points her fellow students earned on a statistics chapter test She collects data from 11 students in her class The graph shows the frequency for the number of extra credit points earned by her fellow classmates Find the mean number of extra credit points earned by the 11 students and round your answer to the nearest tenth Record your answer by dragging the purple point to the mean Sorry that s incorrect Try again Frequency 2 1 3 0 2 3 3 2 Extra credit 4 Mean 5 Mean 3 4
Statistics
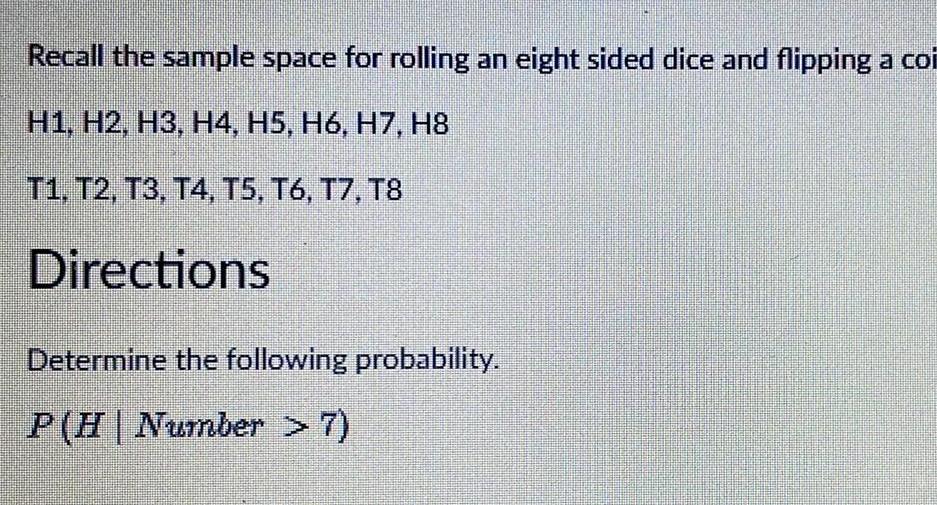
ProbabilityRecall the sample space for rolling an eight sided dice and flipping a coi H1 H2 H3 H4 H5 H6 H7 H8 T1 T2 T3 T4 T5 T6 T7 T8 Directions Determine the following probability P H Number 7
Statistics
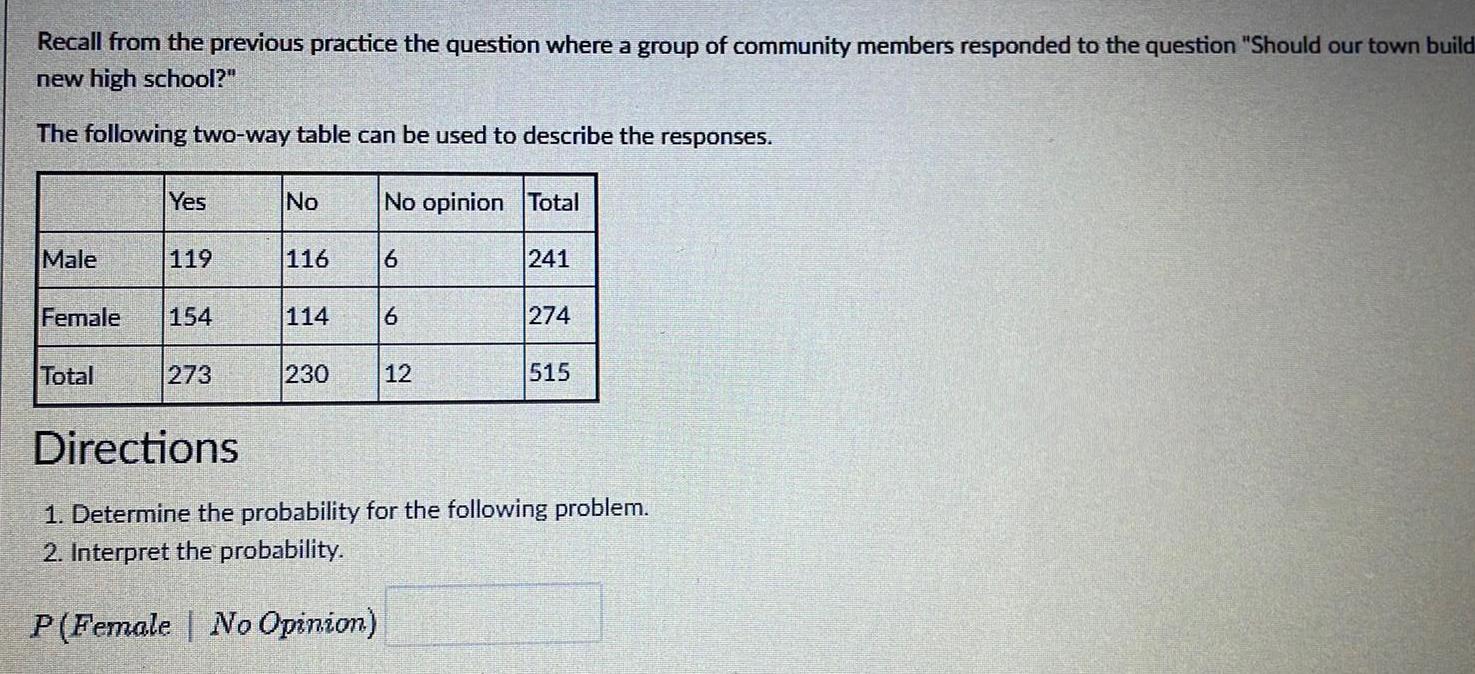
ProbabilityRecall from the previous practice the question where a group of community members responded to the question Should our town build new high school The following two way table can be used to describe the responses Male Yes Total 119 Female 154 273 No 116 114 230 No opinion Total 6 6 12 241 274 515 Directions 1 Determine the probability for the following problem 2 Interpret the probability P Female No Opinion
Statistics
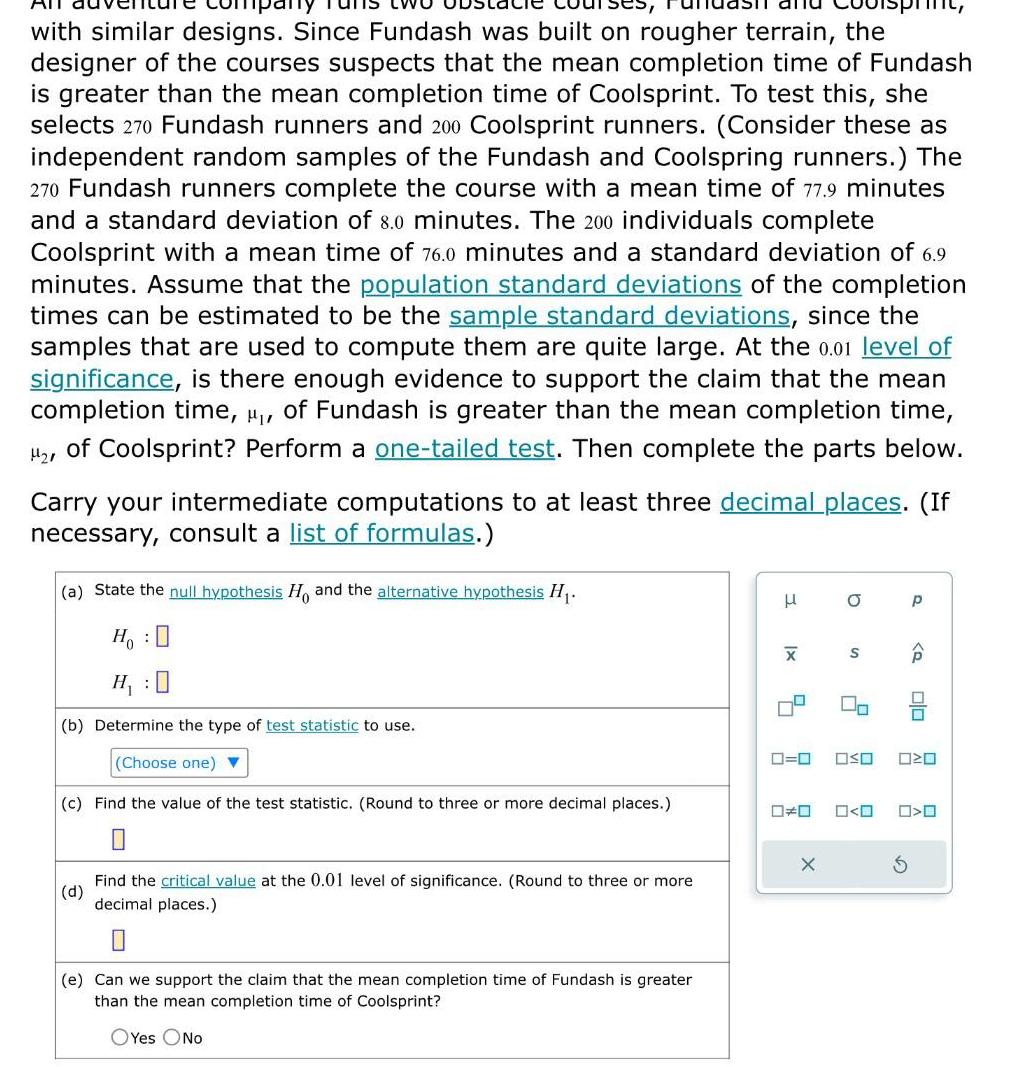
Statisticswith similar designs Since Fundash was built on rougher terrain the designer of the courses suspects that the mean completion time of Fundash is greater than the mean completion time of Coolsprint To test this she selects 270 Fundash runners and 200 Coolsprint runners Consider these as independent random samples of the Fundash and Coolspring runners The 270 Fundash runners complete the course with a mean time of 77 9 minutes and a standard deviation of 8 0 minutes The 200 individuals complete Coolsprint with a mean time of 76 0 minutes and a standard deviation of 6 9 minutes Assume that the population standard deviations of the completion times can be estimated to be the sample standard deviations since the samples that are used to compute them are quite large At the 0 01 level of significance is there enough evidence to support the claim that the mean completion time of Fundash is greater than the mean completion time of Coolsprint Perform a one tailed test Then complete the parts below Carry your intermediate computations to at least three decimal places If necessary consult a list of formulas a State the null hypothesis H and the alternative hypothesis H Ho H 0 b Determine the type of test statistic to use Choose one c Find the value of the test statistic Round to three or more decimal places 0 d Find the critical value at the 0 01 level of significance Round to three or more decimal places e Can we support the claim that the mean completion time of Fundash is greater than the mean completion time of Coolsprint OYes No 3 X a X S 2 00 P olo 0 0 OSO 020 O O 0
Statistics
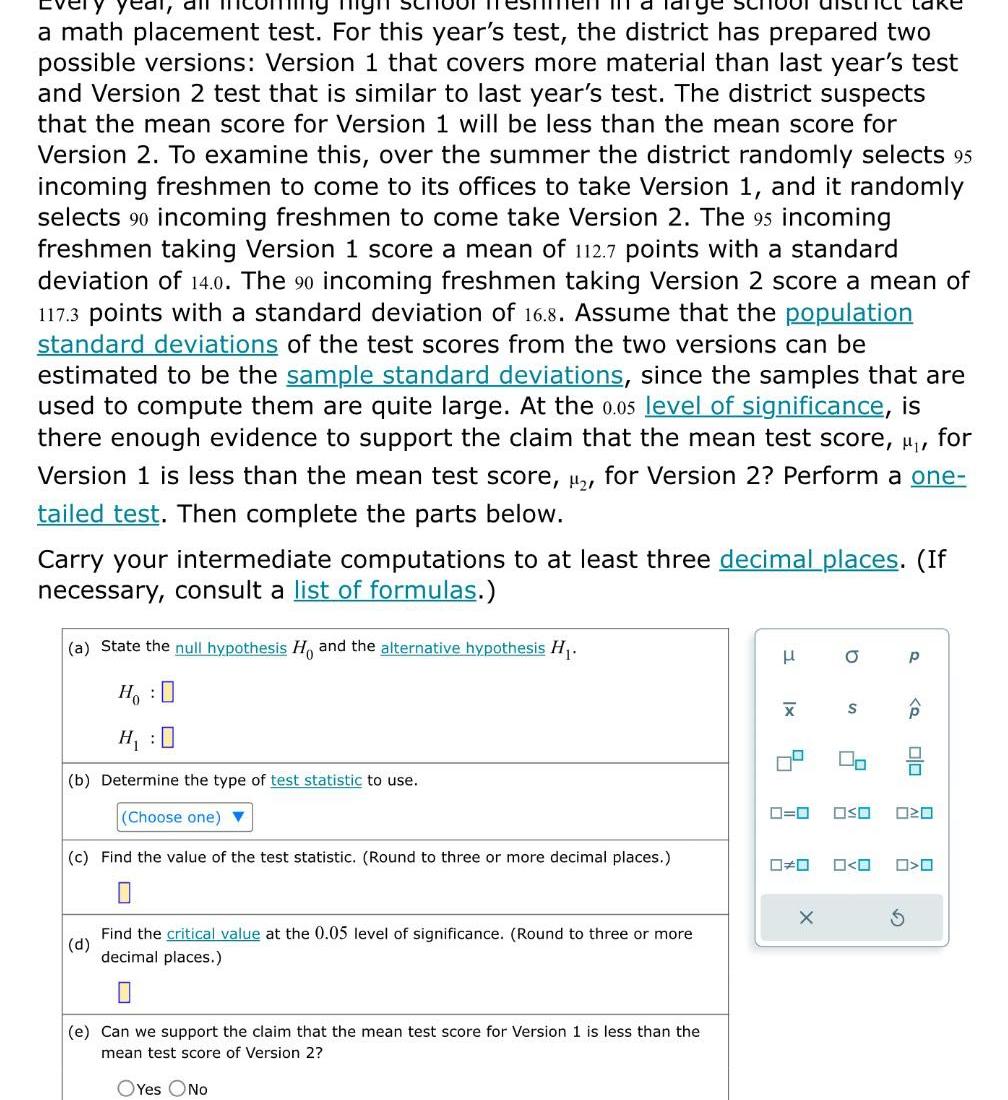
Statisticsal all a math placement test For this year s test the district has prepared two possible versions Version 1 that covers more material than last year s test and Version 2 test that is similar to last year s test The district suspects that the mean score for Version 1 will be less than the mean score for Version 2 To examine this over the summer the district randomly selects 95 incoming freshmen to come to its offices to take Version 1 and it randomly selects 90 incoming freshmen to come take Version 2 The 95 incoming freshmen taking Version 1 score a mean of 112 7 points with a standard deviation of 14 0 The 90 incoming freshmen taking Version 2 score a mean of 117 3 points with a standard deviation of 16 8 Assume that the population standard deviations of the test scores from the two versions can be estimated to be the sample standard deviations since the samples that are used to compute them are quite large At the 0 05 level of significance is there enough evidence to support the claim that the mean test score for Version 1 is less than the mean test score for Version 2 Perform a one tailed test Then complete the parts below MI Carry your intermediate computations to at least three decimal places If necessary consult a list of formulas a State the null hypothesis H and the alternative hypothesis H HO b Determine the type of test statistic to use Choose one c Find the value of the test statistic Round to three or more decimal places 0 d Find the critical value at the 0 05 level of significance Round to three or more decimal places e Can we support the claim that the mean test score for Version 1 is less than the mean test score of Version 2 OYes No H X 5 0 0 X O S 2 00 OSO O O P Q olo 020 O O
Statistics
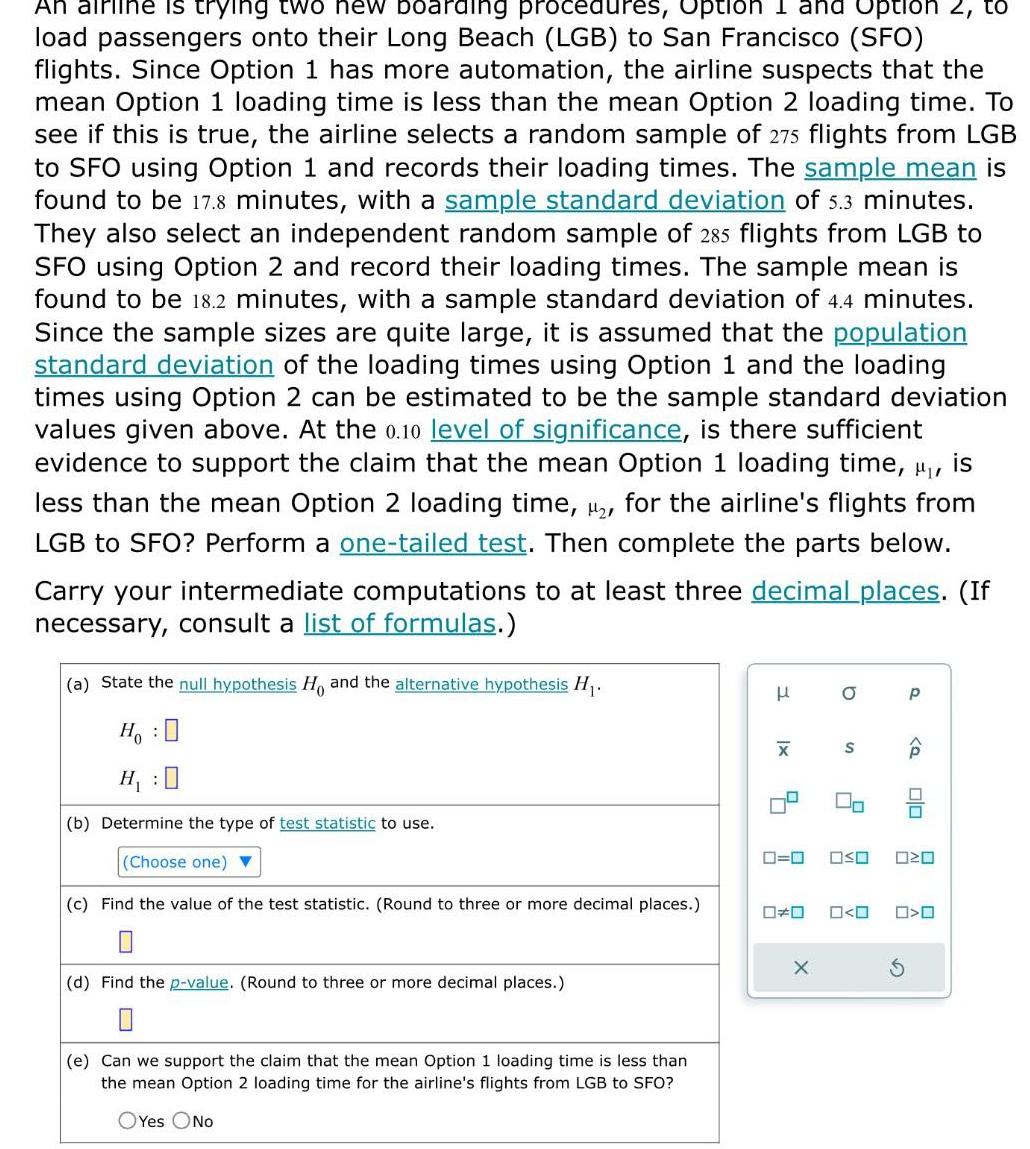
StatisticsAn airline is trying two new boarding procedures Option I and Option 2 to load passengers onto their Long Beach LGB to San Francisco SFO flights Since Option 1 has more automation the airline suspects that the mean Option 1 loading time is less than the mean Option 2 loading time To see if this is true the airline selects a random sample of 275 flights from LGB to SFO using Option 1 and records their loading times The sample mean is found to be 17 8 minutes with a sample standard deviation of 5 3 minutes They also select an independent random sample of 285 flights from LGB to SFO using Option 2 and record their loading times The sample mean is found to be 18 2 minutes with a sample standard deviation of 4 4 minutes Since the sample sizes are quite large it is assumed that the population standard deviation of the loading times using Option 1 and the loading times using Option 2 can be estimated to be the sample standard deviation values given above At the 0 10 level of significance is there sufficient evidence support the claim that the mean Option loading time is less than the mean Option 2 loading time 2 for the airline s flights from LGB to SFO Perform a one tailed test Then complete the parts below Carry your intermediate computations to at least three decimal places If necessary consult a list of formulas a State the null hypothesis Ho and the alternative hypothesis H Ho H 0 b Determine the type of test statistic to use Choose one c Find the value of the test statistic Round to three or more decimal places 0 d Find the p value Round to three or more decimal places e Can we support the claim that the mean Option 1 loading time is less than the mean Option 2 loading time for the airline s flights from LGB to SFO OYes No H XI 8 X a S 0 P 0 0 Q 00 OSO 0 O
Statistics
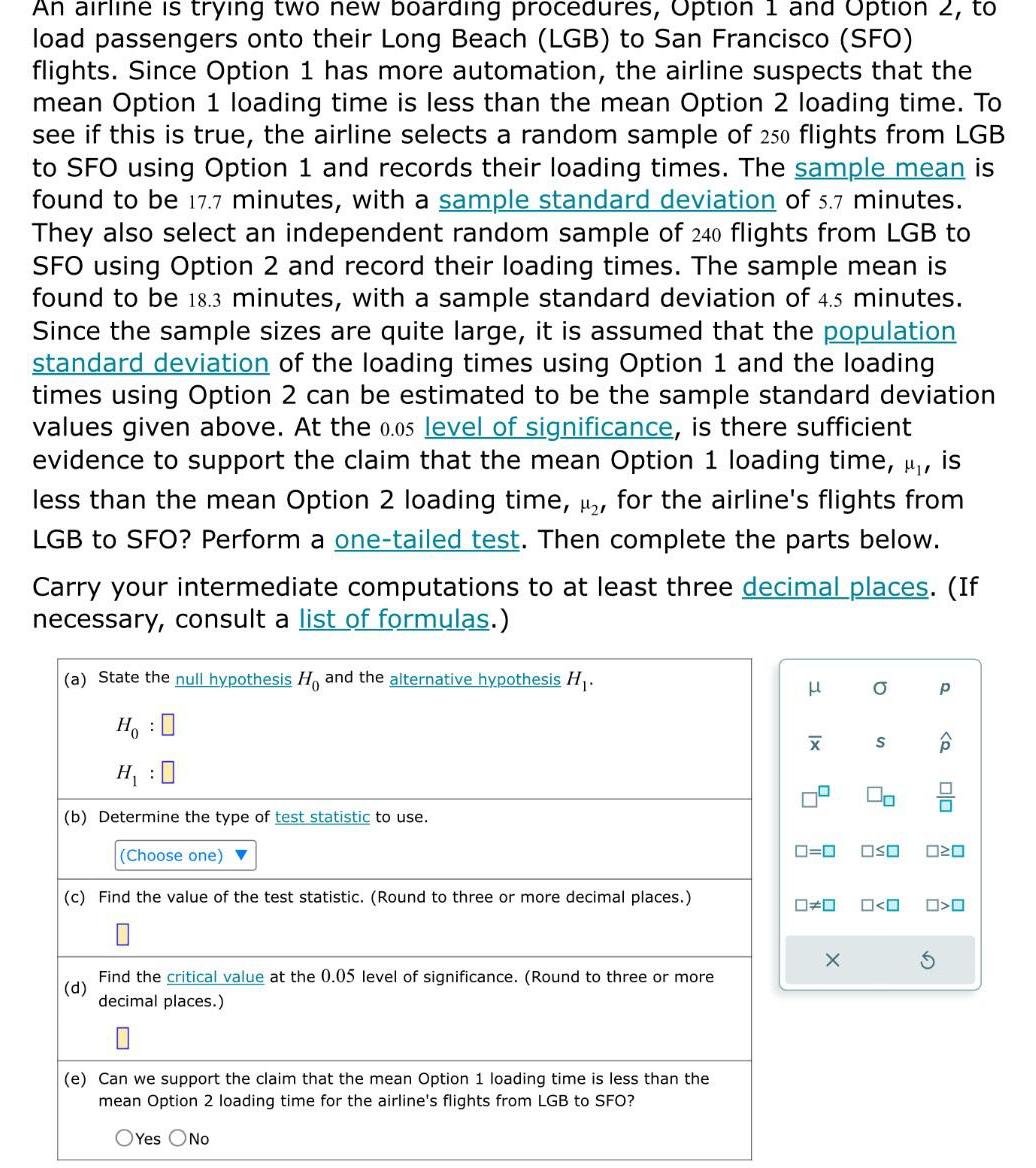
StatisticsAn airline is trying two new boarding procedures Option 1 and Option 2 to load passengers onto their Long Beach LGB to San Francisco SFO flights Since Option 1 has more automation the airline suspects that the mean Option 1 loading time is less than the mean Option 2 loading time To see if this is true the airline selects a random sample of 250 flights from LGB to SFO using Option 1 and records their loading times The sample mean is found to be 17 7 minutes with a sample standard deviation of 5 7 minutes They also select an independent random sample of 240 flights from LGB to SFO using Option 2 and record their loading times The sample mean is found to be 18 3 minutes with a sample standard deviation of 4 5 minutes Since the sample sizes are quite large it is assumed that the population standard deviation of the loading times using Option 1 and the loading times using Option 2 can be estimated to be the sample standard deviation values given above At the 0 05 level of significance is there sufficient evidence to support the claim that the mean Option 1 loading time u is less than the mean Option 2 loading time for the airline s flights from LGB to SFO Perform a one tailed test Then complete the parts below Carry your intermediate computations to at least three decimal places If necessary consult a list of formulas a State the null hypothesis Ho and the alternative hypothesis H Ho H 0 b Determine the type of test statistic to use Choose one c Find the value of the test statistic Round to three or more decimal places d Find the critical value at the 0 05 level of significance Round to three or more decimal places 0 e Can we support the claim that the mean Option 1 loading time is less than the mean Option 2 loading time for the airline s flights from LGB to SFO OYes No x X 4 0 0 X O S 2 OSO 0 0 P olo 020 O
Statistics
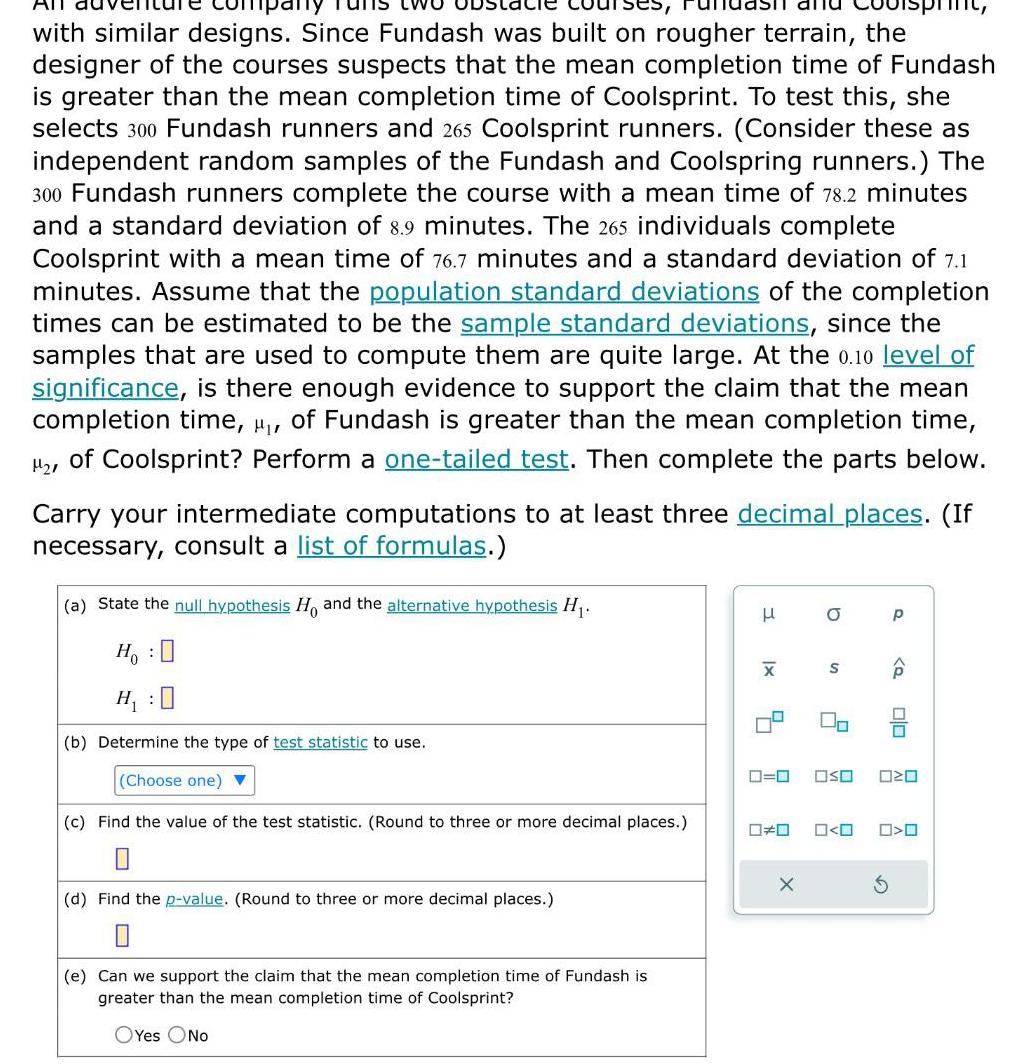
StatisticsAll with similar designs Since Fundash was built on rougher terrain the designer of the courses suspects that the mean completion time of Fundash is greater than the mean completion time of Coolsprint To test this she selects 300 Fundash runners and 265 Coolsprint runners Consider these as independent random samples of the Fundash and Coolspring runners The 300 Fundash runners complete the course with a mean time of 78 2 minutes and a standard deviation of 8 9 minutes The 265 individuals complete Coolsprint with a mean time of 76 7 minutes and a standard deviation of 7 1 minutes Assume that the population standard deviations of the completion times can be estimated to be the sample standard deviations since the samples that are used to compute them are quite large At the 0 10 level of significance is there enough evidence to support the claim that the mean completion time of Fundash is greater than the mean completion time of Coolsprint Perform a one tailed test Then complete the parts below Carry your intermediate computations to at least three decimal places If necessary consult a list of formulas a State the null hypothesis Ho and the alternative hypothesis H Ho 0 H 0 b Determine the type of test statistic to use Choose one c Find the value of the test statistic Round to three or more decimal places d Find the p value Round to three or more decimal places e Can we support the claim that the mean completion time of Fundash is greater than the mean completion time of Coolsprint OYes No 3 x X 0 0 D X O S 2 p Q 00 OSO 020 O O 0
Statistics
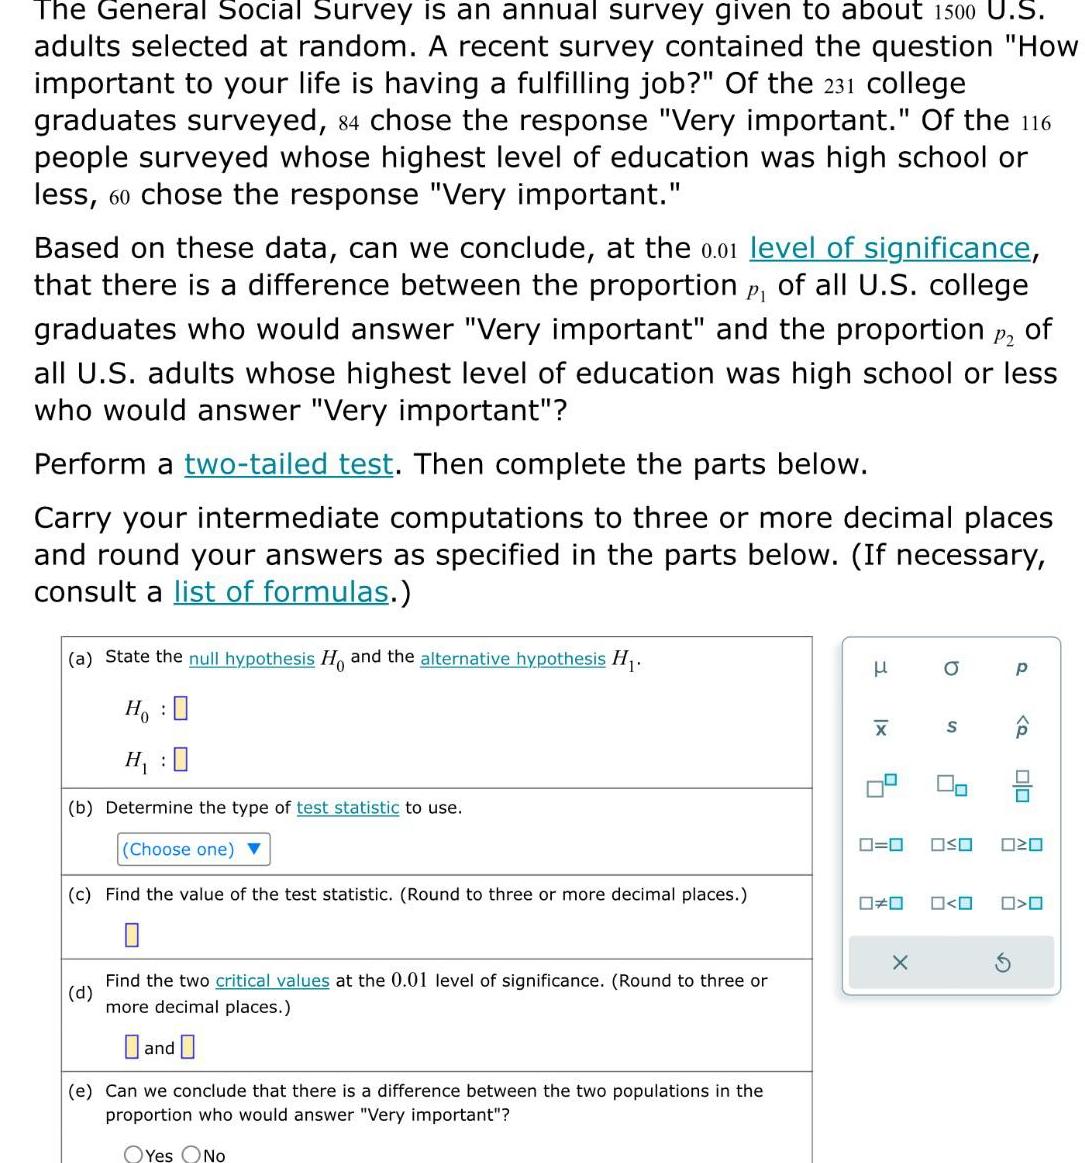
StatisticsThe General Social Survey is an annual survey given to about 1500 U S adults selected at random A recent survey contained the question How important to your life is having a fulfilling job Of the 231 college graduates surveyed 84 chose the response Very important Of the 116 people surveyed whose highest level of education was high school or less 60 chose the response Very important Based on these data can we conclude at the 0 01 level of significance that there is a difference between the proportion p of all U S college graduates who would answer Very important and the proportion P2 of all U S adults whose highest level of education was high school or less who would answer Very important Perform a two tailed test Then complete the parts below Carry your intermediate computations to three or more decimal places and round your answers as specified in the parts below If necessary consult a list of formulas a State the null hypothesis Ho and the alternative hypothesis H Ho O H b Determine the type of test statistic to use Choose one c Find the value of the test statistic Round to three or more decimal places d Find the two critical values at the 0 01 level of significance Round to three or more decimal places and e Can we conclude that there is a difference between the two populations in the proportion who would answer Very important OYes No H x X 0 0 OSO 0 S X 0 0 S P Q 00 20 O
Statistics
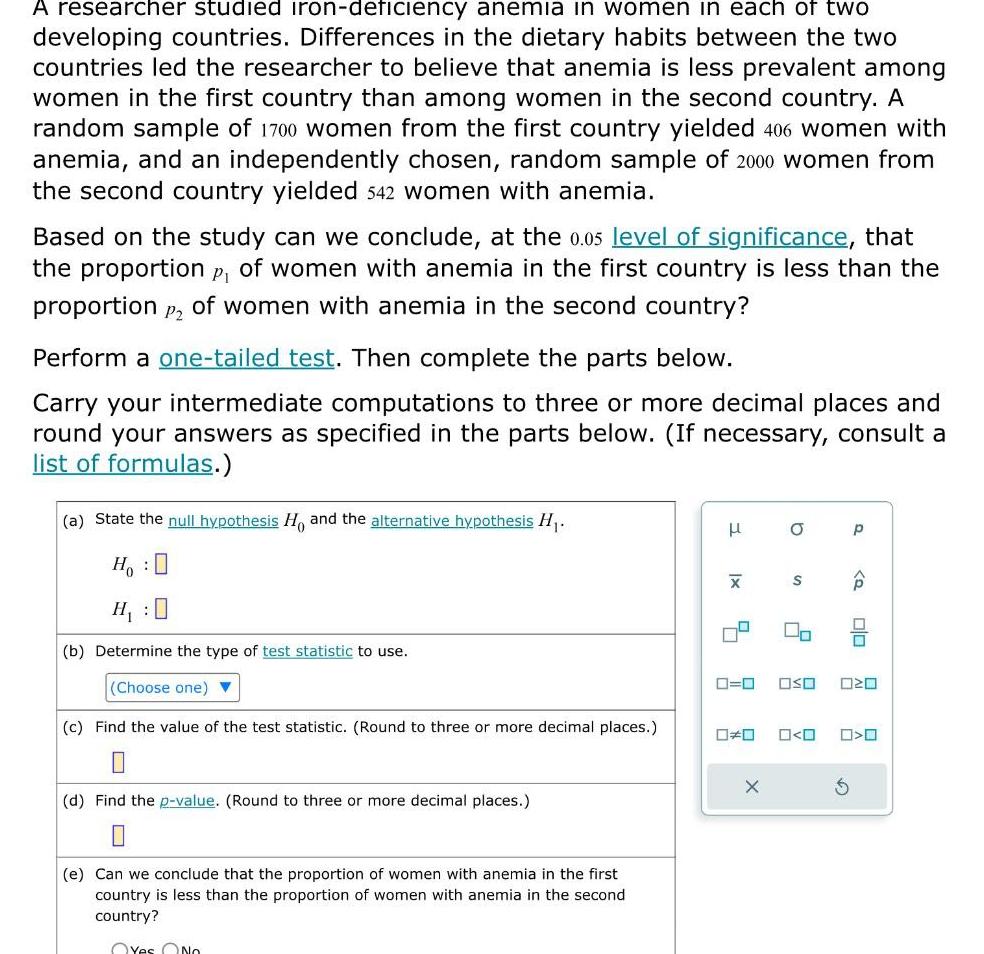
StatisticsA researcher studied iron deficiency anemia in women in each of two developing countries Differences in the dietary habits between the two countries led the researcher to believe that anemia is less prevalent among women in the first country than among women in the second country A random sample of 1700 women from the first country yielded 406 women with anemia and an independently chosen random sample of 2000 women from the second country yielded 542 women with anemia Based on the study can we conclude at the 0 05 level of significance that the proportion P of women with anemia in the first country is less than the proportion P2 of women with anemia in the second country Perform a one tailed test Then complete the parts below Carry your intermediate computations to three or more decimal places and round your answers as specified in the parts below If necessary consult a list of formulas a State the null hypothesis Ho and the alternative hypothesis H Ho H 0 b Determine the type of test statistic to use Choose one c Find the value of the test statistic Round to three or more decimal places d Find the p value Round to three or more decimal places e Can we conclu the proportion of women with anemia in the first country is less than the proportion of women with anemia in the second country Yes No X X O S 00 0 0 p G P OSO olo O
Statistics
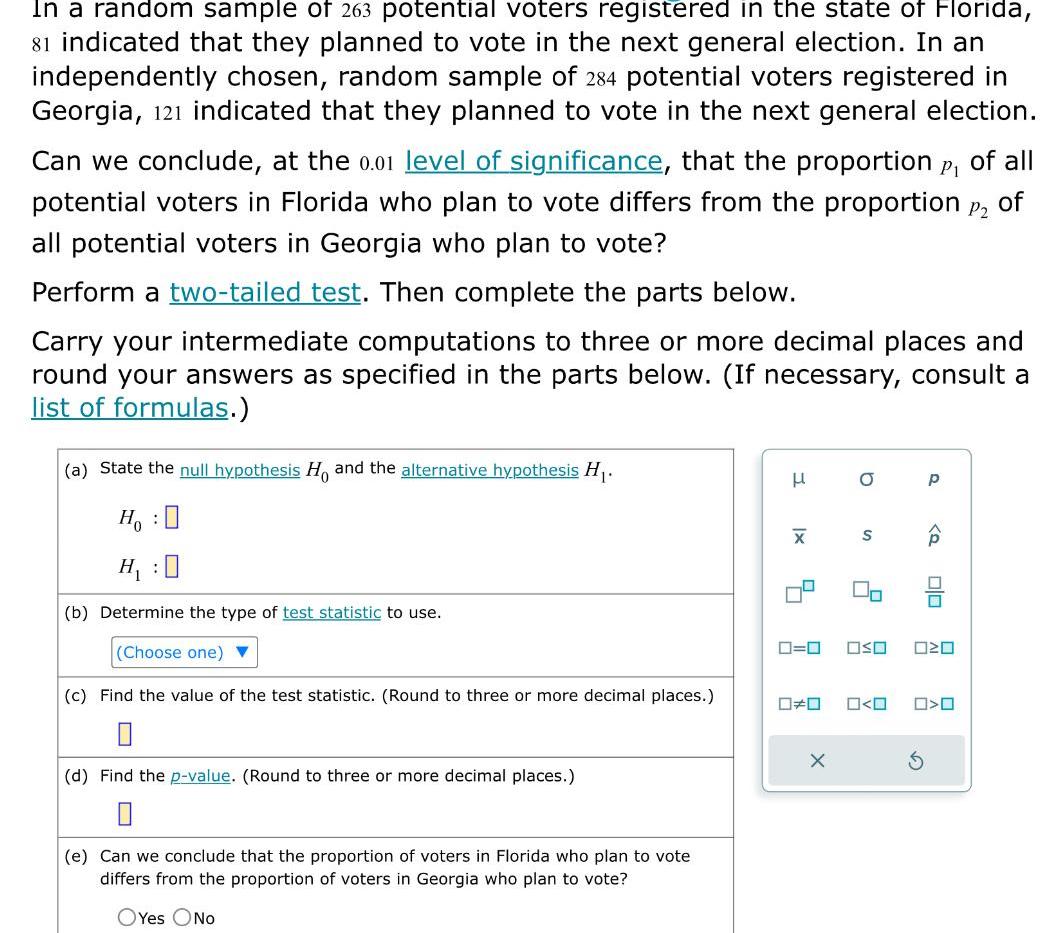
StatisticsIn a random sample of 263 potential voters registered in the state of Florida 81 indicated that they planned to vote in the next general election In an independently chosen random sample of 284 potential voters registered in Georgia 121 indicated that they planned to vote in the next general election Can we conclude at the 0 01 level of significance that the proportion of all potential voters in Florida who plan to vote differs from the proportion of all potential voters in Georgia who plan to vote P1 P2 Perform a two tailed test Then complete the parts below Carry your intermediate computations to three or more decimal places and round your answers as specified in the parts below If necessary consult a list of formulas a State the null hypothesis H and the alternative hypothesis H Ho H 0 b Determine the type of test statistic to use Choose one c Find the value of the test statistic Round to three or more decimal places 0 d Find the p value Round to three or more decimal places 0 e Can we conclude that the proportion of voters in Florida who plan to vote differs from the proportion of voters in Georgia who plan to vote OYes No H XI 4 0 O X S 2 Jo 0 0 OSO 020 0 0 p Q S 00 O O
Statistics
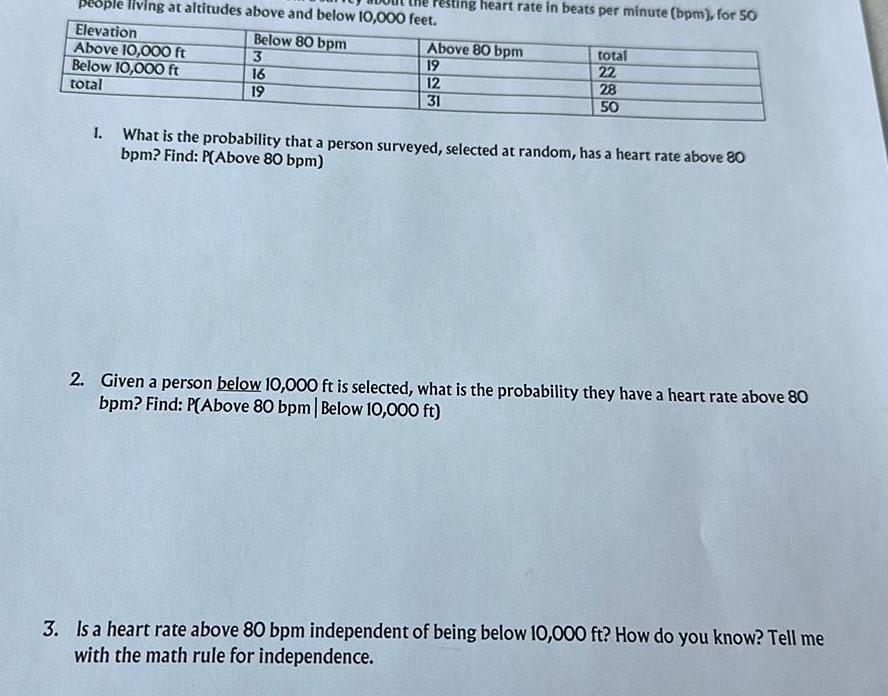
Probabilitypeop living at altitudes above and below 10 000 feet Elevation Below 80 bpm Above 10 000 ft 3 Below 10 000 ft 16 total 19 esting heart rate in beats per minute bpm for 50 Above 80 bpm 19 12 31 total 22 28 50 1 What is the probability that a person surveyed selected at random has a heart rate above 80 bpm Find P Above 80 bpm 2 Given a person below 10 000 ft is selected what is the probability they have a heart rate above 80 bpm Find P Above 80 bpm Below 10 000 ft 3 Is a heart rate above 80 bpm independent of being below 10 000 ft How do you know Tell me with the math rule for independence
Statistics
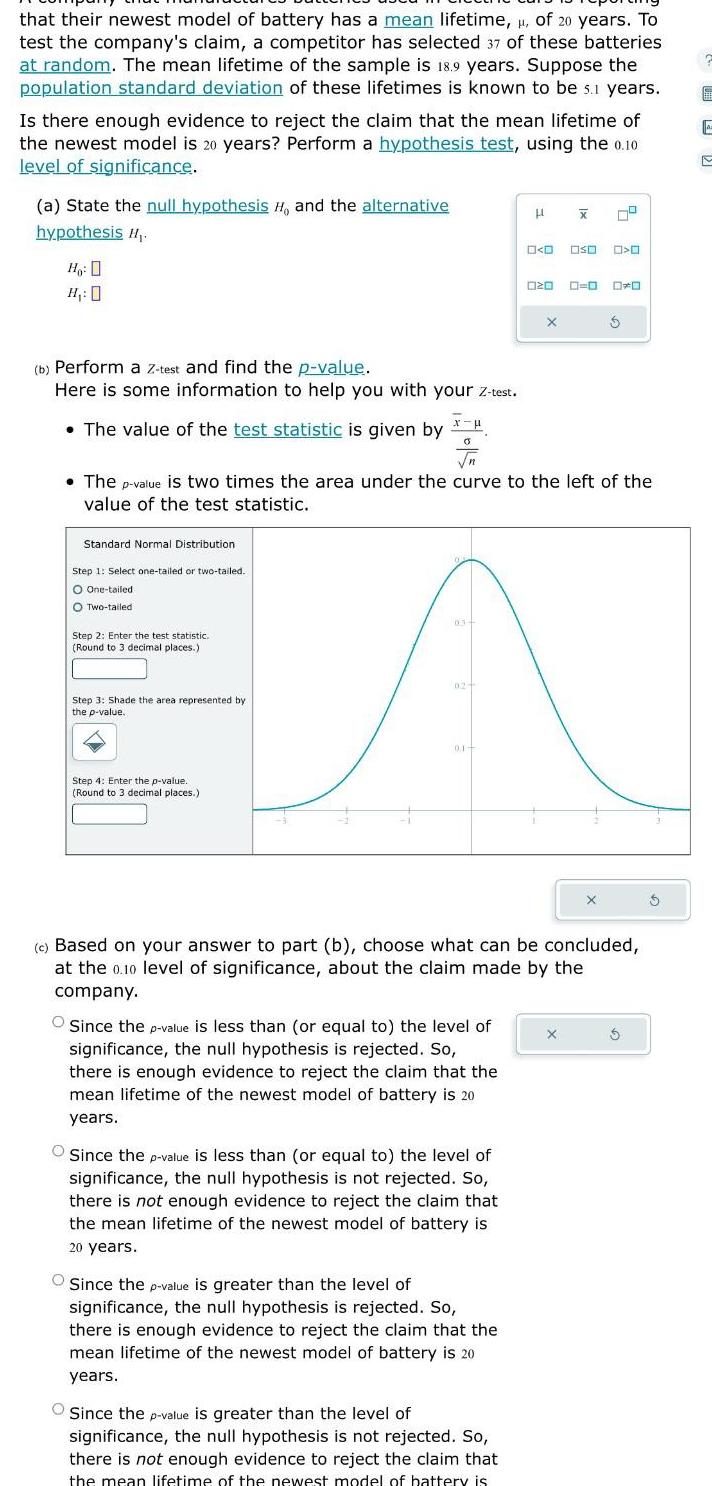
Statisticsthat their newest model of battery has a mean lifetime of 20 years To test the company s claim a competitor has selected 37 of these batteries at random The mean lifetime of the sample is 18 9 years Suppose the population standard deviation of these lifetimes is known to be s 1 years Is there enough evidence to reject the claim that the mean lifetime of the newest model is 20 years Perform a hypothesis test using the 0 10 level of significance a State the null hypothesis H and the alternative hypothesis H Ho H 0 b Perform a Z test and find the p value Here is some information to help you with your Z test The value of the test statistic is given by 0 Standard Normal Distribution Step 1 Select one tailed or two tailed O One tailed O Two tailed Step 2 Enter the test statistic Round to 3 decimal places Step 3 Shade the area represented by the p value Step 4 Enter the p value Round to 3 decimal places The p value is two times the area under the curve to the left of the value of the test statistic Since the p value is less than or equal to the level of significance the null hypothesis is rejected So there is enough evidence to reject the claim that the mean lifetime of the newest model of battery is 20 years H x Since the p value is less than or equal to the level of significance the null hypothesis is not rejected So there is not enough evidence to reject the claim that the mean lifetime of the newest model of battery is 20 years 0 0 Since the p value is greater than the level of significance the null hypothesis is rejected So there is enough evidence to reject the claim that the mean lifetime of the newest model of battery is 20 years 020 Since the p value is greater than the level of significance the null hypothesis is not rejected So there is not enough evidence to reject the claim that the mean lifetime of the newest model of battery is X 0 03 02 A 0 1 OSO c Based on your answer to part b choose what can be concluded at the 0 10 level of significance about the claim made by the company O O O DO X 5 5 E
Statistics
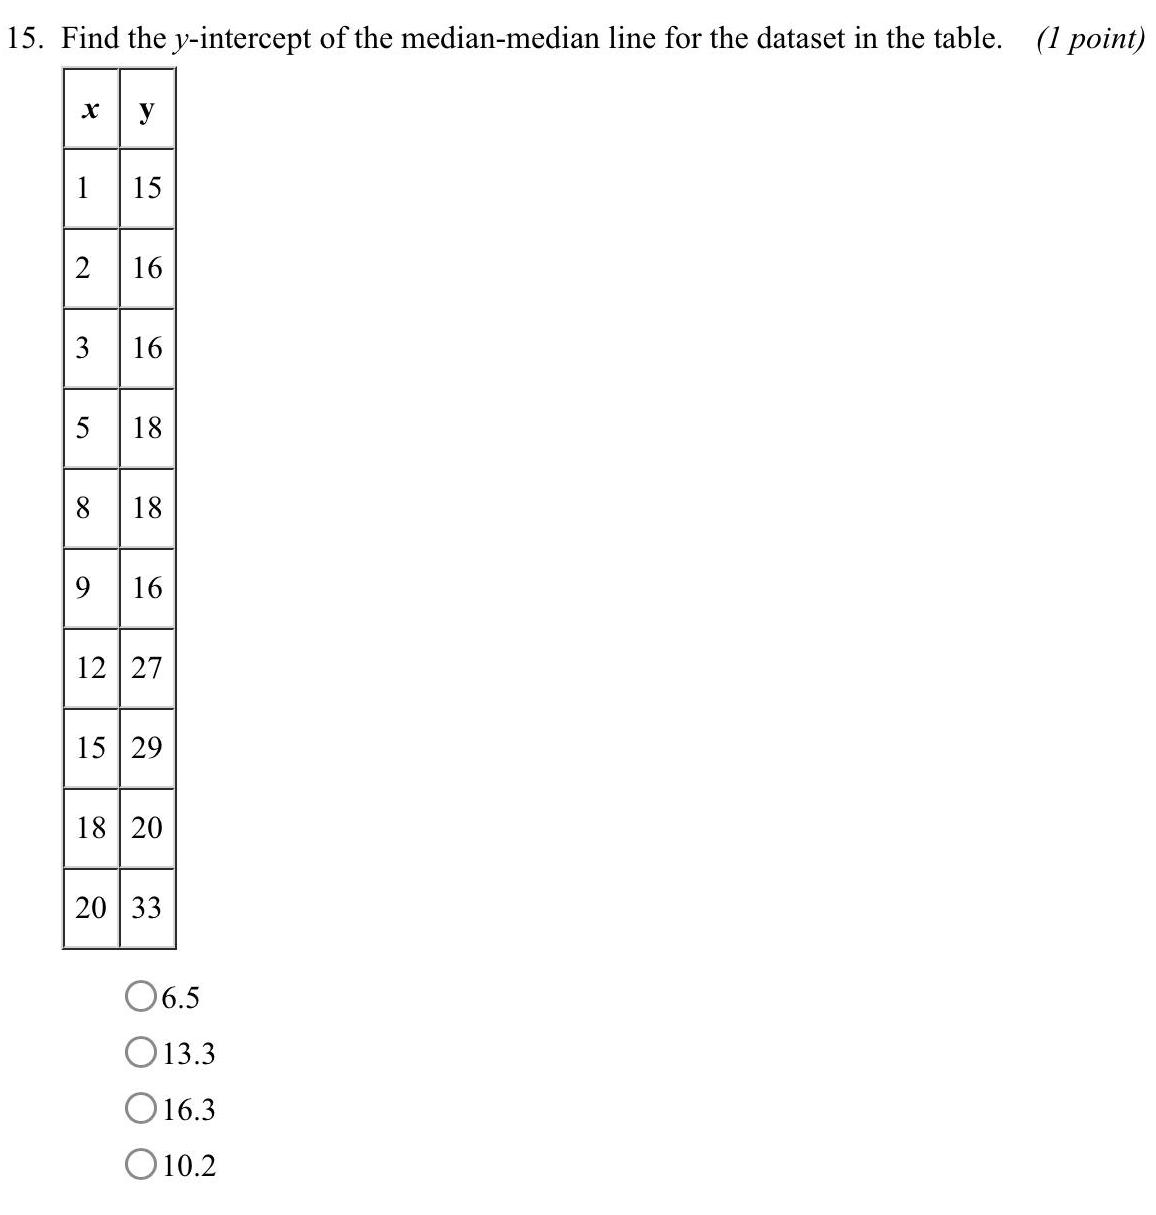
Statistics15 Find the y intercept of the median median line for the dataset in the table 1 point x y 1 2 3 5 8 15 16 16 18 18 9 16 12 27 15 29 18 20 20 33 06 5 13 3 16 3 10 2
Statistics
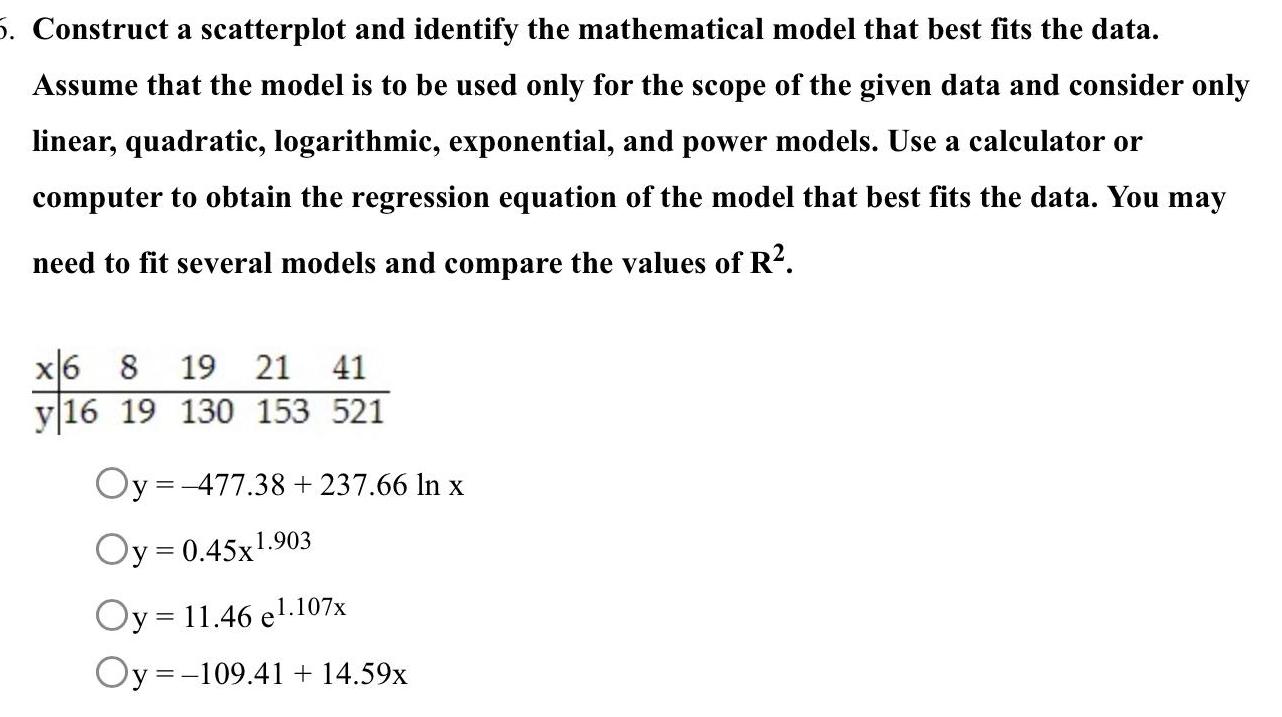
Statistics5 Construct a scatterplot and identify the mathematical model that best fits the data Assume that the model is to be used only for the scope of the given data and consider only linear quadratic logarithmic exponential and power models Use a calculator or computer to obtain the regression equation of the model that best fits the data You may need to fit several models and compare the values of R x6 8 19 21 41 y16 19 130 153 521 Oy 477 38 237 66 In x Oy 0 45x1 903 Oy 11 46 el 107x Oy 109 41 14 59x
Statistics
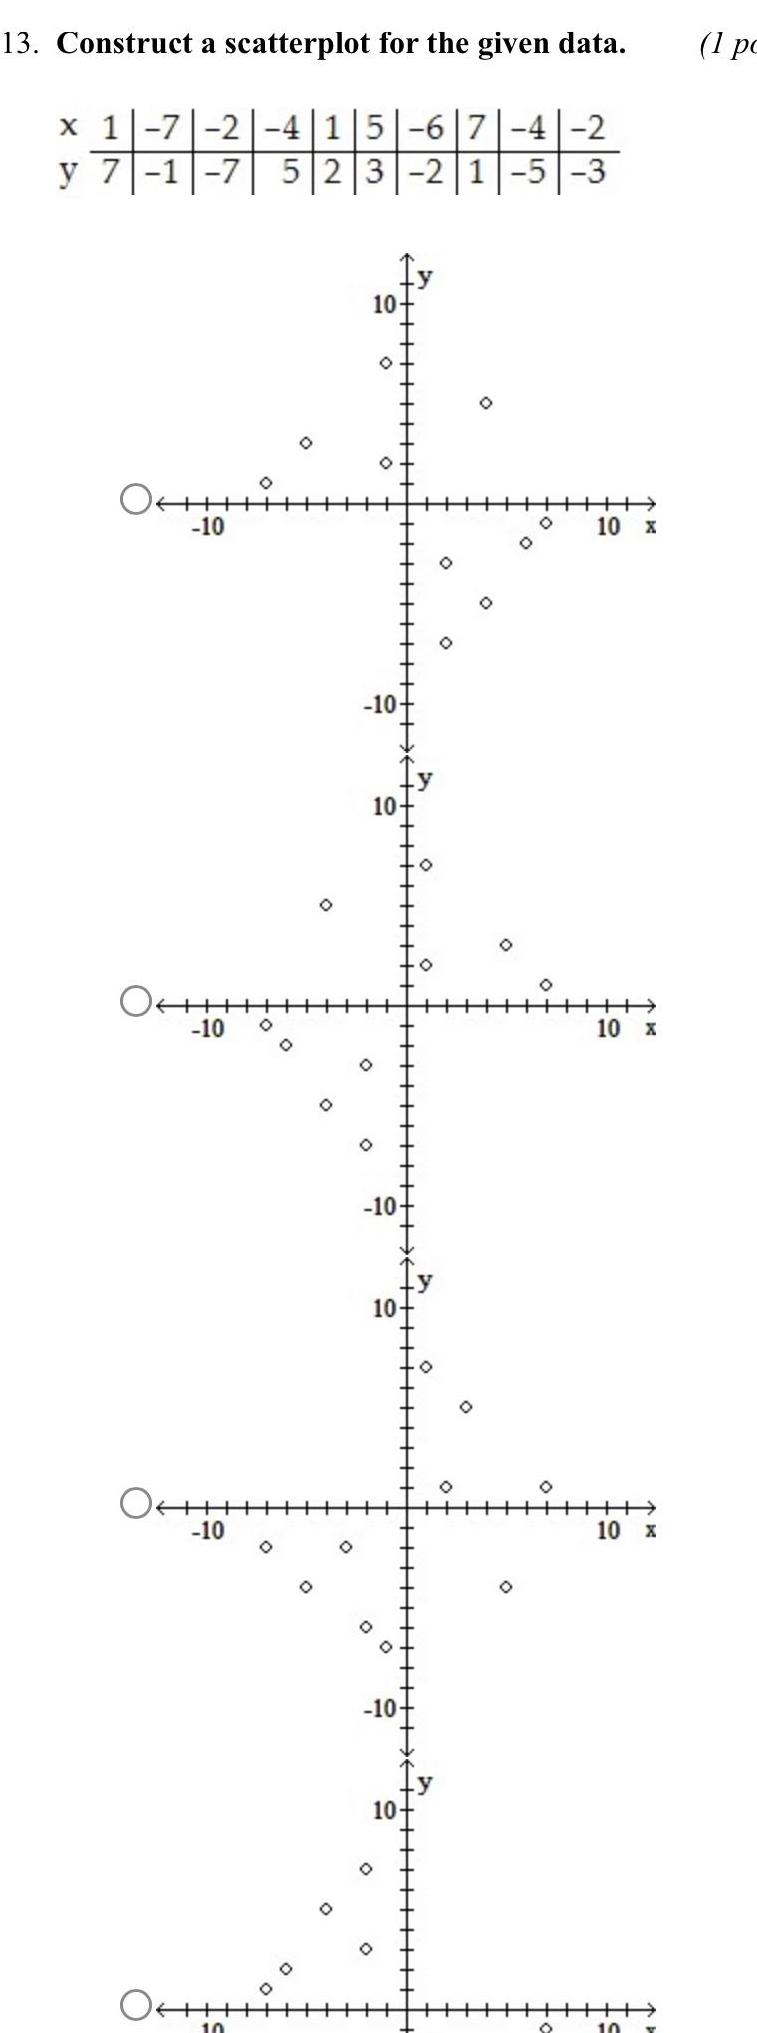
Statistics13 Construct a scatterplot for the given data x 1 7 2 4 1 5 6 7 4 2 y 7 1 7 5 2 3 2 1 5 3 OHH 10 OH 10 O 10 O 10 0 O 10 O 10 10 O 10 10 10 O O O O O O 10 x O O 10 x 10 x 10 1 pc
Statistics
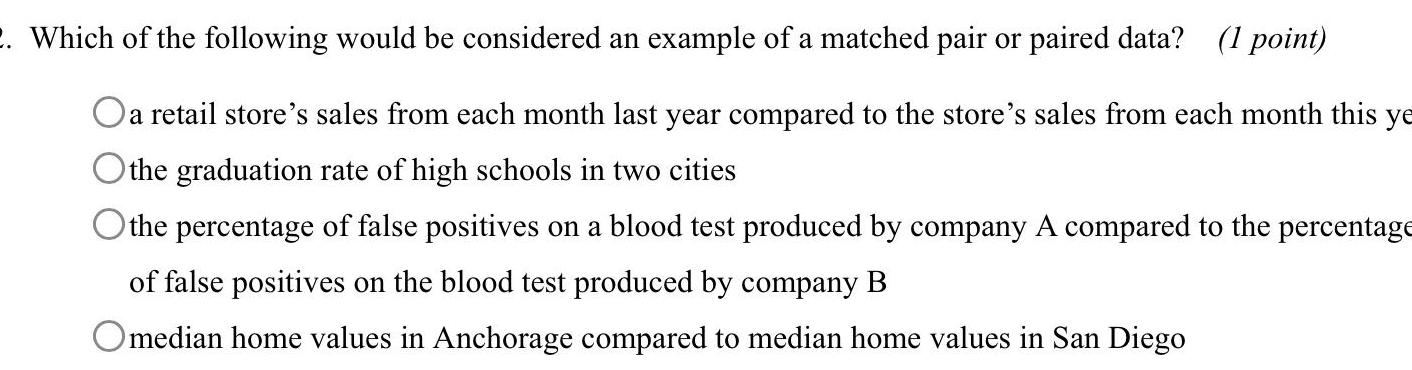
Statistics2 Which of the following would be considered an example of a matched pair or paired data 1 point Oa retail store s sales from each month last year compared to the store s sales from each month this ye the graduation rate of high schools in two cities O the percentage of false positives on a blood test produced by company A compared to the percentage of false positives on the blood test produced by company B Omedian home values in Anchorage compared to median home values in San Diego
Statistics
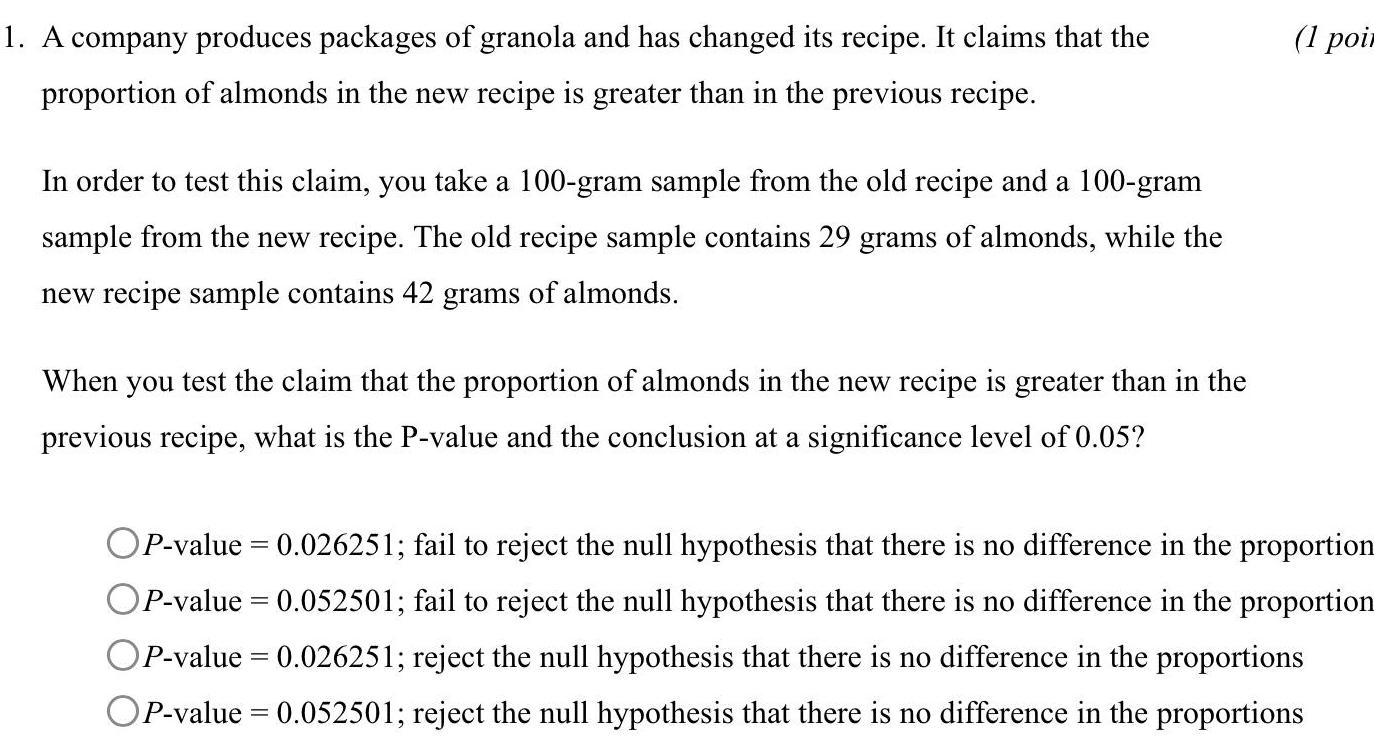
Statistics1 A company produces packages of granola and has changed its recipe It claims that the proportion of almonds in the new recipe is greater than in the previous recipe In order to test this claim you take a 100 gram sample from the old recipe and a 100 gram sample from the new recipe The old recipe sample contains 29 grams of almonds while the new recipe sample contains 42 grams of almonds When you test the claim that the proportion of almonds in the new recipe is greater than in the previous recipe what is the P value and the conclusion at a significance level of 0 05 1 poir OP value 0 026251 fail to reject the null hypothesis that there is no difference in the proportion OP value 0 052501 fail to reject the null hypothesis that there is no difference in the proportion OP value 0 026251 reject the null hypothesis that there is no difference in the proportions OP value 0 052501 reject the null hypothesis that there is no difference in the proportions
Statistics
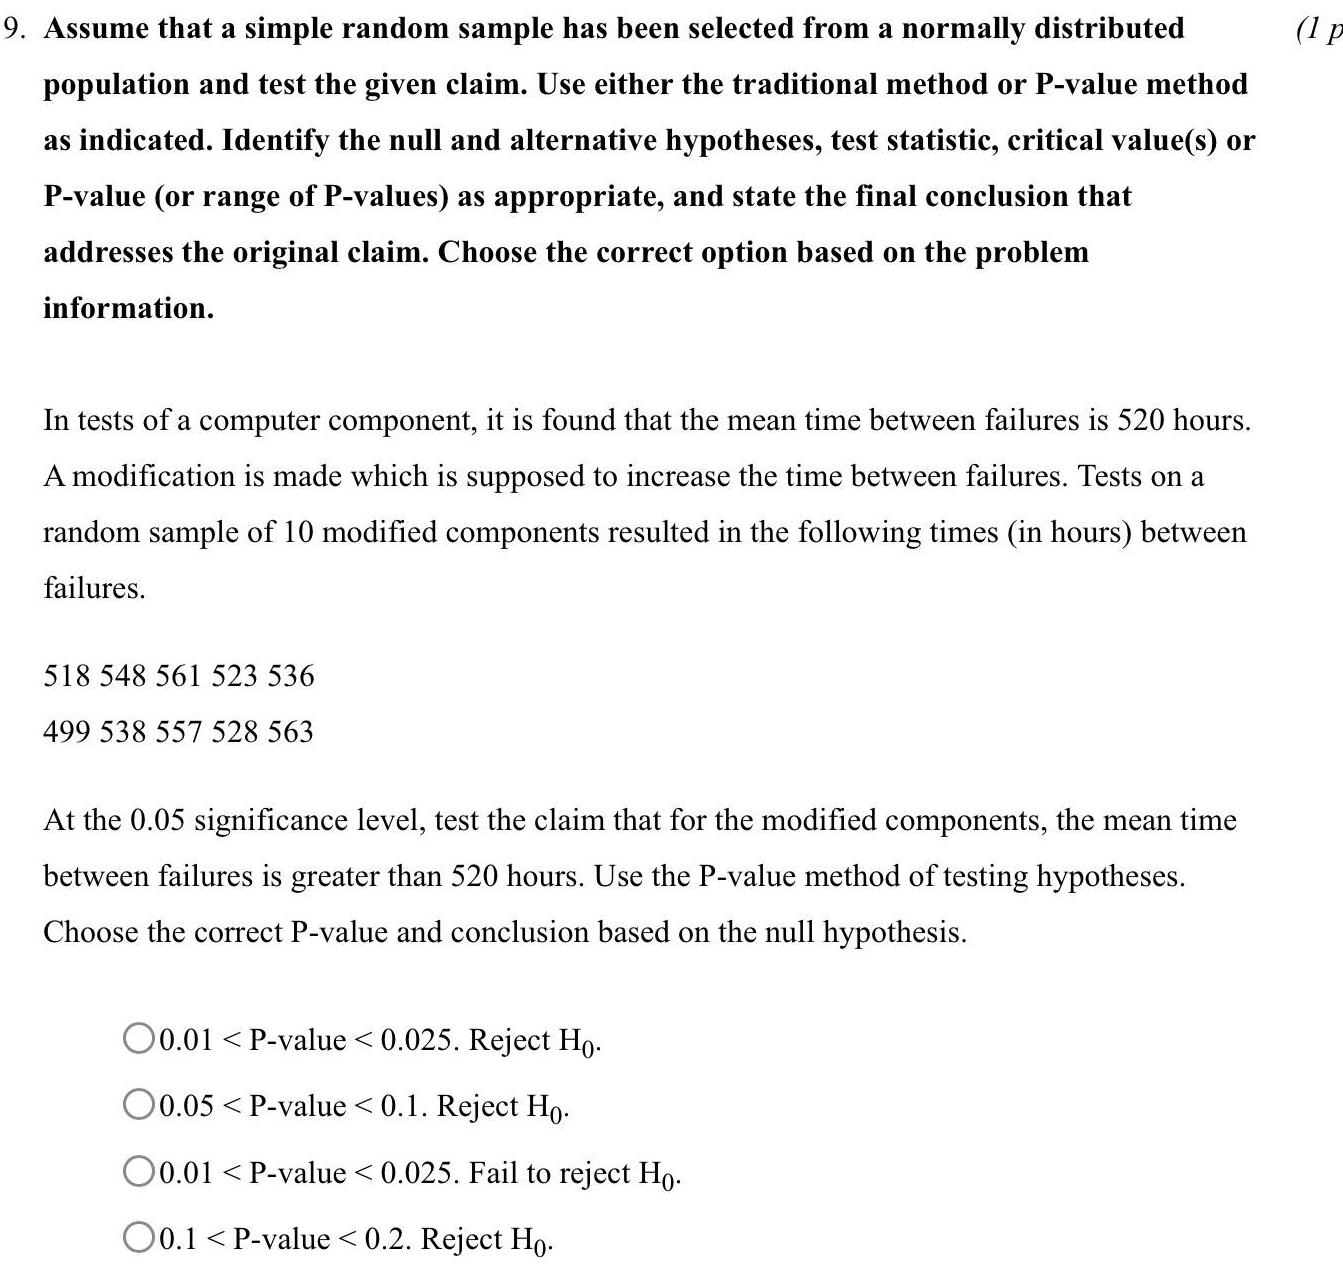
Statistics9 Assume that a simple random sample has been selected from a normally distributed population and test the given claim Use either the traditional method or P value method as indicated Identify the null and alternative hypotheses test statistic critical value s or P value or range of P values as appropriate and state the final conclusion that addresses the original claim Choose the correct option based on the problem information In tests of a computer component it is found that the mean time between failures is 520 hours A modification is made which is supposed to increase the time between failures Tests on a random sample of 10 modified components resulted in the following times in hours between failures 518 548 561 523 536 499 538 557 528 563 At the 0 05 significance level test the claim that for the modified components the mean time between failures is greater than 520 hours Use the P value method of testing hypotheses Choose the correct P value and conclusion based on the null hypothesis O0 01 P value 0 025 Reject Ho O0 05 P value 0 1 Reject Ho O0 01 P value 0 025 Fail to reject Ho 0 1 P value 0 2 Reject Ho 1 p
Statistics
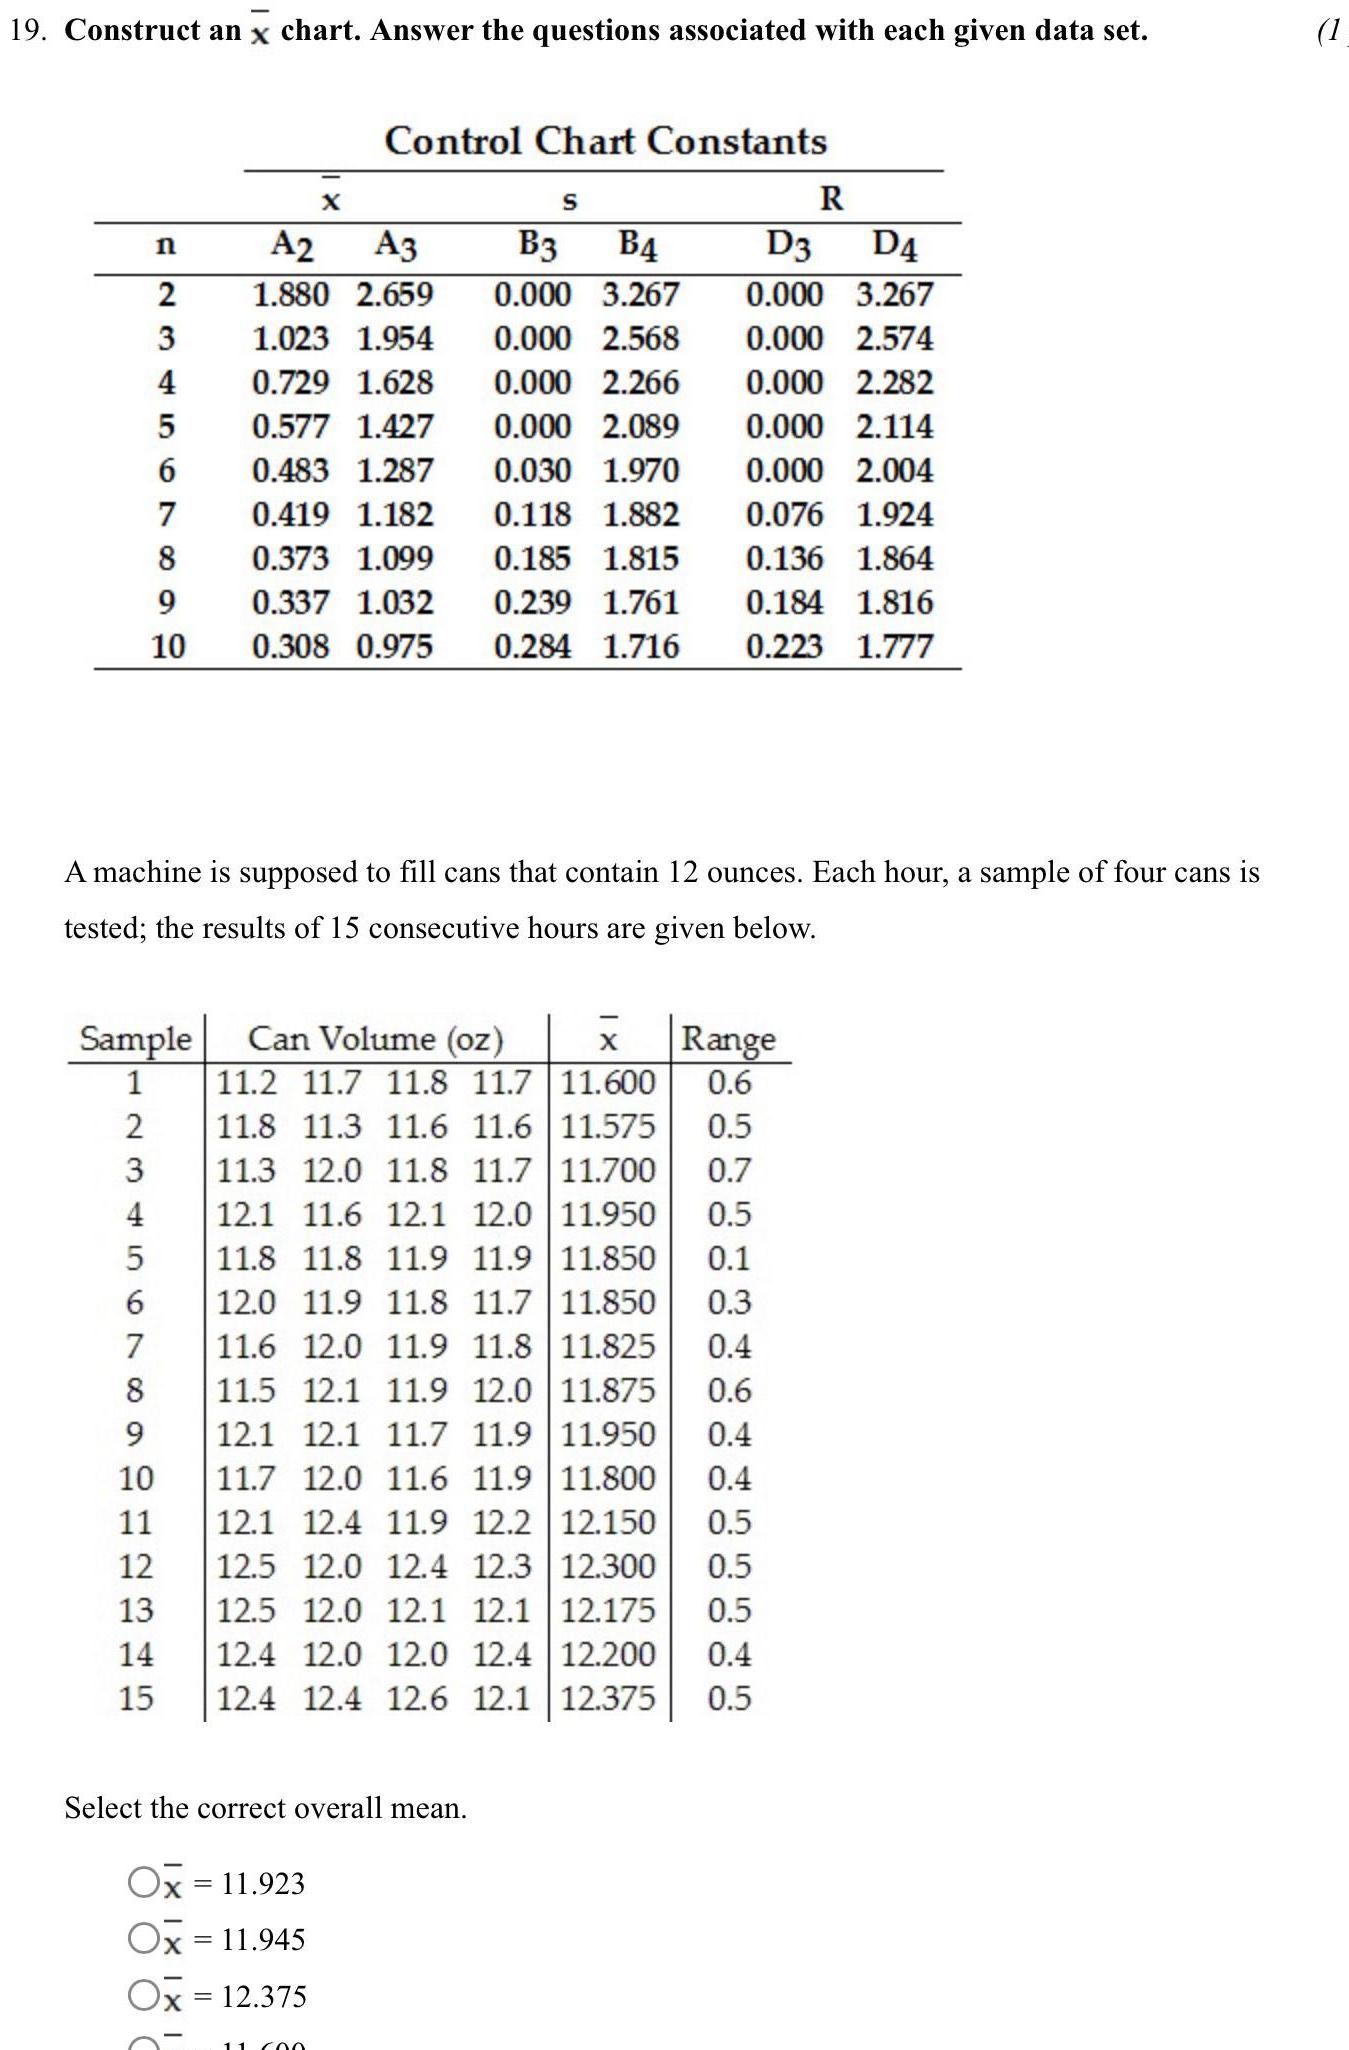
Statistics19 Construct an x chart Answer the questions associated with each given data set n 2 3 4 5 6 7 8 9 10 Sample 1 2 3 4 5 6 7 8 9 10 11 12 13 14 15 X A2 A3 1 880 2 659 1 023 1 954 0 729 1 628 0 577 1 427 0 483 1 287 0 419 1 182 0 373 1 099 0 337 1 032 0 308 0 975 Control Chart Constants Ox 11 923 Ox 11 945 Ox 12 375 A machine is posed to fill cans that contain 12 ounces Each hour a tested the results of 15 consecutive hours are given below Select the correct overall mean 11 00 R D3 D4 0 000 3 267 0 000 2 574 0 000 2 282 0 000 2 114 0 000 2 004 0 076 1 924 0 136 1 864 0 239 1 761 0 184 1 816 0 284 1 716 0 223 1 777 S Can Volume oz x Range 11 600 0 6 11 2 11 7 11 8 11 7 11 8 11 3 11 6 11 6 11 575 0 5 11 3 12 0 11 8 11 7 11 700 0 7 12 1 11 6 12 1 12 0 11 950 0 5 11 8 11 8 11 9 11 9 11 850 0 1 12 0 11 9 11 8 11 7 11 850 0 3 11 6 12 0 11 9 11 8 11 825 0 4 11 5 12 1 11 9 12 0 11 875 0 6 12 1 12 1 11 7 11 9 11 950 0 4 11 7 12 0 11 6 11 9 11 800 0 4 12 1 12 4 11 9 12 2 12 150 0 5 12 5 12 0 12 4 12 3 12 300 0 5 12 5 12 0 12 1 12 1 12 175 0 5 12 4 12 0 12 0 12 4 12 200 0 4 12 4 12 4 12 6 12 1 12 375 0 5 B3 B4 0 000 3 267 0 000 2 568 0 000 2 266 0 000 2 089 0 030 1 970 0 118 1 882 0 185 1 815 mple of four cans is 1
Statistics
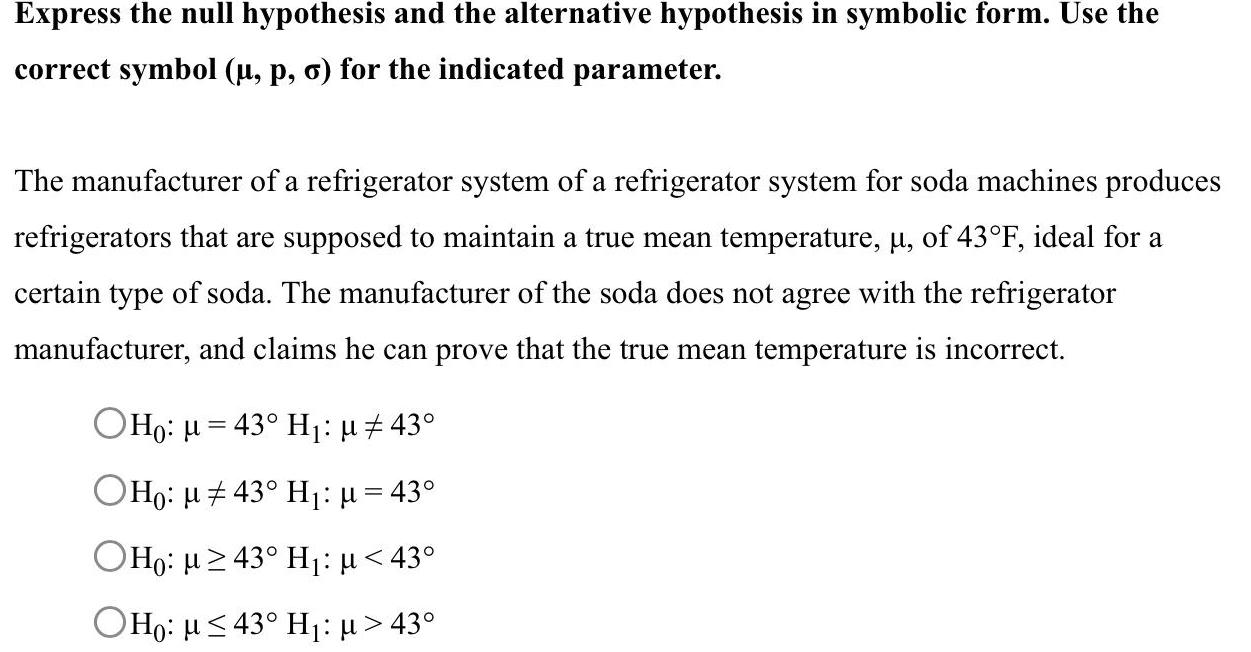
StatisticsExpress the null hypothesis and the alternative hypothesis in symbolic form Use the correct symbol p o for the indicated parameter The manufacturer of a refrigerator system of a refrigerator system for soda machines produces refrigerators that are supposed to maintain a true mean temperature of 43 F ideal for a certain type of soda The manufacturer of the soda does not agree with the refrigerator manufacturer and claims he can prove that the true mean temperature is incorrect OH 43 H 43 OHo 43 H 43 OHO 43 H 43 OHo 43 H 43
Statistics
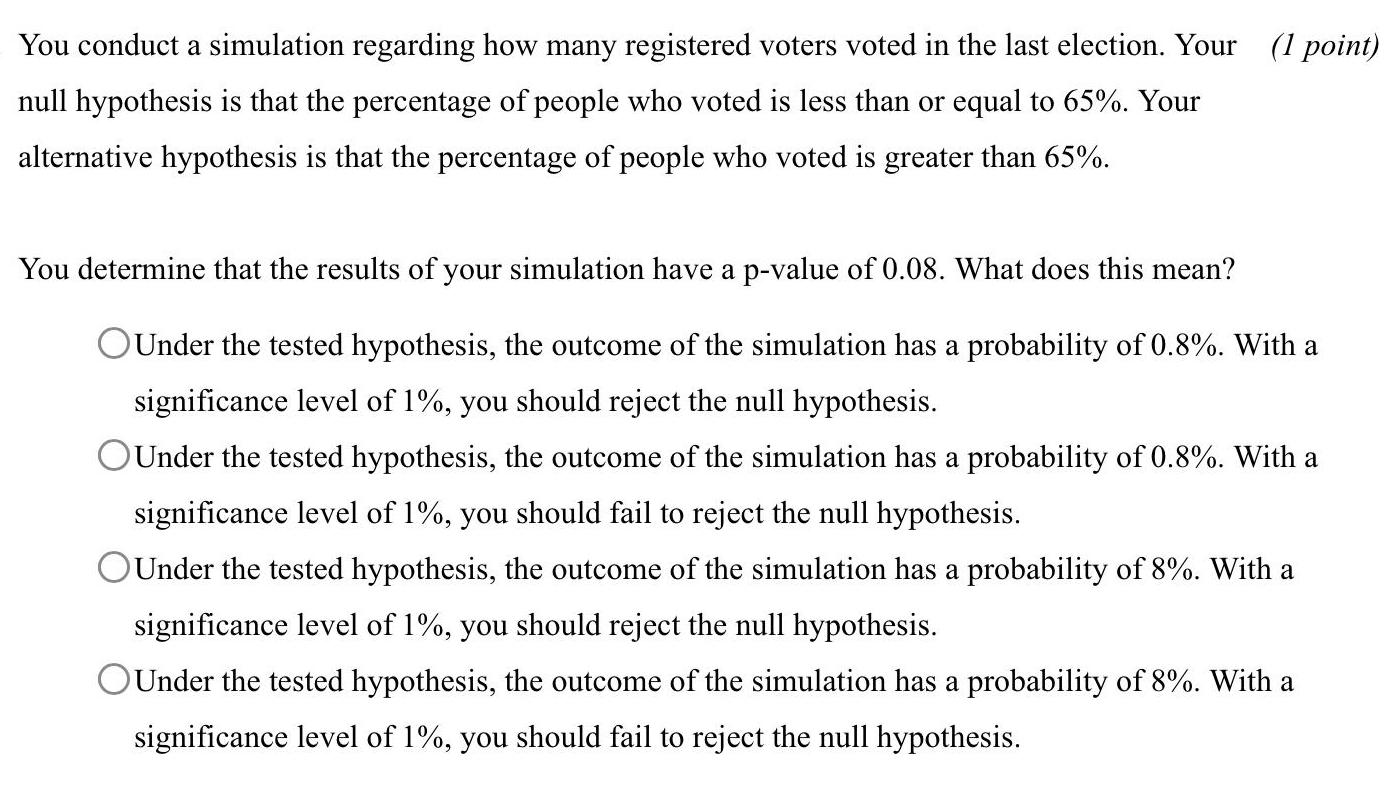
StatisticsYou conduct a simulation regarding how many registered voters voted in the last election Your 1 point null hypothesis is that the percentage of people who voted is less than or equal to 65 Your alternative hypothesis is that the percentage of people who voted is greater than 65 You determine that the results of your simulation have a p value of 0 08 What does this mean OUnder the tested hypothesis the outcome of the simulation has a probability of 0 8 With a significance level of 1 you should reject the null hypothesis Under the tested hypothesis the outcome of the simulation has a probability of 0 8 With a significance level of 1 you should fail to reject the null hypothesis OUnder the tested hypothesis the outcome of the simulation has a probability of 8 With a significance level of 1 you should reject the null hypothesis OUnder the tested hypothesis the outcome of the simulation has a probability of 8 With a significance level of 1 you should fail to reject the null hypothesis
Statistics
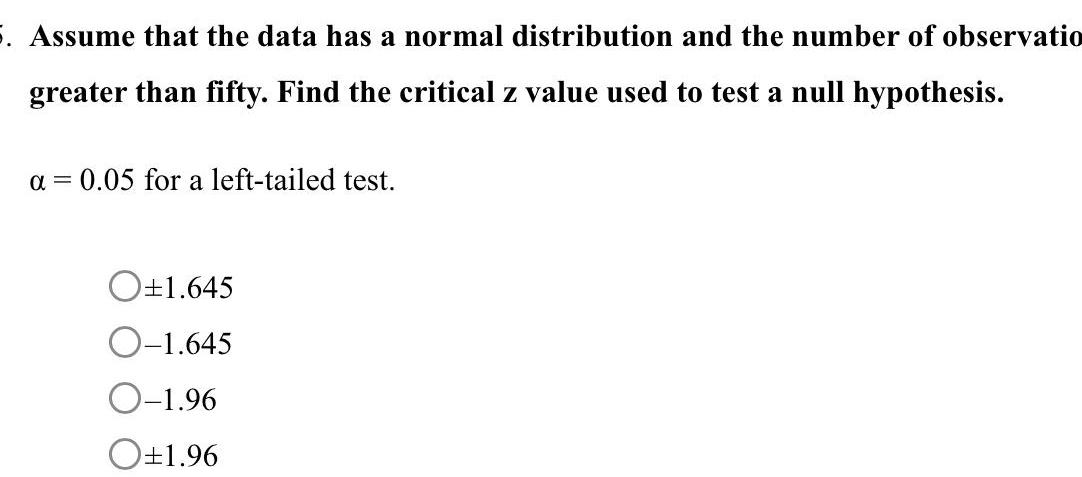
Statistics5 Assume that the data has a normal distribution and the number of observatio greater than fifty Find the critical z value used to test a null hypothesis a 0 05 for a left tailed test O 1 645 O 1 645 O 1 96 O 1 96
Statistics
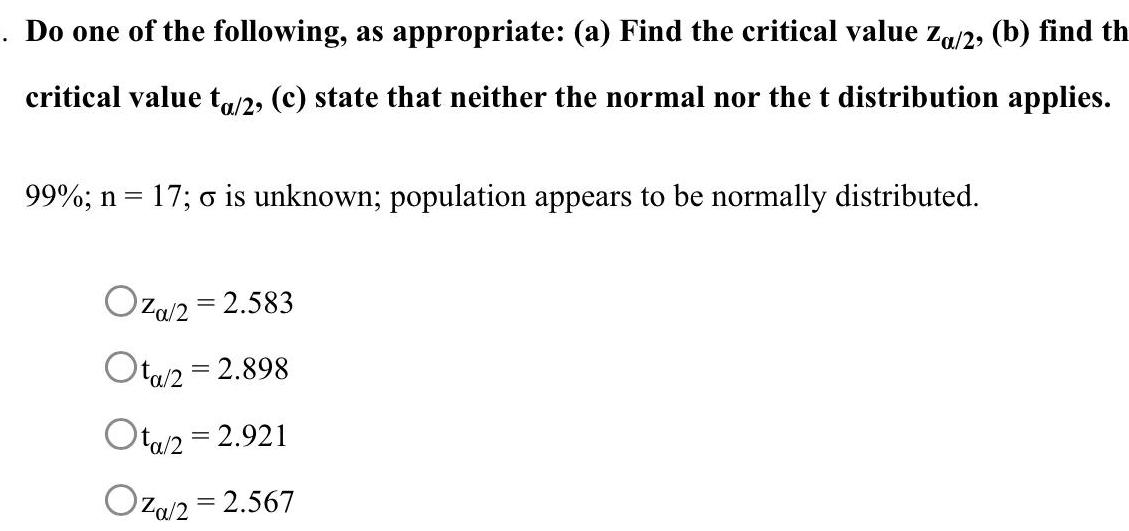
StatisticsDo one of the following as appropriate a Find the critical value Za 2 b find th critical value ta 2 c state that neither the normal nor the t distribution applies 99 n 17 o is unknown population appears to be normally distributed Oza 2 2 583 Ota 2 2 898 Ota 2 2 921 Oza 2 2 567
Statistics
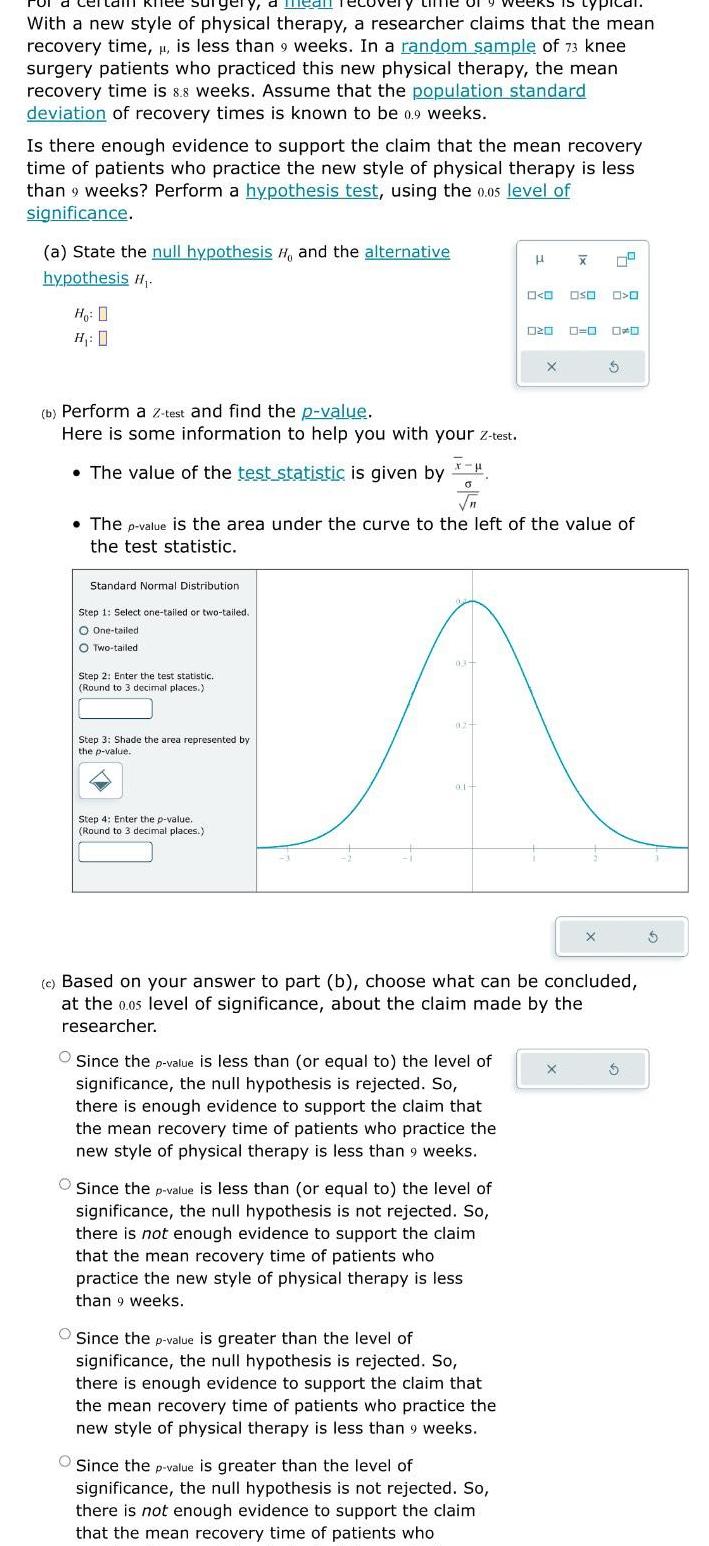
StatisticsTy mean reco weeks is typical With a new style of physical therapy a researcher claims that the mean recovery time is less than 9 weeks In a random sample of 73 knee surgery patients who practiced this new physical therapy the mean recovery time is 8 8 weeks Assume that the population standard deviation of recovery times is known to be 0 9 weeks Is there enough evidence to support the claim that the mean recovery time of patients who practice the new style of physical therapy is less than 9 weeks Perform a hypothesis test using the 0 05 level of significance a State the null hypothesis H and the alternative hypothesis H Ho 0 H 0 b Perform a z test and find the p value Here is some information to help you with your Z test The value of the test statistic is given by Standard Normal Distribution Step 1 Select one tailed or two tailed O One tailed O Two tailed Step 2 Enter the test statistic Round to 3 decimal places Step 3 Shade the area represented by the p value X H 0 Step 4 Enter the p value Round to 3 decimal places The p value is the area under the curve to the left of the value of the test statistic 03 01 Since the p value is less than or equal to the level of significance the null hypothesis is rejected So there is enough evidence to support the claim that the mean recovery time of patients who practice the new style of physical therapy is less than 9 weeks Since the p value is less than or equal to the level of significance the null hypothesis is not rejected So there is not enough evidence to support the claim that the mean recovery time of patients who practice the new style of physical therapy is less than 9 weeks Since the p value is greater than the level of significance the null hypothesis is rejected So there is enough evidence to support the claim that the mean recovery time of patients who practice the new style of physical therapy is less than 9 weeks O O Oso O 020 Since the p value is greater than the level of significance the null hypothesis is not rejected So there is not enough evidence to support the claim that the mean recovery time of patients who X X c Based on your answer to part b choose what can be concluded at the 0 05 level of significance about the claim made by the researcher X D
Statistics
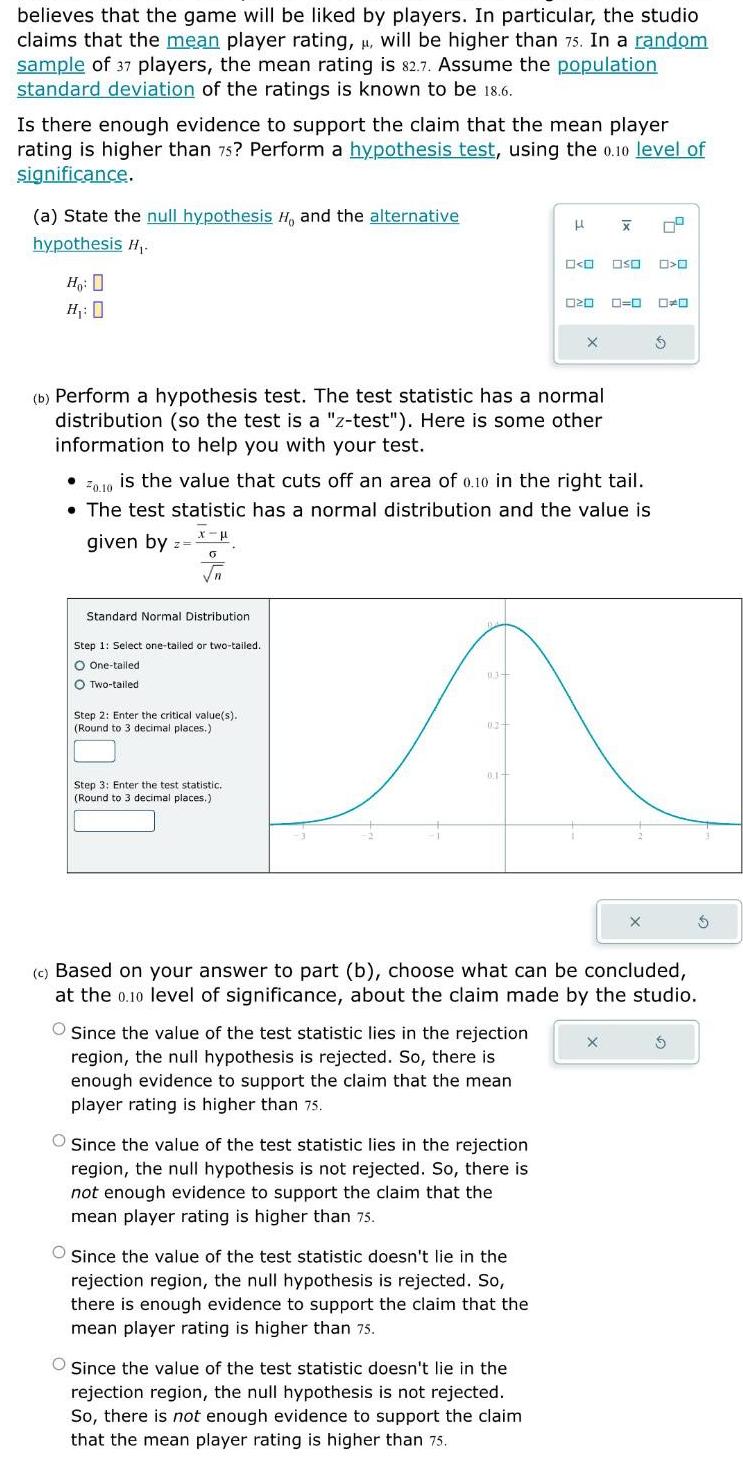
Statisticsbelieves that the game will be liked by players In particular the studio claims that the mean player rating will be higher than 75 In a random sample of 37 players the mean rating is 82 7 Assume the population standard deviation of the ratings is known to be 18 6 Is there enough evidence to support the claim that the mean player rating is higher than 75 Perform a hypothesis test using the 0 10 level of significance a State the null hypothesis H and the alternative hypothesis H Ho H 0 given by Z b Perform a hypothesis test The test statistic has a normal distribution so the test is a z test Here is some other information to help you with your test x 0 n Standard Normal Distribution Step 1 Select one tailed or two tailed O One tailed O Two tailed Step 2 Enter the critical value s Round to 3 decimal places 20 10 is the value that cuts off an area of 0 10 in the right tail The test statistic has a normal distribution and the value is Step 3 Enter the test statistic Round to 3 decimal places 9 3 0 2 0 1 Since the value of the test statistic lies in the rejection region the null hypothesis is rejected So there is enough evidence to support the claim that the mean player rating is higher than 75 H O Since the value of the test statistic lies in the rejection region the null hypothesis is not rejected So there is not enough evidence to support the claim that the mean player rating is higher than 75 Since the value of the test statistic doesn t lie in the rejection region the null hypothesis is rejected So there is enough evidence to support the claim that the mean player rating is higher than 75 0 0 00 0 020 O Since the value of the test statistic doesn t lie in the rejection region the null hypothesis is not rejected So there is not enough evidence to support the claim that the mean player rating is higher than 75 X X c Based on your answer to part b choose what can be concluded at the 0 10 level of significance about the claim made by the studio 0 0 DO X X S 5
Statistics
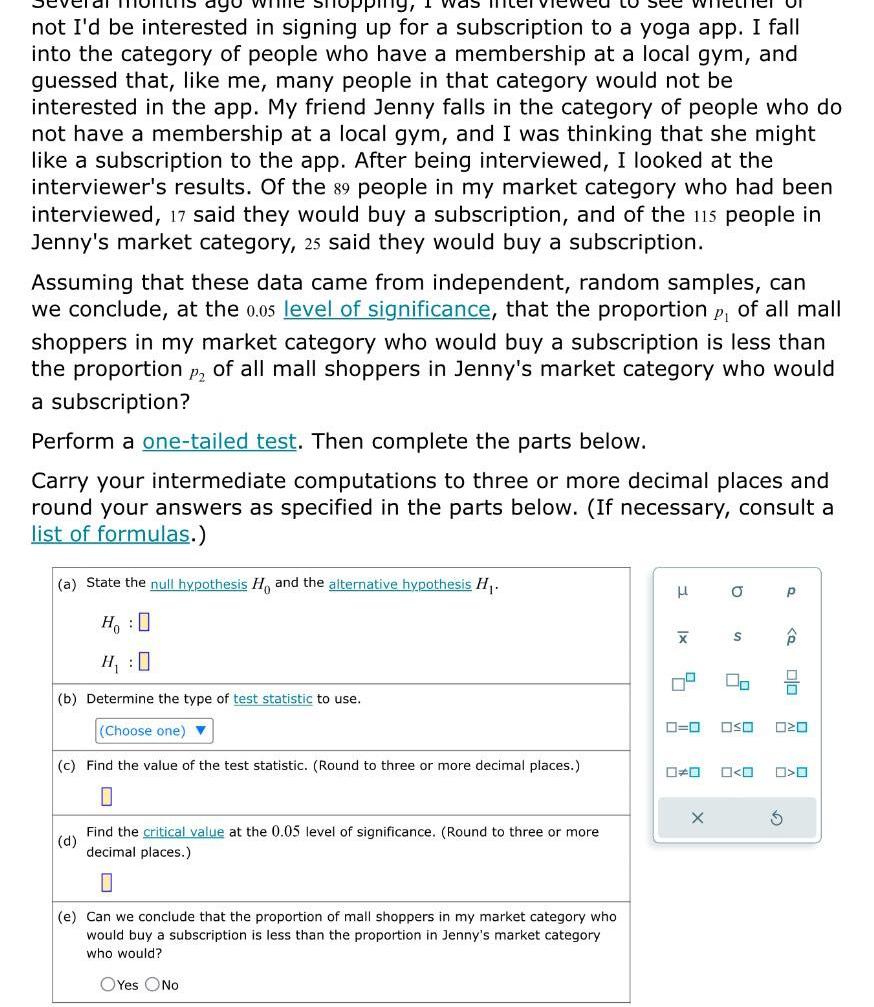
Statisticspping I was not I d be interested in signing up for a subscription to a yoga app I fall into the category of people who have a membership at a local gym and guessed that like me many people in that category would not be interested in the app My friend Jenny falls in the category of people who do not have a membership at a local gym and I was thinking that she might like a subscription to the app After being interviewed I looked at the interviewer s results Of the 89 people in my market category who had been interviewed 17 said they would buy a subscription and of the 115 people in Jenny s market category 25 said they would buy a subscription Assuming that these data came from independent random samples can we conclude at the 0 05 level of significance that the proportion p of all mall shoppers in my market category who would buy a subscription is less than the proportion P2 of all mall shoppers in Jenny s market category who would a subscription Perform a one tailed test Then complete the parts below Carry your intermediate computations to three or more decimal places and round your answers as specified in the parts below If necessary consult a list of formulas a State the null hypothesis Ho and the alternative hypothesis H Ho O H 0 b Determine the type of test statistic to use Choose one c Find the value of the test statistic Round to three or more decimal places d Find the critical value at the 0 05 level of significance Round to three or more decimal places 0 e Can we conclude that the proportion of mall shoppers in my market category who would buy a subscription is less than the proportion in Jenny s market category who would OYes No 3 x X 4 O X S P Q 0 0 OSO 020 S 0 0 0 0 O
Statistics
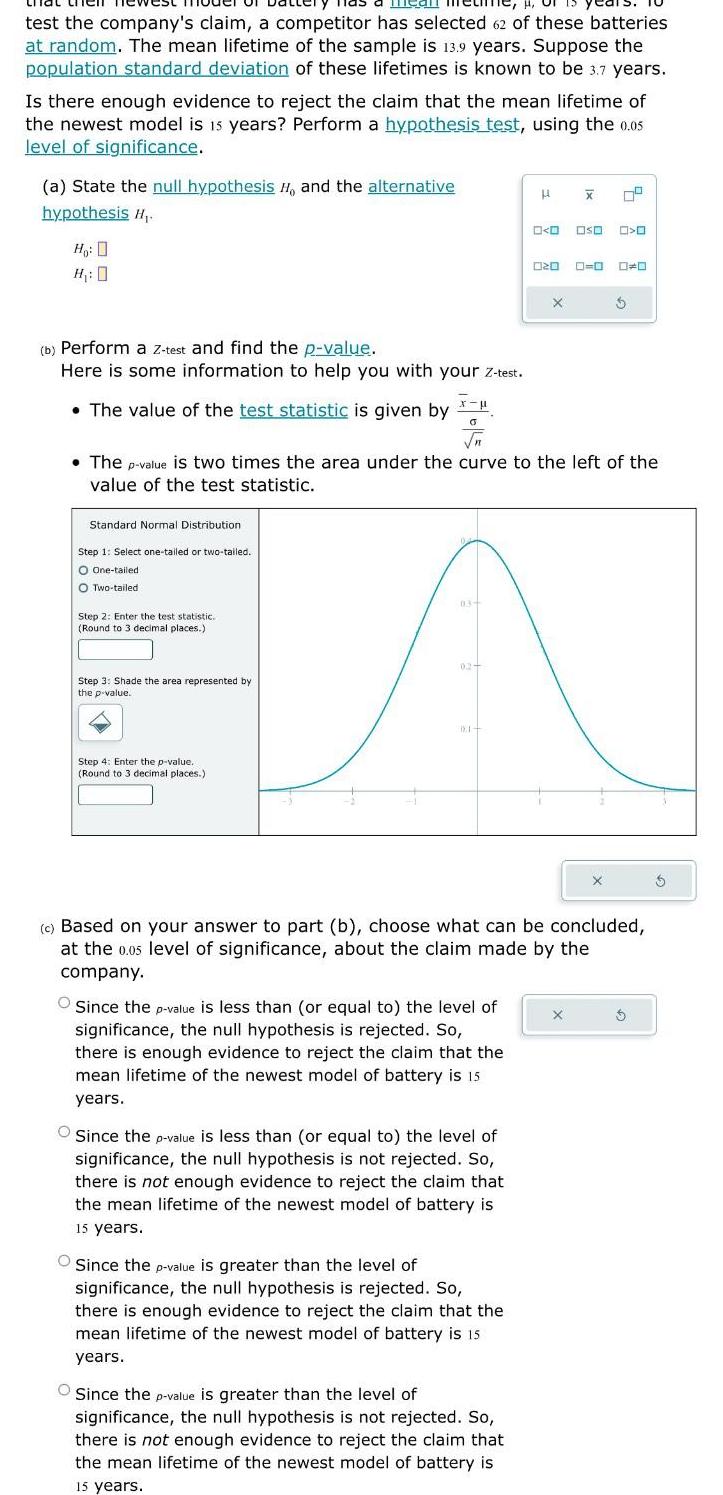
Statisticsmear test the company s claim a competitor has selected 62 of these batteries at random The mean lifetime of the sample is 13 9 years Suppose the population standard deviation of these lifetimes is known to be 3 7 years Is there enough evidence to reject the claim that the mean lifetime of the newest model is 15 years Perform a hypothesis test using the 0 05 level of significance a State the null hypothesis H and the alternative hypothesis H Ho H 0 b Perform a Z test and find the p value Here is some information to help you with your z test The value of the test statistic is given by Standard Normal Distribution Step 1 Select one tailed or two tailed O One tailed O Two tailed Step 2 Enter the test statistic Round to 3 decimal places Step 3 Shade the area represented by the p value x O Step 4 Enter the p value Round to 3 decimal places 03 The p value is two times the area under the curve to the left the value of the test statistic 02 DE Since the p value is less than or equal to the level of significance the null hypothesis is rejected So there is enough evidence to reject the claim that the mean lifetime of the newest model of battery is 15 years Since the p value is less than or equal to the level of significance the null hypothesis is not rejected So there is not enough evidence to reject the claim that the mean lifetime of the newest model of battery is 15 years H Since the p value is greater than the level of significance the null hypothesis is rejected So there is enough evidence to reject the claim that the mean lifetime of the newest model of battery is 15 1 years Since the p value is greater than the level of significance the null hypothesis is not rejected So there is not enough evidence to reject the claim that the mean lifetime of the newest model of battery is 15 years 0 0 000 0 020 X X 79 c Based on your answer to part b choose what can be concluded at the 0 05 level of significance about the claim made by the company 0 0 0 0 X

Statistics
Probability2 What does one assume when using the relative frequencies of past events to predict future events For example when calculating the probability of a student passing the next assignment in a course question 1 what did you assume about the conditions in the past and the future

Statistics
StatisticsOver the years the mean customer satisfaction rating at a local restaurant has been 80 The restaurant was recently remodeled and now the management claims the mean customer rating is not equal to 80 In a sample of 54 customers chosen at random the mean customer rating is 73 6 Assume that the population standard deviation of customer ratings is 21 1 Is there enough evidence to support the claim that the mean customer rating is different from so Perform a hypothesis test using the 0 05 level of significance a State the null hypothesis H and the alternative hypothesis H H O H 0 b Perform a Z test and find the p value Here is some information to help you with your z test The value of the test statistic is given by Standard Normal Distribution Step 1 Select one tailed or two tailed O One tailed O Two tailed Step 2 Enter the test statistic Round to 3 decimal places Step 3 Shade the area represented by the p value x 0 n Step 4 Enter the p value Round to 3 decimal places 102 The p value is two times the area under the curve to the left of the value of the test statistic 03 02 0 1 Since the p value is less than or equal to the level of significance the null hypothesis is rejected So there is enough evidence to support the claim that the mean customer rating is not equal to 80 Since the p value is less than or equal to the level of significance the null hypothesis is not rejected So there is not enough evidence to support the claim that the mean customer rating is not equal to 80 HX Since the p value is greater than the level of significance the null hypothesis is rejected So there is enough evidence to support the claim that the mean customer rating is not equal to 80 Since the p value is greater than the level of significance the null hypothesis is not rejected So there is not enough evidence to support the claim that the mean customer rating is not equal to 80 O O OSO 0 O 020 0 0 00 X c Based on your answer to part b choose what can be concluded at the 0 05 level of significance about the claim made by the management 4 S X X