Statistics Questions
The best high school and college tutors are just a click away, 24×7! Pick a subject, ask a question, and get a detailed, handwritten solution personalized for you in minutes. We cover Math, Physics, Chemistry & Biology.


Statistics
ProbabilityIn a running competition a bronze silver and gold medal must be given to the top three girls and top three boys If 12 boys and 7 girls are competing how many different ways could the six medals possibly be given out

Statistics
Probabilitywhat is the mean of the discrete vendom veriable X O with the following proberbility distribution 13 x 1 3 2 3


Statistics
Probability8000 the following Venn diagram A Pr A is closest to 05 18 07 14 07 1 017 011 20 04 9 07 16 014 17 000000 Pr B is closest to 08 18 05 7 07 16 01 11 06 14 06 9 13 20 10 17 Pr A U B is closest to 08 14 6 9 18 20 B

Statistics
Statisticsmong all your Facebook friends 36 are people you have actually met 37 are people you know but have never actually met and the rest are people you do not know at all 5 of the friends you have met have posted on your Timeline 51 of the friends know but have never met have posted on your Timeline and 8 of the friends you do not now at all have still posted on your Timeline Fill in the missing probabilities as set up in the formula above to obtain the probability that someone who posts on your Timeline someone you have actually met 36 X 76 10 X 36 37 X 76 10 X 57 10 X 27 X 8 100 X Check Clear Help

Statistics
Statisticsa 2 points 1 each Use truth tables to determine which of the following assertions is correct no truth table no credit p v p p v q p q p p v p v q p q b 1 5 points Give the contrapositive and converse the following statement phrasing your answer in words If you pass the class then you have not cheated Save Answer c 1 5 points Indicate which statement or statements are equivalent to the given statement there may be more than one How are the statements you have not chosen in any related to the given statement Given statement It suffices to be able to conquer Gaul in order to be able to conquer Britannia A If one cannot conquer Britannia one cannot conquer Gaul B If one cannot conquer Gaul one cannot conquer Britannia C If one can conquer Britannia one can also conquer Gaul no con alco conquer Britannia

Statistics
StatisticsUse regression to find a quadratic model for the given data Round the terms to four decimal places 6 8 7 y X y 1 3 3 6 5 13 9

Statistics
ProbabilityIn order to spice up your investment portfolio you decided on the morning of March 19 2004 to ignore your broker s cautious advice and purchase three tech stocks and two non tech stocks at random from the following selection prices as of March 19 2004 recommended by your best friend Tech Stocks Change Non Tech Stocks 0 07 PENN Penn Gaming NY Nortel MSFT Microsoft CSCO Cisco NOK Nokia INTC Intel EBAY eBay Open 5 46 24 89 23 17 20 77 27 20 69 34 0 26 0 67 0 75 0 71 1 04 DUK Duke KSE Keyspan ED Con Ed MO Altria Group AACE Ace Cash Express Open 27 09 22 04 37 75 44 51 55 04 27 09 Change 0 71 0 01 0 18 0 39 0 37 0 49 a 1 point How many possible selections are possible b 2 points You tend to have bad luck with stocks they usually go down the moment you buy them How many of the selections in part a consist only of stocks that declined in value by the end of the day What is the probability that all of your stocks declined in value by the end of the day

Statistics
StatisticsA spectrophotometer used for measuring CO concentration ppm parts per million by volume is checked for accuracy by taking readings on a manufactured gas called span gas in which the CO concentration is very precisely controlled at 69 ppm If the readings suggest that the spectrophotometer is not working properly it will have to be recalibrated Assume that if it is properly calibrated measured concentration for span gas samples is normally distributed On the basis of the six readings 69 77 68 85 72 and 82 is recalibration necessary Carry out a test of the relevant hypotheses using a 0 05 State the appropriate null and alternative hypotheses Ho 69 H 69 Ho 69 H 69 Ho 69 H 69 Ho 69 H 69 Ho 69 H 69 USE SALT Calculate the test statistic and determine the P value Round your test statistic to two decimal places and your P value to three decimal places t P value

Statistics
StatisticsNewly purchased tires of a particular type are supposed to be filled to a pressure of 30 psi Let denote the true average pressure A test is to be carried out to decide whether differs from the target value Determine the P value for each of the following z test statistic values Round your answers to four decimal places a 2 17 b 1 79 c 0 53 d 1 47 e 4 5 USE SALT

Statistics
StatisticsC The desired percentage of SiO2 in a certain type of aluminous cement is 5 5 To test whether the true average percentage is 5 5 for a particular production facility 16 independently obtained samples are analyzed Suppose that the percentage of SiO in a sample is normally distributed with o 0 32 and that x 5 21 Use a 0 05 a Does this indicate conclusively that the true average percentage differs from 5 5 State the appropriate null and alternative hypotheses Ho 5 5 H 5 5 Ho 5 5 H 5 5 Ho 5 5 H 5 5 Ho 5 5 Ha 5 5 Z B Calculate the test statistic and determine the P value Round your test statistic to two decimal places and your P value to four decimal places P value Kol State the conclusion in the problem context Do not reject the null hypothesis There is not sufficient evidence to conclude that the true average percentage differs from the desired percentage O Do not reject the null hypothesis There is sufficient evidence to conclude that the true average percentage differs from the desired percentage O Reject the null hypothesis There is sufficient evidence to conclude that the true average percentage differs from the desired percentage Reject the null hypothesis There is not sufficient evidence to conclude that the true average percentage differs from the desired percentage c What value of n is required to satisfy 0 01 and B 5 6 0 01 Round your answer up to the next whole number Homew b If the true average percentage is 5 6 and a level a 0 01 test based on n 16 is used what is the probability of detecting this departure from Ho Round your answer to four decimal places

Statistics
ProbabilityHarry has a 1 year ARM for 75 000 over a 25 year term The margin is 2 and the index rate starts out at 2 5 and increases to 3 5 at the first adjustment The balance of principal at the end of the first year is 73 338 52 Find the amount of monthly payment for the first month of the first year If necessary use the accompanying table of monthly payments Round to the nearest cent Click the icon to view the monthly payments table OA 489 42 OB 416 87 O C 388 14 D None of the above is correct

Statistics
ProbabilityConsider the following distribution 1 20 rating n 4821 0 062 0 25 0 01 0 562 0 81 4 15 0 Imagine an experiment where we will randomly draw a single observation from within this collection The probability that the value is between 4 068 and 0 005 is closest to 00 75 00 25 D01 00 5 D0 9 1 10 5 Imagine an experiment where we will randomly draw two observations from within this collection The probability that both values are between 20 093 and 2 359 is closest to

Statistics
StatisticsSuppose we have 378 observations in our data and for each we have recorded two numeric attributes x and y Sample average of x is 1000 Sample average of y is 100 Sample variance of x is 2500 Sample variance of y is 25 Note that our sample covariance is equal to the product of the correlation coefficient sample standard deviation of x and sample standard deviation of y i e Sxy xy Sx Sy Suppose our sample covariance sxy is 175 then our correlation coefficient is closest to Do D0 3 0 0 5 0 0 7 0 9 Again suppose our sample covariance sxy is 175 then our regression line slope is closest to D 0 014 2 8 0 042 0 1 4 D 0 07 Again suppose our sample covariance sxy is 175 then our regression line y intercept is closest to 142 0 114 D 1500 170 2900

Statistics
StatisticsAgain suppose our sample covariance sxy is 175 then the following scatterplot y vs x y 90 85 95 105 115 400 200 200 400 Could not represent our data This type of data problem is unrelated to scatterplots None of these selections apply Not enough information to answer this question

Statistics
StatisticsAgain suppose our sample covariance Sxy is 2500 then the following scatterplot y vs x y 008 006 1100 1300 200 0 200 400 X None of these selections apply Not enough information to answer this question This type of data problem is unrelated to scatterplots Could not represent our data Could represent our data

Statistics
StatisticsMatch the survey descriptions on the left with the correct type of bias on the right Types of Bias Every 5th student entering the cafeteria is asked to complete a survey on environmental issues Less than half agree to complete the survey The surveys show that a high proportion of the respondents are concerned about the environment and well informed about environmental issues A B C D sampling bias non response bias measurement bias response bias A survey asked students at a basketball game whether a fund for extra curricular activities should be used to buy new equipment for the school s sports teams or instruments for the school band The surveys show that most students want the funds to go to the sports teams Mr Fisher wants to know if there were any difficulties with the homework so he asks his math class Raise your hand if you had trouble with last night s homework A survey asked the question Which is the greatest rock and roll song of all time b Paint It Black c Welcome to the Jungle a Stairway to Heaven d Other

Statistics
Statistics9 a b minimum 0 11 12 13 Determine the following values 15 2 4 on the life span of his pet cats 15 15 16 16 17 18 18 18 19 19 20 20 21 22 30 maximum 6 Q1 Draw a box and whisker plot for the sample using the scale provided below 8 12 Q2 14 16 18 10 What lifespan would represent the 80th percentile Q3 20 22 range 24 26 28 interquartile range 30 32

Statistics
StatisticsMatch the sampling method on the left with the correct example on the right Examples simple random sample systematic sample stratified sample A B C voluntary response sample D convenience sample E Every 3rd name on the class list was chosen Everyone s name was drawn randomly from a hat Bob asks a few people their opinion while he is in the cafeteria at lunch time A survey is mailed to every household but people complete the survey only if they want to 25 of students in each grade were chosen

Statistics
Statistics1 Match the term on the left with the correct definition on the right Population Sample Statistical Bias Mean Median Mode Standard Deviation Z score Definitions A B C D E LL G H the middle value in a set of data a measure of how many standard deviations the piece of data is from the mean all individuals who belong to a group being studied a factor that favours certain outcomes in survey responses the most occurring value in a set of data the average value in a set of data a selection of individuals who belong to a group being studied a measure of how far from the mean most of the pieces of data are in the data set

Statistics
StatisticsPage 3 of 4 154 175 166 138 161 171 165 188 Bob measured the heights of all his cousins The heights are rounded to the nearest centimetre 139 137 144 154 186 191 177 154 138 156 146 176 191 151 173 164 154 186 173 151 164 174 a Complete the frequency table for the data Interval cm 131 140 141 150 151 160 161 170 171 180 181 190 191 200 Frequency b Determine the approximate mean height of Bob s cousins by only using the grouped data in the frequency table from part a Show your work no spreadsheet
Statistics
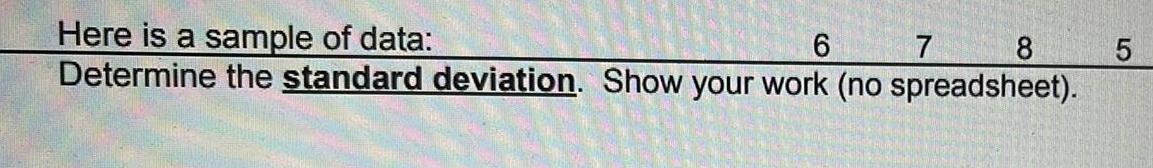
Statistics6 8 Here is a sample of data Determine the standard deviation Show your work no spreadsheet 7 5

Statistics
Statisticsa b re is a sample of data 6 8 Determine the mean Show your work no spreadsheet 7 Determine the median Show your work no spreadsheet 5

Statistics
StatisticsGive the contrapositive and converse of each of the statements in Exercises 47 54 phrasing your answers in words 1 These birds flock together only if they are of a feather 2 In order to read the Tarot it is necessary to consult the Oracle 3 Nuclear physicists would be out of work if their accomplishments were measured purely by the generation of profit

Statistics
StatisticsIn a study of government financial aid for college students it becomes necessary to estimate the percentage of full time college students who earn a bachelor s degree in four years or less Find the sample size needed to estimate that percentage Use a 0 01 margin of error and use a confidence level of 95 www Assume prior studies have shown that about 45 of full time students earn bachelor s degrees in four years or Round up to the nearest integer

Statistics
Statisticson appears to be normally distributed is appropriate for a 98 confidence level where n 7 6 27 and the A ta 2 1 96 Z 2 2 33 OC Za 2 2 05 D ta 2 2 575 1 B B

Statistics
Probabilityghts of college football players are normally distributed with a mean of 200 pounds and a standa deviation of 50 pounds If a college football player is randomly selected find the probability that he weig between 170 and 220 pounds Round to four decimal places A 0 0703 OB 0 1554 OC 0 2257 D 0 3812 www

Statistics
StatisticsFind the standard deviation o for the binomial distribution which has n 48 and p 3 Round your answer t the nearest hundredth A 6 66 OB 3 39 OC o 0 98 D o 7 51

Statistics
StatisticsHow many students must be randomly selected to estimate the mean weekly eamings of students at one college We want 95 confidence that the sample mean is within 4 of the population mean and the population standard deviation is known to be 90 OA 1 945 B 1 370 C 1 714 D 2 748 um sample size required to estimate an unknown population mea HARI www

Statistics
Statisticsge survey 22 of all students work full time Find the mean for the number of students who work full time in samples of size 16 Round to the nearest tenth as needed OA 4 0 students B 0 2 students OC 2 8 students OD 3 5 st dents 441
Statistics
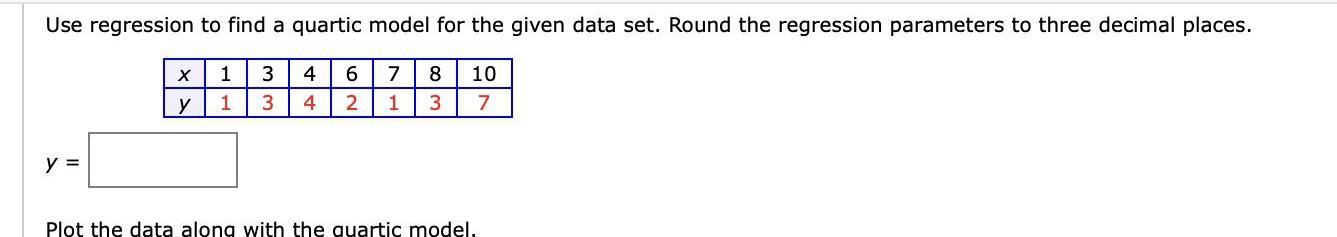
StatisticsUse regression to find a quartic model for the given data set Round the regression parameters to three decimal places 7 8 10 1 3 7 y X y 1 3 4 6 1 3 4 2 Plot the data along with the quartic model

Statistics
Statisticsthe amount of time it takes a mechanic to rebuild the transmission for a 2010 Chevrolet Colora shows that the mean is 8 4 hours and the standard deviation is 1 8 hours If 40 mechanics are randomi selected find the probability that their mean rebuild time is less than 8 9 hours Round to four decimal places A 0 4276 OB 0 9589 O C C 0 9756 OD 0 9605

Statistics
Statistics81 on a test are normally distributed with a mean of 63 2 and a standard deviation of 11 7 Find P separates the bottom 81 from the top 19 Round to two decimal places A 0 88 B 73 47 O c 66 60 OD 0 29 www

Statistics
StatisticsA 0 8340 OB 0 1685 OC 0 1922 OD 0 1660 variable fiind P Z 0 97 Round to four decimal places

Statistics
StatisticsK It is a standard normal variable find the probability that z lies between 2 41 and 0 Round to four decimal places A 9 4920 B 0 4910 OC 0 5080 OD 0 0943 1 possible Submit test

Statistics
StatisticsA psychologist claims that more than 5 8 of the population suffers from professional problems due t extreme shyness Use p the true percentage of the population that suffers from extreme shyness OA Ho p 5 8 H p 5 8 OB Ho p 5 8 H p 5 8 O c Ho p 5 8 H p 5 8 D Ho p 5 8 H p 5 8 Symbolic form Use the conect symbor wille

Statistics
Probabilityselected find the probability that the person is a man or a heavy smoker Round to three decima bits of a group of asthma sufferers If one of the 1156 people is places as needed Men Women Total A 0 511 B 0 596 OC 0 557 D 0 554 Nonsmoker 431 382 813 Occasional Smoker 50 48 98 Regular Smoker 71 86 157 Heavy Smoker 49 39 88 Total 601 555 1156

Statistics
StatisticsWhich summarizes the results of testing for a certain disease If one of the results is randomly selected what is the probably that it is a false negative test indicates the person does not have the disease when in fact they do What does this probability suggest about the accuracy of the test Subject has the disease Subject does not have the disease Positive Test Negative Test Result Result 4 172 O A 591 The probability of this error is high so the test is not very accurate B 0 0348 The probability of this error is low so the test is fairly accurate C 0 0134 The probability of this error is low so the test is fairly accurate D 0 0369 The probability of this error is low so the test is fairly accurate

Statistics
Probabilityade W Una test of agender selection technique results Considered of 254 baby girls 5 baby boys Based on this result what is the probability of a girl born to a Couple using this technique The probality that a girl will we born using this technique is approximately answer needs to have Ba be rounded 3 decimal placer

Statistics
StatisticsHo Beryllium exposure and disease status are independent H Beryllium exposure and disease status are not independent Part 1 4 Part 2 of 4 b Find the P value Round your answer to at least four decimal places The P value is X 5

Statistics
Statisticsacademic standards Because of that you want to know if the variance in test scores among student athletes o is lower To find out you survey a random sample of 12 student athletes You find the sample variance is 164 1 Assume test scores for student athletes follow a normal distribution Is there sufficient evidence to conclude that the population variance is less than 401 8 To answer complete the parts below to perform a hypothesis test Use the 0 05 level of significance a State the null hypothesis and the alternative hypothesis that you would use for the test Ho H 0 0 0 0 020 Chi square Distribution Step 1 Enter the number of degrees of freedom Step 3 Enter the test statistic Round to 3 decimal places Step 2 Select one tailed or two tailed O One tailed O Two tailed Step 5 Enter the p value Round to 3 decimal places X b Perform a chi square test and find the p value Here is some information to help you with your chi square test S The value of the test statistic is given by 1 n 1 s 0 Step 4 Shade the area represented by the p value OSO The p value is the area under the curve to the left of the value of the test statistic O O 00 02 03 0 1 15 Since the p value is less than or equal to the level of significance the null hypothesis is rejected So there is enough evidence to conclude that the variance is less than 401 8 O Since the p value is less than or equal to the level of significance the null hypothesis is not rejected So there is not enough evidence to conclude that the variance is less than 401 8 O Since the p value is greater than the level of significance the null hypothesis is rejected So there is enough evidence to conclude that the variance is less than 401 8 20 O Since the p value is greater than the level of significance the null hypothesis is not rejected So there is not enough evidence to conclude that 25 c Based on your answer to part b choose what can be concluded at the 0 05 level of significance about the population variance in the test scores for student athletes 30 35 5 5 F Ar M

Statistics
StatisticsWhich of the following commands computes the standard deviation of each column of a matrix A apply A 1 2 sd O apply A 1 sd apply A 2 sd O sd A


Statistics
StatisticsWhat is the error message given when attempting to perform arithmetic or comparison between matrices of different sizes O longer object length is not a multiple of shorter object length non conformable arrays O missing value where TRUE FALSE needed

Statistics
StatisticsWhich of the following is not a possible output of calling nrow on a storage object 01 O 0 NULL

Statistics
ProbabilitySuppose one wants to matrix multiply a matrix A by a matrix B in R Which of the following conditions must be true Oncol A nrow A Oncol A ncol B ncol B nrow B

