Statistics Questions
The best high school and college tutors are just a click away, 24×7! Pick a subject, ask a question, and get a detailed, handwritten solution personalized for you in minutes. We cover Math, Physics, Chemistry & Biology.

Statistics
StatisticsDetermine whether the following procedure results in a binomial distribution or a distribution that can be treated as binomial by applying the 5 guideline for cumbersome calculations If it is not inomial and cannot be treated as binomial identify at least one requirement that is not satisfied The House members of the 116th Congress include 309 males and 126 females Forty different representatives are randomly selected without replacement and the gender of each selected representative is recorded Choose the correct answer below OA It is binomial or can be treated as binomial OB It is not binomial because the selections are not independent The 5 guideline for cumbersome calculations should not be used OC It is not binomial because the experiment is not performed a fixed number of times OD It is not binomial because there are more than two mutually exclusive outcomes for each trial

Statistics
ProbabilityWhen randomly selecting an adult A denotes the event of selecting someone with blue eyes What do P A and P A represent P A represents the P A represents the

Statistics
ProbabilityIn a horse race a particular bet is won if you selected the three horses that finish first second and third and they can be selected in any order A certain horse race had a field of 16 horses What is the probability of winning this bet if you randomly select the horses The possibility of winning this bet when randomly selecting the horses is Round to five decimal places as needed

Statistics
StatisticsThis question 1 point s possible Listed below are the ages of 11 players randomly selected from the roster of a championship sports team Find the a mean b median c mode and d midrange and then e determine how the resulting statistics are fundamentally different from those calculated from the jersey numbers of the same 11 players 42 22 31 33 32 29 25 26 26 31 25 Click the icon to view jersey numbers data and statistics a Find the mean The mean age is years Type an integer or a decimal rounded to one decimal place as needed b Find the median The median age is years Type an integer or a decimal rounded to one decimal place as needed c Find the mode Select the correct choice below and if necessary fill in the answer box to complete your choice OA The mode s is are year s Type an integer or a decimal Do not round Use a comma to separate answers as needed OB There is no mode Jersery Data Jersey Numbers 14 31 50 13 9 89 75 66 65 70 64 mean 49 6 median 64 d Find the midrange The midrange is years Type an integer or a decimal rounded to one decimal place as needed e How are the resulting statistics fundamentally different from those calculated from the jersey numbers of the same 11 players The jersey numbers are data at the level of measurement but the ages are data at the level of measurement so mode none Print min 9 Done max 89 statistics are meaningful Submit test midrange 49

Statistics
ProbabilityFind the probability that when a couple has three children at least one of them is a girl Assume that boys and girls are equally likely The probability is that at least one of the three children is a girl Simplify your answer Do not round

Statistics
StatisticsAnnual incomes of statistics students are known to have a distribution that is skewed to the right instead of being normally distributed Assume that we collect a random sample of annual im 50 statistics students Can the distribution of incomes in that sample be approximated by a normal distribution because the sample is large Why or why not Choose the correct answer below CT OA Yes the sample size is over 50 so the sample of incomes will be normally distributed OB No unless more than 50 samples are collected the sample of incomes will not be normally distributed OC No the population of incomes is not normally distributed so the sample means will not be normally distributed for any sample size OD No the sample means will be normally distributed but the sample of incomes will be skewed to the right
Statistics
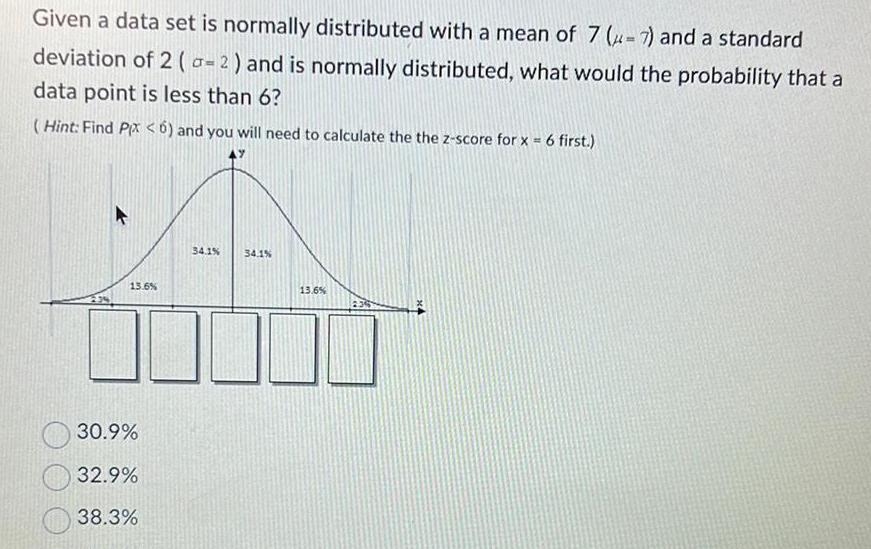
StatisticsGiven a data set is normally distributed with a mean of 7 7 and a standard deviation of 2 a 2 and is normally distributed what would the probability that a data point is less than 6 Hint Find Pix 6 and you will need to calculate the the z score for x 6 first 13 6 30 9 32 9 38 3 34 1 34 1 13 6

Statistics
StatisticsMendel s Theory According to Mendel s theory if tall and colorful plants are crossed with short and colorless plants the 3 corresponding probabilities are 16 for tall and colorful tall and colorless short and colorful and short and colorless respectively If 6 plants are selected find the probability that 2 will be tall and colorful 2 will be tall and colorless 2 will be short and colorful and 0 will be short and colorless Enter your answer as a simplified fraction or a decimal rounded to at least four decimal places 9 3 16 16 7 16 and

Statistics
StatisticsIs the data normally distributed If so estimate the mean 00 242 6044 0 2 4 66966 8 6 8 10 12 Yes z 13 2 Yes 10 7 Yes z 22 Not normally distributed X A 14 16 18 20 22

Statistics
StatisticsYou measure 36 watermelons weights and find they have a mean weight of 41 ounces Assume the population standard deviation is 11 2 ounces Based on this construct a 90 confidence interval for the true population mean watermelon weight Give your answers as decimals to two places Quncor

Statistics
StatisticsPrice of eggs and milk The following table presents the average price in dollars for a dozen eggs x and a gallon of milk y for certain months in a recent year Compute the least squares regression line for predicting the price of milk from the price of eggs Dozen Eggs Gallon of Milk 3 12 3 08 3 07 3 01 2 99 2 98 2 98 3 05 3 03 3 11 1 69 1 77 1 50 1 53 1 50 1 63 1 63 1 60 1 71 1 77 Send data to Excel C E

Statistics
StatisticsX Compute the least squares regression line for predicting the 2018 budget y from the 2006 budget x Round the slope and y intercept to at least four decimal places Regression line equation y 0 9427x 6 7693 Correct Answer Regression line equation y 6 7661 0 9427x Part 1 3 Part 2 of 3 If two institutions have budgets that differ by 18 million dollars in 2006 by how much would you predict their budgets to differ in 2018 Round the answer to three decimal places Espa ol 81 E

Statistics
StatisticsLeft Foot 80 80 85 87 86 78 76 88 Send data to Excel Part 0 4 ving table Right Foot 80 81 85 82 85 78 80 89 Part 1 of 4 Compute the least squares regression line for predicting the right foot temperature y from the left foot temperature C values to four decimal places

Statistics
ProbabilityThe article Effects of Bottle Closure Type on Consumer Perception of Wine Quality reported that in a sample of 106 wine consumers 22 thought that screw tops were an acceptable substitute for natural corks Suppose a particular winery decided to use screw tops for one of its wines unless there was strong evidence to suggest that fewer than 26 of wine consumers found this acceptable USE SALT a Using a significance level of 0 10 what would you recommend to the winery State the appropriate null and alternative hypotheses Ho P 0 26 H P 0 26 Ho P 0 26 H P 0 26 Ho p 0 26 H P 0 26 Ho P 0 26 H P 0 26 Ho P 0 26 H p 0 26 Calculate the test statistic and determine the P value Round your test statistic to two decimal places and your P value to four decimal places Z P value State the conclusion in the problem context

Statistics
StatisticsThe desired percentage of SiO in a certain type of aluminous cement is 5 5 To test whether the true average percentage is 5 5 for a particular production facility 16 independently obtained samples are analyzed Suppose that the percentage of SiO in a sample is normally distributed with 0 32 and that x 5 21 Use a 0 05 a Does this indicate conclusively that the true average percentage differs from 5 5 State the appropriate null and alternative hypotheses Ho 5 5 Ha 5 5 Ho 5 5 H 5 5 Ho 5 5 H 5 5 Ho 5 5 Ha 5 5 Calculate the test statistic and determine the P value Round your test statistic to two decimal places and your P value to four decimal places Z P value State the conclusion in the problem context Do not reject the null hypothesis There is not sufficient evidence to conclude that the true average percentage differs from the desired percentage O Do not reject the null hypothesis There is sufficient evidence to conclude that the true average percentage differs from the desired percentage Reject the null hypothesis There is sufficient evidence to conclude that the true average percentage differs from the desired percentage O Reject the null hypothesis There is not sufficient evidence to conclude that the true average percentage differs from the desired percentage b If the true average percentage is 5 6 and a level a 0 01 test based on n 16 is used what is the probability of detecting this departure from Ho Round your answer to four decimal places nic required to satisfy a 0 01 and B 5 6 0 01 Round your answer up to the next whole number

Statistics
StatisticsThe calibration of a scale is to be checked by weighing a 14 kg test specimen 25 times Suppose that the results of different weighings are independent of one another and that the weight on each trial is normally distributed with 0 200 kg Let denote the true average weight reading on the scale a What hypotheses should be tested Ho 14 H 14 Ho 14 H 14 Ho 14 H 14 Ho 14 Ha 14 Ho 14 Ha 14 b With the sample mean itself as the test statistic what is the P value when x 13 81 Round your answer to four decimal places What would you conclude at significance level 0 01 O Conclude that the true mean measured weight differs from 14 kg O Conclude that the true mean measured weight is the same as 14 kg c For a test with a 0 01 what is the probability that recalibration is judged unnecessary when in fact 14 2 Round your answer to four decimal places For a test with a 0 01 what is the probability that recalibration is judged unnecessary when in fact 13 9 Round your answer to four decimal places

Statistics
StatisticsThe recommended daily dietary allowance for zinc among males older than age 50 years is 15 mg day An article reports the following summary data on intake for a sample of males age 65 74 years n 112 x 12 9 and s 6 74 Does this data indicate that average daily zinc intake in the population of all males age 65 74 falls below the recommended allowance Use a 0 05 State the appropriate null and alternative hypotheses Ho 15 Ha 15 Ho 15 H 15 Ho 15 Ha 15 Ho 15 Ha 15 Calculate the test statistic and determine the P value Round your test statistic to two decimal places and your P value to four decimal places Z P value State the conclusion in the problem context O Reject the null hypothesis There is sufficient evidence that average daily zinc intake falls below 15 mg day Do not reject the null hypothesis There is sufficient evidence that average daily zinc intake falls below 15 mg day Do not reject the null hypothesis There is not sufficient evidence that average daily zinc intake falls below 15 mg day O Reject the null hypothesis There is not sufficient evidence that average daily zinc intake falls below 15 mg day

Statistics
ProbabilityYes Correct Answer No the x values must be positive Part 2 4 the x values must be positive Part 3 of 4 If the systolic pressures of two patients differ by 7 millimeters by how much would you predict their diastolic pressures to differ Round the answ three decimal places The diastolic pressure would differ by millimeters X S

Statistics
StatisticsRegression line equation y 6 7661 0 9427x Part 1 3 Part 2 of 3 If two institutions have budgets that differ by 18 million dollars in 2006 by how much would you predict their budgets to differ in 2018 Round the answ to three decimal places In 2018 their budgets would differ by million dollars X 5

Statistics
StatisticsRegression line equation y 801 Correct Answer Regression line equation y 9 6733 0 5744x Part 1 4 Part 2 of 4 Is it possible to interpret the y intercept Explain Choose one the x values must be Choose one X

Statistics
StatisticsSuppose one is interested in testing the null hypothesis Ho 100 against the alternative H 100 It is known that population is normally distributed and that O 16 A test statistic of Z calculated 2 25 is computed What can you conclude from this Note This is a one tailed test Because sample size is unavailable distribution of xbar is unknown and no inference can be made be Reject the Ho at 5 level of significance Do not reject the Ho at 10 level of significance

Statistics
StatisticsThe scatter plot shows the time spent texting x and the time spent exercising y by each of 25 students last week a Write an approximate equation of the line of best fit for the data It doesn t have to be the exact line of best fit b Using your equation from part a predict the time spent exercising for a student who spends 4 hours texting Note that you can use the graphing tools to help you approximate the line Time spent exercising in hours 10 9 8 x 7 6 5 y 4 3 2 1 0 x 1 X X 12 X X X X X X 4 5 X X 6 X X 7 Time spent texting in hours x X X X X 8 9 x X X 10 X X S a Write an approximate equation of the line of best fit y 0 b Using your equation from part a predict the time spent exercising for a student who spends 4 hours texting hours X

Statistics
Statistics2 Kristin exercises 5 hours each week Make a dot plot of her hours of exercise and include the hours her friends exercise Kristin and her friends total hours of exercise are shown in the table How does Kristin s exercise time compare with her friends 0 9 3 6 6 5 5 4 5 4 A 5

Statistics
StatisticsWhich of the following would decrease the width of a confidence interval for population mean

Statistics
StatisticsA B C E F G H 1 J K M Note The goal of the project is to practice making a confidence interval for a mean and proportion with real data Do not worry about failed assumptions tests and do 1 not make corrections for small sample size Use primary methods described in text and used on homework 2 3 Age 4 5 6 7 8 9 10 11 12 13 14 15 16 17 18 19 20 21 FATHER2858 22 23 24 26 27 29 30 31 32 22 Gender 23 Female 34 Female 41 Female 26 Male 18 Male 25 Male 19 Male 36 Male 21 Female 19 Female 20 Male 19 Female 20 Female 18 Male 21 Male 19 Female 23 Female 27 Male 26 Male 25 Female 23 Female 18 Male 37 Female D Points 1 2 2 2 1 1 2 1 1 2 2 2 2 1 1 Sample Mean Sample St Dev Sample Size Distribution 95 Confidence Interval for Average Age of Online College Students Critical Value Margin of Error Lower Bound Upper Bound Interpret context We can conclude Sample Size Number of Males Male Proportion Distribution Critical Value 24 26 6 68 23 Normal Distribution Margin of Error Lower Bound Upper Bound m 95 Confidence Interval for Proportion of Male Online College Students 19 64 2 decimals 2 decimals Calculation Calculation 2 decimals 2 decimals Calculation 23 11 9 0909 Female Proportion T Distribution 23 43 2 decimals 4 decimals 4 decimals 4 decimals Calculation Calculation Calculation Note Calculation cells should list the numbers and operations used to get your answers Do not put the generic formula and show all calculation steps L 8 3333 4 decimals 0 P Q R S Help for this spreadsheet Review 8 2 of your text as well as the Project Help tab below for the first confidence interval calculation mean Also watch Excel videos in Canvas T Review 8 3 of your text as well as the Project Help tab below for the second confidence interval calculation proportion Also watch Excel videos in Canvas For the Interpret text what can we conclude about the population mean age and the population male proportion of online students with respect to these bounds Your data for Columns A and B will link from the Week 3 tab on this spreadsheet no need to re input Show Your Calculation these cells should list the numbers and operations used to get your answers Do not just put the general formula and show all calculation steps Do not put in formulas so I can see the formula by just looking at the cell not opening it The green cells G3 and G4 will link from the Week 3 tab on this spreadsheet Only cells that are yellow need to be completed Please note rounding for calculations U V

Statistics
Statistics157 154 134 115 113 123 Based on results published in the Journal of Human Hypertension Send data to Excel Part 0 4 103 94 87 83 77 77 Part 1 of 4 Compute the least squares regression line for predicting the diastolic pressure y from the systolic pressure x Round the slope and y least four decimal places Regression line equation y

Statistics
StatisticsNational Endowment for the Humanities National Endowment for Arts National Gallery of Art Kennedy Center for the Performing Arts Smithsonian Institution Corporation for Public Broadcasting Send data to Excel Part 0 3 Part 1 of 3 135 121 88 17 8 4 142 124 95 18 2 18 Compute the least squares regression line for predicting the 2018 budget y from the 2006 budget x Round the slope and y intercept to decimal places

Statistics
StatisticsPlease define and explain the differences between all these kind of experiments Expression functional binding establishing and or hypothesis driven experiment I want to know what is an Establishing experiment
Statistics
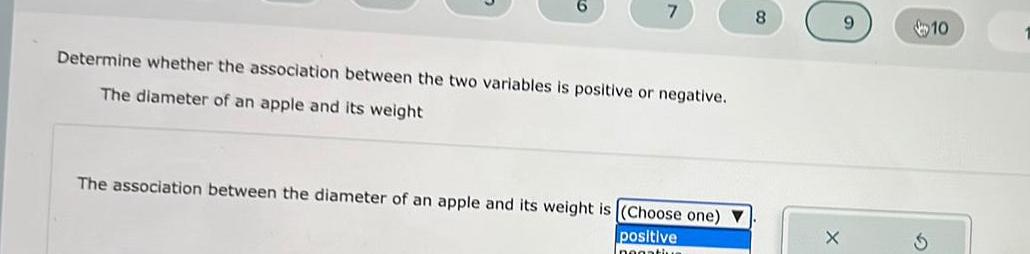
Probability7 Determine whether the association between the two variables is positive or negative The diameter of an apple and its weight The association between the diameter of an apple and its weight is Choose one positive negatius 8 X 9 10

Statistics
Statistics1 2 Compute the correlation coefficient x 16 5 2 3 y 1 3 6 5 4 3 Send data to Excel The correlation coefficient is 4 5 6 7 Round the answer to three decimal places 8 X 9 10 11

Statistics
Statistics3 5 8 correlation coefficient Choose one appropriate because Choose one is is not 10 ne whether the correlation coefficient is an appropriate summary for the scatterplot and explain your reasoning 11 12 13

Statistics
Statistics2 3 4 5 6 7 8 The correlation coefficient Choose one appropriate because Choose one 9 10 Determine whether the correlation coefficient is an appropriate summary for the scatterplot and explain your reasoning the variables have a weak linear relationship the variables have a linear relationship the mishl 11 12 13

Statistics
Probability5 6 Determine whether the association between the two variables is positive or negative The age of a car and the number of miles on its odometer 8 9 The association between age of a car and the number of miles on its odometer is Choose one 10 11 12

Statistics
Statisticsrejected a mean of 2 0 circuit boards per batch produced with a variance of 0 36 The factory manager suspects that because the company now uses a new molding process the variance o is greater than 0 36 She tests a random sample of 24 batches produced using the new process and finds that the mean number of circuit boards rejected is 2 per batch with a variance of 0 52 If we assume that the numbers of circuit boards rejected per batch using the new process are approximately normally distributed is there sufficient evidence to conclude at the 0 05 level of significance that the manager is correct Perform a one tailed test Then complete the parts below Carry your intermediate computations to three or more decimal places If necessary consult a list of formulas a State the null hypothesis Ho and the alternative hypothesis H Ho H 0 b Determine the type of test statistic to use Choose one c Find the value of the test statistic Round to three or more decimal places Find the critical value Round to three or 0 decimal places e Can we support the claim that the variance of number of circuit boards rejected per batch using the new process is greater than 0 36 OYes O No X a X S p 0 0 OSO 020 0 0 o 00 0

Statistics
ProbabilityGiven the probability distribution table below find the value of k X P x 6 0 15 12 0 30 24 36 0 25

Statistics
StatisticsBased on ras a hospita proport n Pr term babies born in the community that weigh more than 7 pounds is 37 A pediatrician who works with several hospitals in the community would like to verify the hospital s claim In a random sample of 210 babies born in the community 70 weighed over 7 pounds Is there enough evidence to reject the hospital s claim at the 0 05 level of significance Perform a two tailed test Then complete the parts below Carry your intermediate computations to three or more decimal places If necessary consult a list of formulas a State the null hypothesis H and the alternative hypothesis H Ho H 0 b Determine the type of test statistic to use Choose one c Find the value of the test statistic Round to three or more decimal places d Find the p value Round to three or more decimal places 0 e Can we reject the claim that the proportion of full term babies born in the community that weigh more than 7 pounds is 37 OYes No 3 XI 0 0 a X S 0 0 OSO 020 0 0 p Q S Olo 0 0

Statistics
StatisticsYumi reads that the average maple leaf is 5 5 inches in length She believes the maple leaves growing on the trees in her yard are longer She randomly selects 15 leaves from the trees and measures them The sample mean is 5 65 inches with a sample standard deviation of 0 36 nches Perform a significance test for the sample mean using a significance level of 0 05

Statistics
StatisticsSuppose that a random sample of 15 adults has a mean score of 68 on a standardized personality test with a standard deviation of 7 A higher score indicates a more personable participant If we assume that scores on this test are normally distributed find a 95 confidence interval for the mean score of all takers of this test Give the lower limit and upper limit of the 95 confidence interval Carry your intermediate computations to at least three decimal places Round your answers to one decimal place If necessary consult a list of formulas Lower limit Upper limit 0 X S


Statistics
ProbabilityAn Internet research company surveyed 90 online shoppers each of whom made one purchase today The company recorded the type of purchase each shopper made Here is a summary Type of purchase Toys Electronics Beauty supplies Pet supplies Number of shoppers 28 19 0 25 18 Three shoppers from the survey are selected at random one at a time without replacement What is the probability that none of the three shoppers purchased toys Do not round your intermediate computations Round your final answer to three decimal places If necessary consult a list of formulas X S

Statistics
StatisticsTwo athletes are training for a cycling race Each athlete recorded the distance in miles of their previous 75 training rides The box and whisker plots below sometimes called boxplots summarize the distances recorded for each athlete Use the box and whisker plots to answer the questions S 10 15 20 25 30 Distance in miles a Which athlete had distances with a larger interquartile range IQR b Which athlete went on the shortest training ride 35 c Which athlete went on more rides longer than 24 miles d Which athlete had a greater median distance 40 Athlete A Athlete B Choose one Choose one Choose one Choose one 45

Statistics
StatisticsA food distribution company claims that a fast food restaurant chain receives on average 24 pounds of meat on a daily basis The district manager of the restaurant chain decides to randomly sample 45 shipments from the company and finds a mean weight of 23 pounds with a standard deviation of 4 1 pounds Test at a 5 level of significance to determine whether or not the food distribution company sends less than they claim a Check all of the requirements that are satisfied random the distribution is normal since n 30 the distribution is normal since the distribution is normal the distribution is normal since np 10 and nq 10 b Identify the null and alternative hypotheses Ho Or X OF X 024 H H c What type of hypothesis test should you conduct left right or two tailed O left tailed Oright tailed two tailed O 24 OF 0 d Identify the appropriate significance level Make sure to enter your answer as a decimal 0 03 e Which calculator function should you use T Test f Find the test statistic Write the result below and be sure to round your final answer to two decimal places 2 36 g Find the p value Enter your answer as a decimal not a percentage and round to 4 decimal places

Statistics
StatisticsAmong college students the proportion p who say they re interested in their congressional district s election results has traditionally been 75 After a series of debates on campuses a political scientist claims that the proportion of college students who say they re interested in their district s election results is more than 75 A poll is commissioned and 22 out of a random sample of 275 college students say they re interested in their district s election results Is there enough evidence to support the political scientist s claim at the 0 10 level of significance Perform a one tailed test Then complete the parts below Carry your intermediate computations to three or more decimal places If necessary consult a list of formulas a State the null hypothesis Ho and the alternative hypothesis H H H 0 b Determine the type of test statistic to use Choose one c Find the value of the test statistic Round to three or more decimal places 0 d Find the p value Round to three or more decimal places 0 e Is there enough evidence to support the political scientist s claim that the proportion of college students who say they re interested in their district s election results is more than 75 QYes Ne 3 XI 5 O S X 2 0 0 0 0 OSO p 00 S O

Statistics
Statisticsend will have any effect on the variance The owner surveys a random sample of 15 customers who ordered from the new menu For the customers surveyed the variance of ratings is 47 4 Assume the ratings for customers who order from the new menu follow a normal distribution Is there enough evidence to conclude that the population variance differs from 27 2 To answer complete the parts below to perform a hypothesis test Use the 0 10 level of significance a State the null hypothesis H and the alternative hypothesis that you would use for the test Ho H 0 O Chi square Distribution Step 1 Enter the number of degrees of freedom 0 020 Step 3 Enter the test statistic Round to 3 decimal places Step 2 Select one tailed or two tailed O One tailed O Two tailed Step 5 Enter the p value Round to 3 decimal places X b Perform a chi square test and find the p value Here is some information to help you with your chi square test Step 4 Shade the area represented by the p value S Os 0 The value of the test statistic is given by x The p value is two times the area under the curve to the right of the value of the test statistic 0 0 0 0 0 3 0 2 01 10 n 1 s 0 Since the p value is less than or equal to the level of significance the null hypothesis is rejected So there is enough evidence to conclude that the variance differs from 27 2 Since the p value is less than or equal to the level of significance the null hypothesis is not rejected So there is not enough evidence to conclude that the variance differs from 27 2 Since the p value is greater than the level of significance the null hypothesis is rejected So there is enough evidence to conclude that the variance differs from 27 2 Since the p value is greater than the level of significance the null hypothesis is not rejected 20 25 c Based on your answer to part b choose what can be concluded at the 0 10 level of significance about the population variance of ratings for customers who order from the new menu 30 X X 35 S
Statistics
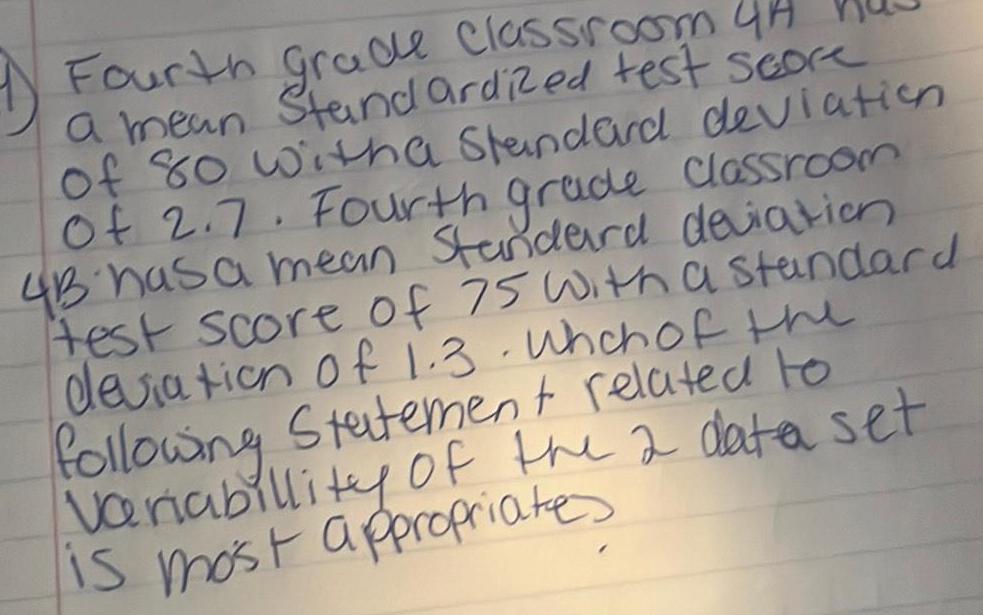
StatisticsFourth grade classroom 4H a mean Standardized test score of 80 witha Standard deviation Of 2 7 Fourth grade classroom 4B has a mean Standard deviation test score of 75 with a standard deration of 1 3 Which of the following Statement related to Variabillity of the 2 data set is most appropriates

Statistics
StatisticsThe accompanying data table lists the magnitudes of 50 earthquakes measured on the Richter scale Test the claim that the population of earthquakes has a mean magnitude greater tha 1 00 Use a 0 01 significance level Identify the null hypothesis alternative hypothesis test statistic P value and conclusion for the test Assume this is a simple random sample Click the icon to view the sample data What are the hypotheses OA Ho H 1 00 in magnitude H u 1 00 in magnitude OC Ho 1 00 in magnitude H 1 00 in magnitude B Ho 1 00 in magnitude H 1 00 in magnitude OD Ho 1 00 in magnitude H 1 00 in magnitude

Statistics
StatisticsA data set has mean 25 and Standard deviation of 12 If a data value has a Z Seare of 2 1 42 what was the original dat data values Round your answer to the nearest hundreath

Statistics
Statistics16 A data set has mean of 25 and Standard deviation of 12 If a data value has a Z Seare 2 of 2 1 42 what was the original dat data value Round your answer to the nearest hundredth Re Call that X X 5

Statistics
StatisticsA 93 average is required to earn an A in an English Class The final grade is based upond 3 essays weight at 15 each a term paper weighte at 25 a final exam weighted at 30 If you grades are as follows what is the best possible grade you can earn in the class Essay 1 78 Essay 2 85 Essay 31 82 85

Statistics
StatisticsA data set lists earthquake depths The summary statistics are n 400 x 5 62 km s 4 58 km Use a 0 01 significance level to test the claim of a seismologist that these earthquakes are from a population with a mea equal to 5 00 Assume that a simple random sample has been selected Identify the null and alternative hypotheses test statistic P value and state the final conclusion that addresses the original claim What are the null and alternative hypotheses OA Ho 5 00 km H 5 00 km OC Ho 5 00 km H 5 00 km OB Ho 5 00 km H 5 00 km OD Ho 5 00 km H 5 00 km