Statistics Questions
The best high school and college tutors are just a click away, 24×7! Pick a subject, ask a question, and get a detailed, handwritten solution personalized for you in minutes. We cover Math, Physics, Chemistry & Biology.

Statistics
Statisticswho believed that getting rich was an important personal goal was 80 A researcher decides to test whether or not that percentage still stands He finds that among the 235 high school seniors in his random sample 191 believe that getting rich is an important goal Can he conclude at the 0 05 level of significance that the proportion has indeed changed Perform a two tailed test Then complete the parts below Carry your intermediate computations to three or more decimal places If necessary consult a list of formulas a State the null hypothesis Ho and the alternative hypothesis H H 0 H 0 b Determine the type of test statistic to use Choose one c Find the value of the test statistic Round to three or more decimal places d Find the p value Round to three or more decimal places e Can we conclude that the proportion of high school seniors who believe that getting rich is an important goal has changed OYes No 3 H X X a S OSO 0 0 p 20 0 0

Statistics
StatisticsA 9 year old girl did a science fair experiment in which she tested professional touch therapists to see if they could sense her energy field She flipped a coin to select either her right hand or her left hand and then she asked the therapists to identify the selected hand by placing their hand just under her hand without seeing it and without touching it Among 259 trials the touch therapists were correct 113 times Use a 0 05 significance level to test the claim that touch therapists use a method equivalent to random guesses Do the results suggest that touch therapists are effective Identify the null and alternative hypotheses for this test Choose the correct answer below A Ho p 0 5 H p0 5 OC Ho p0 5 H p 0 5 Identify the test statistic for this hypothesis test The test statistic for this hypothesis test is Round to two decimal places as needed OB Ho p 0 5 H p 0 5 OD Ho p 0 5 H p 0 5

Statistics
ProbabilityLisa conducted an experiment with two cards randomly chosen from a computer program There were 48 cards four colors of cards numbering 1 12 in each color She counted all cards 10 and above as 10 and all other cards at number value Lisa added the numbers and recorded the sums by separating them into groups of greater than or equal to 12 or less than 12 She also recorded whether the cards had the same value What is the experimental probability of receiving two cards with a sum less than 12 and with two cards that have the same value 01 12 04 0 O O 14 Pair 212 1 2 Yes No Same Value No 2 No 3 Yes No 4 No 5 Yes Yes Yes 6 No No 7 No No 8 Yes Yes 9 No No 10 No No 11 Yes Yes 12 No No

Statistics
Statisticsthan fifteen miles to school is less than 25 A researcher wants to test this A random sample of 260 students at this college is selected and it is found that 61 commute more than fifteen miles to school Is there enough evidence to support the college s claim at the 0 10 level of significance Perform a one tailed test Then complete the parts below Carry your intermediate computations to three or more decimal places If necessary consult a list of formulas a State the null hypothesis Ho and the alternative hypothesis H H H b Determine the type of test statistic to use Choose one c Find the value of the test statistic Round to three or more decimal places d Find the p value Round to three or more decimal places 0 e Is there enough evidence to support the claim that the proportion of students who commute more than fifteen miles to school is less than 25 OYes O No H X 5 0 0 0 X O S OSO 0 0 P Q 020 O

Statistics
Statistics2 2 2 2 2 20 Annual Sports Drink Consumption Gallons y 0 7368x 1445 2 R 0 9235 wwww 0 1975 1980 1955 1990 1995 2000 2005 2010 2015 Year Annual Sports Drink Consumption Gallons Linear Annual Sports Drink Consumption Gallons Annual Sports Drinks 2020 2025 14 12 10 Sports Drink 22222 50 40 30 10 0 10 2013 2014 2015 2016 2017 2018 2019 2020 Annual Sports Drink Consumption Gallons 20 38 4 39 7 40 9 41 1 39 9 43 4 39 5 39 6 y 0 2975x 15 317 R 0 0192 30 Soda Years 40 Annual Sports Drink Consumption Gallons Linear Annual Sports Drink Consumption Gallons 50 60 Soda Gallons 588888 60 50 40 10 0 1970 Annual Soda Consumption Gallons oo 1980 1990 y 0 1173x 190 98 R 0 108 2000 Year 2010 2020 Annual Soda Consumption Gallons Linear Annual Soda Consumption Gallons 2030

Statistics
StatisticsThe test statistic of z 1 84 is obtained when testing the claim that p 0 35 a Using a significance level of 0 01 find the critical value s b Should we reject Ho or should we fail to reject Ho Click here to view page 1 of the standard normal distribution table Click here to view page 2 of the standard normal distribution table M a The critical value s is are z Round to two decimal places as needed Use a comma to separate answers as needed

Statistics
StatisticsDetermine 20 27 47 40 42 40 22 3 44 17 if there are outliers in the data set State the outliers if they exist


Statistics
ProbabilityDetermine if there are outliers in the data set State the outliers if they exist 709 699 700 830 697 685 10 517 612 214

Statistics
Statistics19 The information in the following table shows the amount of sales and the profit from a small retail business in Whitby Ontario for the last 15 years The years have not been provided as you will only need the amounts Sales thousands 195 205 225 240 255 300 265 345 295 335 380 405 355 390 410 Profit thousands 10 15 22 10 25 39 24 55 32 37 48 55 50 48 55 a Enter the data from the table into a spreadsheet program Include the headings for the two columns 3 marks b Sort the data from smallest to largest in the sales column 2 marks c In an empty cell below the profit column show the sum of the profit column 1 mark

Statistics
StatisticsWages Utilities Depreciation Total Machining Department Monthly Production Budget 244 000 The actual amount spent and the actual units produced in the first thr Amount Spent Units Produced 231 000 223 000 213 000 May June July Additional budget information for the Machining Department is as follows Wages per hour 14 00 Utility cost per direct labor hour 1 30 Direct labor hours per unit 0 25 56 000 Planned monthly unit production Total Units of production 51 000 47 000 42 000 I Question Content Area a Prepare a flexible budget for the actual units produced for May June and July in the Machining Department Assume depreciation is a fixed cost If required use per unit amounts carried out to two decimal p Hagerstown Company KH Machining Department Budget For the Three Months Ending July 31 June May 195 000 18 000 31 000 Select Select Select 51 000 months in the Machining Department were as follows Select Select Select 47 000 F fill in the blank fill in the blank d9ea6d023fb9fbe 13 d9ea6d023fb9fbe 14 July Select Select ct 42 000 sfill in the blank d9ea6d023fb9fbe 15

Statistics
StatisticsWages Utilities 195 000 18 000 31 000 244 000 The actual amount spent and the actual units produced in the first three months in the Machining Department were as Amount Spent Units Produced Depreciation Total Monthly Production Budget May June July 231 000 223 000 213 000 Additional budget information for the Machining Department is as follows Wages per hour 51 000 47 000 42 000 Utility cost per direct labor hour Direct labor hours per unit Planned monthly unit production 14 00 1 30 0 25 56 000 Question Content Area a Prepare a flexible budget for the actual units produced for May June and July in the Machining Department Ass a fixed cost If required use per unit amounts carried out to two decimal places Hagerstown Company Machining Department Budget For the Three Months Ending July 31 May June July 42

Statistics
ProbabilityHo 1 0 OH H1 H 0 Ho Hi Hyo H H H O At 0 10 can it be concluded that the mean of the Eastern Conference is higher than the mean on the Western Conference based on these data a Which are the null and alternative hypotheses 10 12 Only need help with part c d and G M H 1 00 22 Eastern Conference X b What are the sample means and sample standard deviations Round each to 2 decimal places 65 73 1 20 Western Conference 77 59 72 58 37 57 66 55 61 X 83 60 75 58 78 59 70 58 62 61 59 211 38 c What is the test statistic Round to 2 decimal places 0 1225 e Which is the decision d What is the p value Round to 4 decimal places Fall to reject the null hypothesis Reject the null hypothesis f What is the reasoning for the decision There is enough evidence to conclude that the mean of the Eastern Conference is more than the mean of the Western Conference highest scorers There is not enough evidence to conclude that the mean of the Eastern Conference is more than the mean of the Western Conference highest scorers There is enough evidence to conclude that the mean of the Eastern Conference is the same as the mean of the Western Conference highest scorers There is not enough evidence to conclude that the mean of the Eastern Conference is the same as the mean of the Western Conference highest t

Statistics
StatisticsAt a 0 10 can it be concluded that the mean of the Eastern Conference is higher than the mean on the Western Conference based on these data a which are the null and alternative hypotheses H i Hy Hy qu n O H H H O Ho 0 0 Hy Ho P H 0 H H1 H O 7 Mo Hi Hy D 11 1 0 2105 73 10 12 1 20 b What are the sample means and sample standard deviations Round each to 2 decimal places 80 22 2 Western Conference 77 59 72 58 37 57 66 55 61 X 211 38 c What is the test statistic Round to 2 decimal places 0 1225 Just need help with part g e Which is the decision d What is the p value Round to 4 decimal places Fail to reject the null hypothesis O Reject the null hypothesis f What is the reasoning for the decision There is enough evidence to conclude that the mean of the Eastern Conference is more than the mean of the Western Conference highest scorers There is not enough evidence to conclude that the mean of the Eastem Conference is more than t mean of the Western Conference highest scorers

Statistics
StatisticsAt a recent PGA tournament the Honda Classic at Palm Beach Gardens Florida the following scores were posted for eight randomly selected golfers for two consecutive days Thursday and Friday 4 5 6 7 Golfer Thursday X Friday X ID Hoi Hi Hz 0 H H1 H O Ho X 0 H XD 0 Ho Xo 0 H X 0 65 68 68 70 69 70 70 69 71 72 69 70 70 At a 0 05 is there statistically significant evidence of an increase of scores from Thursday to Friday To find differences take Thursday s score minus Friday s score For instance the difference for Golfer 1 is 1 Golfer 2 is 5 and Golfer 7 is 1 Note that an increase in score causes a negative difference a Which are the null and alternative hypotheses SD 1 Ho XD 0 H X O 67 68 2 3 68 b What are the mean of differences and standard deviation of differences c What is the test statistic Round to 2 decimal places 8 d What is the p value Round to 4 decimal places

Statistics
StatisticsThe following data are accumulated by Watershed Inc in evaluating two competing capital investment proposals Project A Project Z Amount of investment Useful life Estimated residual value Estimated total income over the useful life 2 160 Determine the expected average rate of return for each project Round your answers to one decimal place Project A Project Z 24 000 4 years 0 4 28 000 5 years 0 5 250

Statistics
ProbabilityThe Bureau of the Census reports the average commuting time for citizens of both Baltimore Maryland and Miami Florida To see if their commuting times appear to be any different in the winter random samples of drivers were surveyed in each city and the average commuting time for the month of January was calculated for both cities The results are provided below Sample size Sample mean min Population Standard Deviation Hoi HH2 ng i O O H1 H1 H 0 Hoi Hn Hz 0 O H1 H1 H 0 At the 0 06 level of significance can it be concluded that the commuting times are different in the winter a Which are the null and alternative hypotheses Ho H1 H2 0 H H1 H O Hoi Hi H2 0 OH H1 H 0 Miami X 4 40 31 2 7 2 b What is the test statistic Round to 2 decimal places c What is the p value Round to 4 decimal places Baltimore X 35 28 5 9 1

Statistics
StatisticsA survey found that in a sample of 100 families 30 owned dogs X1 Another survey done 15 years ago found that in a sample of 60 families 30 owned dogs X At a 0 10 level of significance has the proportion of dog owners changed over the 15 year period a Which are the null and alternative hypotheses O O O Ho P1 P2 0 H P1 P2 SO Ho P1 P2 0 H1 P1 P2 0 Ho P1 P2 0 H1 P1 P2 0 Ho P1 P2 0 H P1 P2 0 b What is the test statistic Round to 2 decimal places c What is the p value Round to 4 decimal places d Which is the decision Reject the null hypothesis Fail to reject the null hypothesis e What is the reasoning for the decision We accept the claim that the proportion of dog owners changed over the 15 year period There is not enough evidence to support the claim that the proportion of dog owners changed over the 15 year period There is enough evidence to support the claim that the proportion of dog owners changed over the 15 year period We know that the proportion of dog owners changed over the 15 year period Find the 96 intena Pound to 2 decimal places

Statistics
StatisticsDallas Texas and Stafford Texas are numbered 57 and 58 on the top 100 most diverse cities in the U S A random sample of 300 residents from each city were surveyed The results are listed below O Ho P1 P2 0 H P1 P20 At the 0 01 level of significance is there enough evidence to conclude that Dallas has a higher proportion of non white residents than Stafford a Which are the null and alternative hypotheses O Ho P1 P2 0 H P1 P2 0 Ho P1 P2 0 H P1 P2 So Dallas X Stafford X Ho P1 P2 0 H P1 P2 0 201 of 300 surveyed were non white 180 of 300 surveyed were non white b What is the test statistic Round to 2 decimal places c What is the p value Round to 4 decimal places

Statistics
StatisticsThe mean speeds of fastball pitches from two different baseball pitchers are to be compared A sample of 14 pitches are measured from each and the populations have normal distributions Scouts believe that Rodriguez has a faster pitch on average Pitcher Wesley X Rodriguez X Ho Hi Hz 0 O H1 H1 H 0 Hoi Hi H2 0 H1 H1 H 0 At the 0 01 level of significance is there enough evidence that on average Rodriquez has the faster pitch a Which are the null and alternative hypotheses Hoi Hi Hy ng n O H1 H1 H 0 Hoi H Hz 0 H1 H1 H 0 Sample Mean Speed Population Standard mph 86 91 b What is the test statistic Round to 2 decimal places c What the p value Round to 4 decimal places at the d Which is the decision Reject the null hypothesis O Fail to reject the null hypothesis Deviation 3 7

Statistics
StatisticsIn a sample of 80 Americans 55 think that life is better for the rich In a sample of 90 Europeans 42 think that life is better for the rich a Find the 99 confidence interval for the difference of the two proportions Round to 2 decimal places

Statistics
Statistics10 Identify the population in each of the following data collection scenarios 2 marks a A school wants to know what type of music to play at the next Grade 8 dance b The Ministry of Education wants to know how people feel about the ILC course they have taken

Statistics
Probability9 Given the graph of the distribution of fouls received by each player on a basketball team Frequency 1 2 3 4 5 3 5 53 3 2 5 52 2 1 6 0 5 2 3 3 0 2 Distibution of Fouls 3 Number of Fouls a Determine if the distribution represents one or two variable data 1 mark b Formulate two questions about the set of data 2 marks 5

Statistics
StatisticsThe figure below shows the residual plot for a data set Residuals 6 3 0 3 6 2 4 6 8 10 Which statement is true O A A random pattern of the residual plot supports a linear model B A random pattern of the residual plot supports a nonlinear model Y e The data set is linear because the sum of the residuals is greater than zero D The data set is nonlinear because the sum of the residuals is greater than zero

Statistics
Statistics8 Your maximum heart rate depends on your age These data were collected from a sports journal Age years x 20 25 30 Maximum heart rate beats min y 206 200 194 a Draw a scatter plot of the data Find the equation of the line of best fit 3 marks b Determine the correlation coefficient How well does the line fit the data 3 marks c Use the equation to give a prediction of the maximum heart rate for a person of 23 years 1 mark

Statistics
StatisticsA survey is taken among customers of a fast food restaurant to determine their preference for hamburger or chicken Of 200 respondents selected 75 were children and 125 were adults 120 preferred hamburger and 80 preferred chicken 55 of the children preferred hamburger From this we can conclude that the events being an adult and prefers hamburger exhaust the sample space the events being an adult and prefers hamburger are dependent the events being an adult and prefers hamburger are disjoint the events being an adult and prefers hamburger are independent

Statistics
StatisticsThe following is a boxplot of population with age on X axis for a country 0 17 33 50 104 What can we infer from this plot There are more children age 17 and under than senior citizens age 65 and over There are more number of people aged 33 years or younger than 33 years or older O Average age of the population is 33 5 years The distribution is bell shaped

Statistics
StatisticsSuppose you want to test Ho 30 versus H 30 Which of the following possible sample results based on a sample of size 36 gives the strongest evidence to reject Ho in favor of H Hint Calculate test statistics OX 28 Sx 6 OX 27 Sx 4 OX 32 Sx 2 OX 26 Sx 9

Statistics
StatisticsThere are more than 400 students in a biology class The average score on midterm 1 was 68 and standard deviation is 10 The distribution of scores is unknown What proportion of students in the class have scores between 53 and 83 Hint use Chebyshev s Inequality At most 0 556 0 556 At least 0 556 At least 0 444

Statistics
StatisticsSuppose you want to test the following Null hypothesis Population mean 10 Alternative Hypothesis Population mean 10 Population is normally distributed and population standard deviation is known The computed statistic value is 0 92 What is the p value Cannot be computed because sample mean and standard deviation are not given 0 1788 1 0 1788 0 1788 0 1788 1 405 1 405

Statistics
ProbabilityIn a large state 5 individuals are infected with Corona virus Suppose a particular test used for detecting the corona virus detects the virus 93 of the time i e if someone has corona virus the test detects it 93 of the time the remaining 7 of the time the test gives false negative But the test also gives a false positive 3 of the time Suppose a randomly selected individual tests positive for the Corona virus Given this test result what is the probability that the individual is actually infected with corona virus 0 075 0 21 0 93 03 7 0 62 0 90 0 58

Statistics
StatisticsIt is known that distribution of wheat yields is skewed to the right with a population standard deviation of 4 bushels A sample of 64 wheat farms is taken and their yields are noted What distribution would you use to test the hypothesis that population wheat yield is 39 bushels Hypothesis testing cannot be done because population mean is unknown Standard Normal Distribution t distribution

Statistics
StatisticsA manufacturer of flashlight batteries took a sample of 130 batteries from a day s production and used them continuously until they were drained The number of hours until failure was recorded Given below is the boxplot of the number of hours it took to drain each of the 130 batteries Hours 260 460 Boxplot symmetrical 660 Normal Bell shaped right skewed left skewed 860 The distribution of the number of hours is 1060
Statistics
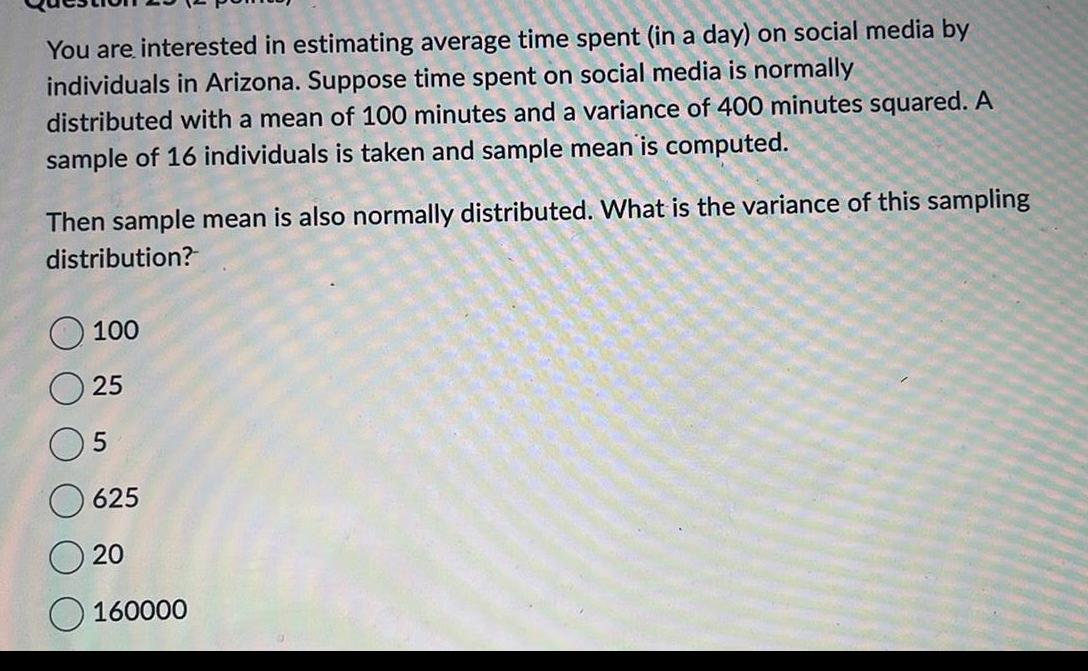
StatisticsYou are interested in estimating average time spent in a day on social media by individuals in Arizona Suppose time spent on social media is normally distributed with a mean of 100 minutes and a variance of 400 minutes squared A sample of 16 individuals is taken and sample mean is computed Then sample mean is also normally distributed What is the variance of this sampling distribution 100 25 625 20 160000

Statistics
ProbabilityAmong a group of twenty students eight have been to Mexico and six have been to Canada Three students have been to both countries What is the probability that a student from this group went to Mexico or Canada O 8 8 8 07 O 0

Statistics
StatisticsThe diameter of mandarin oranges on John s orchard follow a normal distribution with a mean of 6 cms and a standard deviation of 1 2 cms A machine on the farm sorts oranges by diameter and the largest in terms of diameter 20 of oranges are selected for export market How big an orange should be to qualify for the export market diameter of 1 014 cms or more diameter of 7 014 cms or more diameter of 7014 cms or less

Statistics
Probability3 Using the Table Below find the following Probabilities All of these people are in a room together and you randomly pick one person in the room via lottery Male Female Firefighter 9 8 Policemen 14 5 EMT 3 11 a What is the probability that the randomly chosen person is a female EMT b What is the probability that the chosen person is a Firefighter c What is the probability that the chosen person is either a male or a Policemen

Statistics
Probability1 If I have 3 types of Bread Wheat Rye and White 2 types of Proteins Chicken and Beef and 2 types of cheese American and Swiss Draw a graph that depicts all the unique sandwiches can you make

Statistics
Probability2 You Flip 3 fair coins a What is the Probability that all coins will land on heads b What is the Probability that 2 of the coins are heads and one is tai Think carefully
Statistics
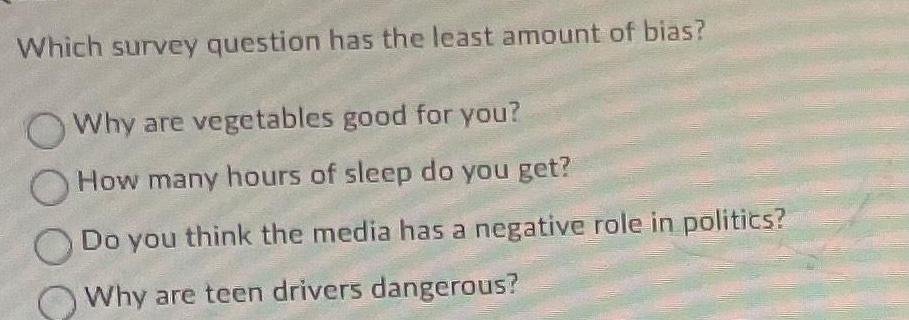
ProbabilityWhich survey question has the least amount of bias Why are vegetables good for you How many hours of sleep do you get Do you think the media has a negative role in politics Why are teen drivers dangerous

Statistics
StatisticsIdentify the following data set the rates at which all of the cashiers scan products for a store on a study about the cashiers for the day Population Sample

Statistics
ProbabilityWatch help video At a customer service call center for a large company the number of calls received per hour is normally distributed with a mean of 180 calls and a standard deviation of 15 calls What is the probability that during a given hour of the day there will be between 143 calls and 185 calls to the nearest thousandth

Statistics
StatisticsQuiz 10 S P 1 a Prepare a scatter plot of the following table Distance traveled Time increased 10 15 25 1 2 3 30 c What is the correlation if any d What type of correlation is it 4 35 5 50 6 b Draw a line or curve of best fit and determine the line s curve s equation 55 7 Name Hr

Statistics
Statistics3 Rodney is working on a project for his master s thesis involving the affect of a lack of sleep on information retention and test scores He gave comparable exams to two groups of students Group A was well rested throughout the week leading up to the assessment Group B was only allowed to average 4 5hrs of sleep per night leading up to the assessment The results appear in the table below Group A 56 78 90 92 64 85 79 92 88 97 86 78 89 94 99 Group B 43 87 55 33 21 25 57 73 35 66 15 47 26 23 18 a Create a double sided stem and leaf plot for the given data b Determine the C T s range and skew for each group c What can he conclude from his findings

Statistics
StatisticsFor the following scatter plots determine the correlation if any If there is a correlation draw a line or curve of best fit and identify the type of correlation 4 8 9 5 Identify the following as a form of either discrete data D or continuous data C The number of students in a class 10 6 Number of languages an individual speaks 6 The amount of time required to complete a project 7

Statistics
Probability11 10 points A person makes monthly deposits of 100 at the end of each month for 40 years The annual interest rate is 5 How much money will she have at the end of 40 years for retirement Give your answer to the nearest dollar

Statistics
ProbabilityUnit 7 Quiz 2 Review 1 Is the distribution a valid probability distribution Write yes or no 3 Number LARGE ZADE Probability a b 1 2 A die is loaded in such a way that the probabilities of getting 1 2 3 4 5 and 6 are 1 12 1 6 1 3 6 1 12 and 1 6 respectively Fill in the probability distribution 3 Name 4 X 5 1 2 3 4 5 P X 0 11 0 25 0 4 0 13 0 31 What is the probability that a 2 or greater is shown on the loaded die 6 What is the probability that a number less than 4 is shown on the loaded die 4 You roll a 12 sided die with numbers 1 12 What is the probability of rolling an odd number You roll a 12 sided die with numbers 1 12 What is the probability of rolling a number no more than 6 You roll a 12 sided die with numbers 1 12 What is the probability of rolling a number greater than 2 Unit 7 Quiz 2 Review Name 7 A player tosses two coins into the air He wins 1 dollar for the number of heads he will get However he will lose 5 dollars if neither coin is a head Calculate the expected value of this game and determine whether it is favorable for the player 8 You are at the fair playing a game where a ball is randomly hidden under one of 3 cups It costs 4 to play If you choose the cup with the ball under it you win back your money plus an additional 5 What is the expected value of this game 9 Sandra is playing a game There are 8 marbles in a bag 1 purple and 7 orange If she chooses the purple marble she will win 40 If she chooses the orange marble she will win 4 What is the expected value of Sandra s winnings from the game 10 An agent sells life insurance policies to six equally aged healthy people According to recent data the probability of a person living in these conditions for 30 years or more is 70 Is this a binomial experiment List all reasons why it is

Statistics
Statistics12 What is the equation that best models the data from the table after the data has been linearized 1 point x 2 4 6 8 10 12 14 16 18 20 y 3 09 3 48 4 16 4 72 5 40 5 97 6 95 7 41 9 23 10 45 Ology 0 116315x 0249114 Ology 0 249114x 0 116315 Ology 0 0288761x 0 435269 Ology 0 435269x 0 0288761

Statistics
StatisticsShow what happens in the short run on the graph if the policy moves the economy too far and the economy reaches higher than full employment Price level Real GDP LRAS SRAS AD

Statistics
Statistics1 This is a template to use for hypothetical budgets Fill this out based on your own expenses or projected expenses but all the scenarios assume that you are making 500 a month in income 2 Complete the column titled Scenario 1 Debt with as much expense as you would like in each category You need to spend more than 500 If you think of additional expenses beyond those listed on the organizer you can add them below Books Magazines on the chart 3 Then add up your expenses and subtract them from the income figure of 500 The expenses should be higher than 500 so the total will be negative This means you have gone into debt and the debt figure should go in the Debt row 4 Next fill out the column titled Scenario 2 Break Even The goal here is to spend exactly 500 This means that you will have to lower your expenses in certain areas from the Debt column 5 You will add up your expenses to confirm that your expense and income totals are equal You will then have no savings or debt so a 0 should go in the Debt and Savings rows 6 Then Complete the column titled Scenario 3 Savings The goal with this column is to lower your costs below those of the Break even Scenario in order to have savings 7 You will add up your expenses and subtract the total from the income figure of 500 This figure should go in the Savings row 8 Respond to the reflection question after you are done Monthly Budget Monthly Income Monthly Expenses School Supplies Cell Phone Clothes Accessories Transportation Restaurant Snacks Movies Concerts Sports Video Games Books Magazines Donations to Charity Other Other Total Expenses Scenario 1 Debt 10pts 500 Scenario 2 Break Even 10pts 500 Scenario 3 Savings 10 pts 500 Savings Debt 10pts Reflection How were you able to achieve savings How have you set your spending priorities in order to lower some expenses and