Statistics Questions
The best high school and college tutors are just a click away, 24×7! Pick a subject, ask a question, and get a detailed, handwritten solution personalized for you in minutes. We cover Math, Physics, Chemistry & Biology.

Statistics
StatisticsDo men score the same on average compared to women on their statistics finals Final exam scores of eleven randomly selected male statistics students and thirteen randomly selected female statistics students are shown below Male 91 78 93 89 83 82 91 78 79 71 64 Female 93 82 76 87 89 64 78 67 65 99 99 93 99 Assume both follow a Normal level of significance For this study we should use Select an answer a The null and alternative hypotheses would be Ho Select an answer H Select an answer distribution What can be concluded at the the o 0 01 level of significance Select an answer Select an answer C b The test statistic c The p value d The p value is a e Based on this we should f Thus the final conclusion is that please enter a decimal Select an answer Please enter a decimal Select an answer please show your answer to 3 decimal places Please show your answer to 4 decimal places Select an answer the null hypothesis The results are statistically significant at a 0 01 so there is sufficient evidence to conclude that the population mean statistics final exam score for men is not the same as the population mean statistics final exam score for women The results are statistically significant at a 0 01 so there is sufficient evidence to conclude that the mean final exam score for the eleven men that were observed is not the same as the mean final exam score for the thirteen women that were observed The results are statistically insignificant at a 0 01 so there is insufficient evidence to conclude that the population mean statistics final exam score for men is not the same as the population mean statistics final exam score for women The results are statistically insignificant at a 0 01 so there is statistically significant evidence to conclude that the population mean statistics final exam score for men is equal to the population mean statistics final exam score for women

Statistics
StatisticsThe medical researcher is comparing two treatments for lowering cholesterol diet and meds The researcher wants to see if the patients who receive the recommendation to change their diet have less success lowering cholesterol compared to a prescription of meds A random sample of some patients who received the recommendation to change their diet and others who were prescribed meds was taken The results of how many did or did not lower their cholesterol are shown below Ho What can be concluded at the 0 10 level of significance For this study we should use Select an answer a The null and alternative hypotheses would be Hi Select an answer C Select an answer Select an answer Data on Diet vs Meds for Weight Loss Diet Select an answer Yes 391 No 228 b The test statistic c The p value d The p value is Q e Based on this we should f Thus the final conclusion is that Meds 601 284 Select an answer please enter a decimal Please enter a decimal Select an answer please show your answer to 3 decimal places Please show your answer to 4 decimal places Select an answer the null hypothesis The results are statistically significant at a 0 10 so there is sufficient evidence to conclude that the population of all patients who received the recommendation to change their diet is less likely to lower their cholesterol than the population of patients who are prescribed meds The results are statistically insignificant at a 0 10 so we can conclude that the success rate for all patients who receive the recommendation to change their diet is equal to the success rate for all patients who are prescribed meds The results are statistically insignificant at a 0 10 so there is insufficient evidence to conclude that the population of all patients who received the recommendation to change their diet is less likely to lower their cholesterol than the population of patients who are prescribed meds

Statistics
StatisticsAre job applicants with easy to pronounce last names just as likely to get called for an interview than applicants with difficult to pronounce last names 578 job applications were sent out with last names that are easy to pronounce and 797 identical job applications were sent out with names that were difficult to pronounce 355 of the applicants with easy to pronounce names were called for an interview while 454 of the applicants with difficult to pronounce names were called for an interview What can be concluded at the 0 01 level of significance For this study we should use Select an answer a The null and alternative hypotheses would be Ho Select an answer H Select an answer Select an answer Select an answer b The test statistic c The p value d The p value is a e Based on this we should f Thus the final conclusion is that Select an answer Select an answer please enter a decimal Please enter a decimal please show your answer to 3 decimal places Please show your answer to 4 decimal places Select an answer the null hypothesis The results are statistically insignificant at a 0 01 so there is insufficient evidence to conclude that among all possible applicants there is a differnece in the population proportion of callbacks for applicants with easy to pronounce last names and applicants with difficult to pronounce names The results are statistically insignificant at a 0 01 so we can conclude that the population proportion of people with easy to pronounce names who get called for an interview is equal to the population proportion of people with difficult to pronounce names who get called for an interview The results are statistically significant at a 0 01 so there is sufficient evidence to conclude that among all possible applicants there is a differnece in the population proportion of callbacks for applicants with easy to pronounce last names and applicants with difficult to pronounce names The results are statistically significant at a 0 01 so there is sufficient evidence to conclude that the proportion of the 578 applicants with easy to pronounce names who got called for an interview is not the same as the proportion of the 797 applicants with difficult to pronounce

Statistics
Probabilitya A computer randomly chooses a customer s phone number and a customer service rep calls to survey the customer b Customers are grouped by their zip code A few people for each zip code are surveyed QUESTION 18 Mike s pizza company is searching for a new specialty pizza to add to their menu Five specialty pizzas are on the ballot and the cashier polls every 20th customer that orders a pizza What type of sampling methe Cluster Sampling Convenience Sampling Stratified Random Sampling O Systematic Sampling QUESTION 19 A farmer is researching the effectiveness of a pest control spray He divides his orchard into 5 sections He then inspects all the trees within 2 of those sections What type of sampling method is he using

Statistics
Statisticsent 5 A computer is used to randomly select a number between 1 and 7000 Event A is selecting the number 875 6 A computer is used to randomly select a number between 1 and 6500 Event B is selecting a number less than 550 7 You randomly select one card from a standard deck Event C is selecting a Jack For each of the following count the number of outcomes possible Event 8 A bank is hiring for two positions a teller and a manager How many ways can these positions be filled if there are 19 people applying for the teller position and 5 people applying for the manager position 9 A menu has five choices for appetizers twelve for main dishes and four for desserts How many different meal combinations are available if you select an appetizer a main and a dessert of Outcomes 10 The access code for a vault consists of four digits The first digit must be even and the last digit cannot be a zero How many possible Work it out here Simple Answer

Statistics
StatisticsJason just got his progress report Based solely on data points which measure of central tendency should be used based on the following grades 99 85 16 60 88 85 88 90 Mean Median Mode Range

Statistics
StatisticsThe following shows a list of a student s homework grades for a grading period 80 90 84 86 95 Which center should be used to best represent the data The mean grade is 87 The median trade is 86 The mode of the grades is 80 The range of the grades is 15 LOVE

Statistics
Statistics13 Employees at a certain company were asked how long they had been employed for that company The frequency table of the results is shown below No of Employees Relative frequency 5 10 25 10 5 3 Years Employed 1 5 6 10 11 15 16 20 21 25 26 30 a Complete the column of relative frequencies Show all work Round to 3 decimal places 6 pts b What percentage of employees have worked for the company for at least 21 years 3 pts

Statistics
StatisticsYou want to know if a chiropractor or an acupuncture treatment actually improves blood pressure Which method of data collection should you use Perform an Experiment Use a Simulation

Statistics
StatisticsA survey organization conducted telephone interviews in December 2008 in which 1009 randomly selected adults in the US responded to the question At the present time do you think television commercials are an effective way to promote a new product Of the 1009 adults surveyed 676 responded yes In December 2007 622 of 1020 randomly selected adults in the US had responded yes to the same question Suppose a hypothesis test is carried out to test the hypothesis that the proportion who would respond yes to the question changed from Dec 2007 to Dec 2008 Compute the appropriate sample proportions and compute the test statistic for this test 8 pts

Statistics
StatisticsIn a study about adult health in Gwinnett County which method of data collection would have the least amount of bias Surveying all the residents at 2 senior citizens facilities in Gwinnett one day Surveying everyone who just graduated from Phoenix High School this year Surveying every 3rd person leaving the a gym in Lawrenceville one day Surveying every resident in Lawrenceville Duluth and Suwanee

Statistics
StatisticsAccording to her doctor Mrs Hill s cholesterol level is higher than only 10 of the females aged 50 and over The cholesterol levels among females aged 50 and over are approximately normally distributed with a mg and a standard deviation of 20 mean of 240 mg What is Mrs Hill s dL dL cholesterol level Carry your intermediate computations to at least four decimal places Round your answer to one decimal place mg dL

Statistics
Statistics1 U S Population An arithmetic sequence is the discrete analog to a linear function Both an arithmetic sequence and a linear function assume a constant additive rate of change a According to the U S Census Bureau the official U S population was 248 7 million in 1990 and 308 7 million in 2010 What was the average change in population per year from 1990 through 2010 b The official U S population was 281 4 million in 2000 Let p be an arithmetic sequence that represents the U S population in millions of persons n years after 2000 Verify that p 281 4 This is the initial condition for your sequence c Use your answer from part a to write a recursive formula for the sequence p d Write an explicit formula for the arithmetic sequence p assuming that p 281 4 e Use the information from parts b c and d to estimate the U S population in 2010 2015 and 2020

Statistics
Statistics1 Michelle recorded the ages of members of her international dance troupe 18 23 56 38 24 25 45 22 21 18 19 35 28 44 57 36 34 25 26 18 20 29 30 41 21 30 24 18 27 22 19 27 22 19 20 33 23 44 20 19 25 21 19 32 26 20 34 26 25 19 21 42 33 28 Create a Stem and leaf plot for the data and determine the C T s range and skew Is the skew surprising Explain why or why not

Statistics
StatisticsShow your work Make sure you answer the questions completely 1 Michelle recorded the ages of members of her international dance troupe 18 23 56 38 24 25 45 22 21 18 19 35 28 44 57 36 34 25 26 18 20 29 30 41 21 30 24 18 27 22 19 27 22 19 20 33 23 44 20 19 25 21 19 32 26 20 34 26 25 19 21 42 33 28 Create a Stem and leaf plot for the data and determine the C T s range and skew Is the skew surprising Explain why or why not Name Hr 2 Create an appropriate properly labeled histogram for the da presented in 1 Include estimated C T s on the graph

Statistics
Probability3 Cole and Collin polled 1256 students at CassTech as to which video games were the best The results are shown in the pie chart to the right Fill out the table and determine the CTs and range Game COD SM 3D P REV M F Percent Frequency 4 What advantages are there to Stem Leaf plots Super Mario 3D Pokeman Call of Duty 85 100 32 73 30 40 Village Fortnite R E Minecraft

Statistics
Statistics1 point This is a list of things the average QM student uses each semester Here are the quantities and prices for these items in 1992 and 2022 Item 1992 Quantity 1992 Price 2022 Quantity 2022 Price Coffee Notebooks Pens Textbook 42 7 10 1 0 75 2 00 1 50 35 00 44 6 8 n a 2 50 4 00 3 50 n a Calculate the QM Student Price Index for 2022 1992 100 answer

Statistics
StatisticsCPI Problem 4 1 point This is a list of things the average QM student uses each semester Here are the quantities and prices for these items in 1992 and 2022 Item 1992 Quantity 1992 Price 2022 Quantity 2022 Price Coffee 45 7 10 1 Notebooks Pens Textbook 0 75 2 00 1 50 35 00 44 6 8 n a 2 50 4 00 3 50 n a Calculate the QM Student Price Index for 2022 1992 100 answer

Statistics
StatisticsIt is claimed that the average Canadian family spends 22 percent of their disposable income on food In a random sample of 960 families the mean proportion of disposable income spent on food was 21 percent Conduct the the hypothesis that P the proportion of disposable income spent on food is 22 percent against the alternative hypothesis that it is less than 22 percent Conduct a test using a 05 What is the value of the standard score standard score The final conclusion is A We can reject the null hypothesis that P 22 B There is not sufficient evidence to reject the null hypothesis that P 22 Note You can earn partial credit on this problem

Statistics
StatisticsTextbooks are expensive But do students in some Cegep programs spend more on their textbooks than students in other programs A sample of 491 students were asked how much they spent on textbooks for one semester The observed results of the study are found below Cost of Textbooks Science Nursing Communications Total less than 500 dollars 53 46 41 140 500 to 750 dollars 67 41 60 168 more than 750 dollars 59 55 69 183 Total 179 142 170 491 With this information construct a table of expected values Cost of Textbooks Science Nursing Communications less than 500 dollars 500 to 750 dollars more than 750 dollars Is there an association between program and cost of textbooks using a 0 01 x The critical value is x The final conclusion is A We can reject the null hypothesis that there is no association between program and cost of textbooks B There is not sufficient evidence to reject the null hypothesis that there is no association between program and cost of textbooks

Statistics
Statistics1 point Do males in Cegep spend more time doing paid work than females A sample of 722 students were asked how many hours per week they worked for pay The observed results of the study are found below Hours of Work Males Females Total 0 5 246 175 421 6 15 78 72 150 16 25 34 57 91 26 or more 25 35 60 Total 383 339 722 With this information construct a table of expected values Hours of Work Males Females 0 5 6 15 16 25 26 or more Is there an association between gender and hours of work for pay using a 0 01 x 0 The critical value is x The final conclusion is A There is not sufficient evidence to reject the null hypothesis that there is no association between gender and working

Statistics
StatisticsA QM student is trying to figure out if there is an association between the colour of the shirt he is wearing and whether the teacher assigns homework He collects data over 33 days The observed results of the study are found below Blue Brown Total Yes 7 7 14 No 7 12 19 Total 14 19 33 With this information construct a table of expected values Blue Brown Yes No Is there an association between shirt colour and homework using a 0 01 The critical value is x The final conclusion is A There is no association between shirt colour and whether the teacher assigns homework B There is probably an association between shirt colour and whether the teacher assigns homework

Statistics
Probability1 point This is a list of things the average Canadian family uses Here are the quantities and prices for these items in 2001 and 2022 Item Milk litres Toothpaste tubes Socks Netflix 2001 Quantity 2001 Price 2022 Quantity 2022 Price 420 1 25 400 1 95 13 2 00 11 3 25 12 2 50 13 3 50 n a n a 12 15 00 Calculate the Canadian Family Price Index for 2022 2001 100 answer

Statistics
StatisticsConfidenceStatements Problem 12 1 point A Sports Canada survey asked 1820 Canadian men between the ages of 18 and 35 if they play soccer at least once a week Use the given data to find the 95 confidence interval estimate of the population proportion p Assume that the population has a normal distribution Sample size n 1820 Sample proportion 21 percent 0 P 0 Note You can earn partial credit on this problem

Statistics
StatisticsConfidenceStatements Problem 7 1 point a In a sample of 750 Brossard residents 37 percent said that they had watched the Canadiens practice at the Bell Complex Calculate a 95 confidence interval for the proportion Brossard residents who have watched the Canadiens practice at the Bell Complex Confidence interval b Which of the following is the correct interpretation for your answer in part a A We can be 95 confident that the proportion Brossard residents in this sample who have watched the Canadiens practice at the Bell Complex lies in the interval OB We can be 95 confident that the proportion of Brossard residents who have watched the Canadiens practice at the Bell Complex lies in the interval C 95 of the population of Brossard residents have watched the Canadiens practice at the Bell Complex D None of the above

Statistics
ProbabilityCalculate the mode mean and median of the following data Mode Mean Median 30 26 32 24 27 30 30 34 Note You can earn partial credit on this problem

Statistics
StatisticsAt least one of the answers above is NOT correct 1 of the questions remains unanswered A O A We can reject the null hypothesis that 31 1 B There is not sufficient evidence to reject the null hypothesis that 31 1 Note You can earn partial credit on this problem incorrect A hospital wants to know the average wait time of patients at emergency In a random sample of 140 patients the mean wait time was 29 minutes with a standard deviation of 10 1 minutes Conduct the the hypothesis that the mean wait time in minutes is 31 1 minutes against the alternative hypothesis that it is less than 31 1 minutes Conduct the test using a 05 What is the value of the standard score standard score The final conclusion is correct

Statistics
StatisticsConfidenceStatements Problem 9 1 point Use the given confidence interval limits to find the point estimate p and the margin of error E 0 75 p 0 87 p E Note You can earn partial credit on this problem


Statistics
StatisticsConfidenceStatements Problem 6 1 point a In a sample of 400 Sherbrooke pet owners 64 percent had dogs Calculate a 95 confidence interval for the proportion of dog owners in Sherbrooke Confidence interval b Which of the following is the correct interpretation for your answer in part a A We can be 95 confident that the proportion of dog owners in this sample lies in the interval B We can be 95 confident that the proportion of dog owners in Sherbrooke lies in the interval C 95 of people in Sherbrooke own dogs D None of the above Note You can earn partial credit on this problem

Statistics
Statistics1 point idenceStatements Problem 10 A public opinion research firm conducted a survey on the mean number of music downloads per month Use the given data to find the 95 confidence interval estimate of the population mean Assume that the population has a normal distribution Sample size n 855 Mean 43 Standard deviation s 8 Note You

Statistics
StatisticsConfidenceStatements Problem 8 1 point a For 500 randomly selected households the mean time spent eating dinner together is 4 5 hours per week with a standard deviation of 1 3 hours Calculate a 95 confidence interval for the mean time spent eating dinner together Confidence interval b Which of the following is the correct interpretation for your answer in part a A 95 of this sample of 500 spent time eating dinner together B We can be 95 confident that the mean time spent eating dinner together lies in the interval C None of the above

Statistics
Statistics1 point ements Probler A public opinion research firm conducted a survey on the proportion of Montrealers who eat at a restaurant at least once a week Use the given data to find the 95 confidence interval estimate of the population proportion p Assume that the population has a normal distribution Sample size n 585 Sample proportion 48 percent Nat

Statistics
StatisticsConfidenceStatements Problem 5 1 point a Fifty randomly selected commuters were asked how long they had to wait for the bus that morning The mean of their answers was 6 minutes with a standard deviation of 0 63 minutes Calculate a 95 confidence interval for the mean wait time for all commuters Confidence interval b Which of the following is the correct interpretation for your answer in part a A We can be 95 confident that the mean wait time for this sample of 50 lies in the interval OB 95 of the mean wait times lie in the interval C We can be 95 confident that the mean wait time lies in the interval OD None of the above

Statistics
ProbabilityAt least one of the answers above is NOT correct Consider the following data set Below is a partially completed stem and leaf diagram for this data set 41 36 39 14 54 15 51 39 25 52 38 12 49 27 12 20 25 25 Note In order to get credit for this problem all answers must be correct Depuis 150 Determine the correct values for the missing entries and fill them in If no value is needed for a given entry then enter X Submit Answers L 3 19

Statistics
StatisticsHypothesisTests Problem 10 It is claimed that the average Canadian family spends 22 percent of their disposable income on food In a random sample of 960 families the mean proportion of disposable income spent on food was 21 percent Conduct the the hypothesis that P the proportion of disposable income spent on food is 22 percent against the alternative hypothesis that it is less than 22 percent Conduct a test using a 05 What is the value of the standard score 1 point standard score The final conclusion is A We can reject the null hypothesis that P 22 B There is not sufficient evidence to reject the null hypothesis that P 22

Statistics
Probability1 point I bought my first car in 1992 for 4100 dollars In 2018 my daughter bought her first car for 5500 dollars What was the equivalent value of her car in 1992 dollars The CPI in 1992 was 86 3 and the CPI in 2018 was 133 4 Answer

Statistics
StatisticsHypothesisTests Problem 9 1 point A hospital wants to know the average wait time of patients at emergency In a random sample of 140 patients the mean wait time was 29 minutes with a standard deviation of 10 1 minutes Conduct the the hypothesis that the mean wait time in minutes is 31 1 minutes against the alternative hypothesis that it is less than 31 1 minutes Conduct the test using a 05 What is the value of the standard score standard score The final conclusion is OA We can reject the null hypothesis that 31 1 OB There is not sufficient evidence to reject the null hypothesis that 31 1

Statistics
StatisticsCPI Problem 1 1 point Last year I bought a new lawnmower for 250 dollars What was the equivalent value in 2002 dollars The CPI in 2002 was 100 0 and the CPI in 2022 was 151 2 Answer

Statistics
Statistics1 point A researcher wants to test the claim that Cegep students spend 19 6 hours in paid employment each week In a random sample of 110 students the mean time spent working each week was 21 hours with a standard deviation of 10 6 hours Test the claim that Cegep students spend 19 6 hours per week in paid employment The alternative hypothesis is that students spend more than 19 6 hours per week in paid employment Conduct the test using a 05 What is the value of the standard score standard score The P Value is The final conclusion is A We can reject the null hypothesis that 19 6 B There is not sufficient evidence to reject the null hypothesis that 19 6

Statistics
Statistics1 point It is claimed that 20 to 24 year olds in Canada spend an average of 945 hours per year on Instagram In a random sample of 1000 Quebeckers 20 to 24 years old the average time spent on Instagram was 950 hours per year with a standard deviation of 100 hours Test the hypothesis that 20 to 24 year olds in Quebec spend more time on Instagram than the average Canadian 20 to 24 year old Conduct the test using a 05 What is the value of the standard score standard score The P Value is The final conclusion is A We can reject the null hypothesis that 945 20 to 24 year olds in Quebec probably spend more time on Instagram than 20 to 24 year old Canadians B There is not sufficient evidence to reject the null hypothesis that 945 20 to 24 year olds in Quebec probably do not spend more time on Instagram than 20 to 24 year old Canadians Note You can earn partial credit on this ra le v re y aller ure

Statistics
StatisticsDo left handed starting pitchers pitch fewer innings per game on average than right handed starting pitchers A researcher looked at nine randomly selected left handed starting pitchers games and nine randomly selected right handed pitchers games The table below shows the results Left 7 6 7 6 6 66 67 Right 78 6 8 7 6 7 7 6 Assume that both populations follow a normal distribution What can be concluded at the the a 0 01 level of significance level of significance For this study we should use Select an answer a The null and alternative hypotheses would be Ho Select an answer H Select an answer Select an answer Select an answer Select an answer Select an answer please enter a decimal Please enter a decimal b The test statistic c The p value d The p value is a e Based on this we should Select an answer the null hypothesis f Thus the final conclusion is that please show your answer to 3 decimal places Please show your answer to 4 decimal places The results are statistically insignificant at a 0 01 so there is insufficient evidence to conclude that the population mean innings per game for left handed starting pitchers is less than the population mean innings per game for right handed starting pitchers The results are statistically insignificant at a 0 01 so there is statistically significant evidence to conclude that the population mean innings per game for left handed starting pitchers is equal to the population mean innings per game for right handed starting pitchers The results are statistically significant at a 0 01 so there is sufficient evidence to conclude that the population mean innings per game for left handed starting pitchers is less than the population mean innings per game for right handed starting pitchers The results are statistically significant at a 0 01 so there is sufficient evidence to conclude that the mean innings per game for the nine left handed starting pitchers that were looked at is less than the mean innings per game for the nine right handed starting pitchers that were looked at

Statistics
StatisticsSOAP2DAY SOAP2DAY O Information air The director of student services at Oxnard College is interested in whether women are less likely to attend orientation than men before they begin their coursework A random sample of freshmen at Oxnard College were asked what their gender is and whether they attended orientation The results of the survey are shown below Select an answer Data for Gender vs Orientation Attendance What can be concluded at the a 0 10 level of significance For this study we should use Select an answer Select an answer Women Men 466 296 a The null and alternative hypotheses would be b The test statistic c The p value d The p value is a e Based on this we should f Thus the final conclusion is that Yes 359 No 268 Select an answer Ho Select an answer Select an answer and 1 represent the proportion and mean for women and p2 and men H Quiz Chapter 10 please enter a decimal and note that p1 2 represent the proportion and mean for Select an answer Please enter a decimal please show your answer to 3 decimal places Please show your answer to 4 decimal places MMyOpenMath Select an answer the null hypothesis The results are statistically insignificant at a 0 10 so there is insufficient evidence to conclude that the population proportion of freshmen women at Oxnard College who attend orientation is less than the population proportion of freshmen men at Oxnard College who attend orientation The results are statistically significant at a 0 10 so there is sufficient evidence to conclude that the population proportion of freshmen women at Oxnard College who attend orientation is less than the population proportion of freshmen men at Oxnard College who attend orientation The results are statistically significant at a 0 10 so there is sufficient evidence to conclude that the proportion of the 627 freshmen women who attended orientation is less than the proportion of the 762 freshmen men who attended orientation

Statistics
StatisticsA retailer wants to see if a red Sale sign brings in more revenue than the same Sale sign in blue The data below shows the revenue in thousands of dollars that was achieved for various days when the retailer decided to put the red Sale sign up and days when the retailer decided to put the blue Sale sign up Red 2 8 2 1 2 7 2 5 2 7 3 5 2 7 2 3 8 Blue 2 4 2 5 3 3 1 3 4 3 2 8 3 3 2 3 1 6 Assume that both populations follow a normal distribution What can be concluded at the a 0 01 level of significance level of significance For this study we should use Select an answer a The null and alternative hypotheses would be Ho Select an answer H Select an answer Select an answer Select an answer Select an answer Select an answe b The test statistic c The p value d The p value is a e Based on this we should f Thus the final conclusion is that please enter a decimal Please enter a decimal please show your answer to 3 decimal places Please show your answer to 4 decimal places Select an answer the null hypothesis The results are statistically insignificant at a 0 01 so there is insufficient evidence to conclude that the population mean revenue on days with a red Sale sign is more than the population mean revenue on days with a blue Sale sign The results are statistically significant at a 0 01 so there is sufficient evidence to conclude that the mean revenue for the nine days with a red Sale sign is more than the mean revenue for the nine days with a blue Sale sign The results are statistically insignificant at a 0 01 so there is statistically significant evidence to conclude that the population mean revenue on days with a red Sale sign is equal to the population mean revenue on days with a blue Sale sign The results are statistically significant at a 0 01 so there is sufficient evidence to conclude that the population mean revenue on days with a red Sale sign is more than the population

Statistics
StatisticsShells of mollusks function as part of the skeletal system and as protective armor It has been argued that many features of these shells were the result of natural selection in the constant battle against predators The data let x shell height in cm and y breaking strength in newtons The least squares line was y 275 1 244 9x a What are the slope and the intercept of this line b When shell height increases by 1 cm by how much does breaking strength tend to change c What breaking strength would you predict when the shell height is 2 cm d Does this approximate linear relationship appear to hold for shell heights as small as 1 cm Explain e When shell height increases by 3 cm by how much does breaking strength tend to change f What percent of variation in percentage of cells without aberrations can be explained by the least squares line if r 87 4 There have been numerous studies on the effects of radiation The following data on the relationship between degree of exposure to alpha particles x and the percentage of exposed cells without aberrations y appeared in a research journal as follows alpah part x 0 106 0 193 0 511 0 527 1 08 1 62 1 73 2 36 2 72 3 12 3 88 4 18 44 41 37 40 cells w out aberrations y 98 95 87 a What is the least squares line 72 75 85 55 64 b Look back at the scatter plot does the correlation coefficient tell the whole story What is the correlation coefficient c What percent of variation in percentage of cells without aberrations can be explained by the least squares line be

Statistics
StatisticsA race is 7 10 kilometers long Carlos ran 9 of the How far did he run altogether Write your answer in simplest form

Statistics
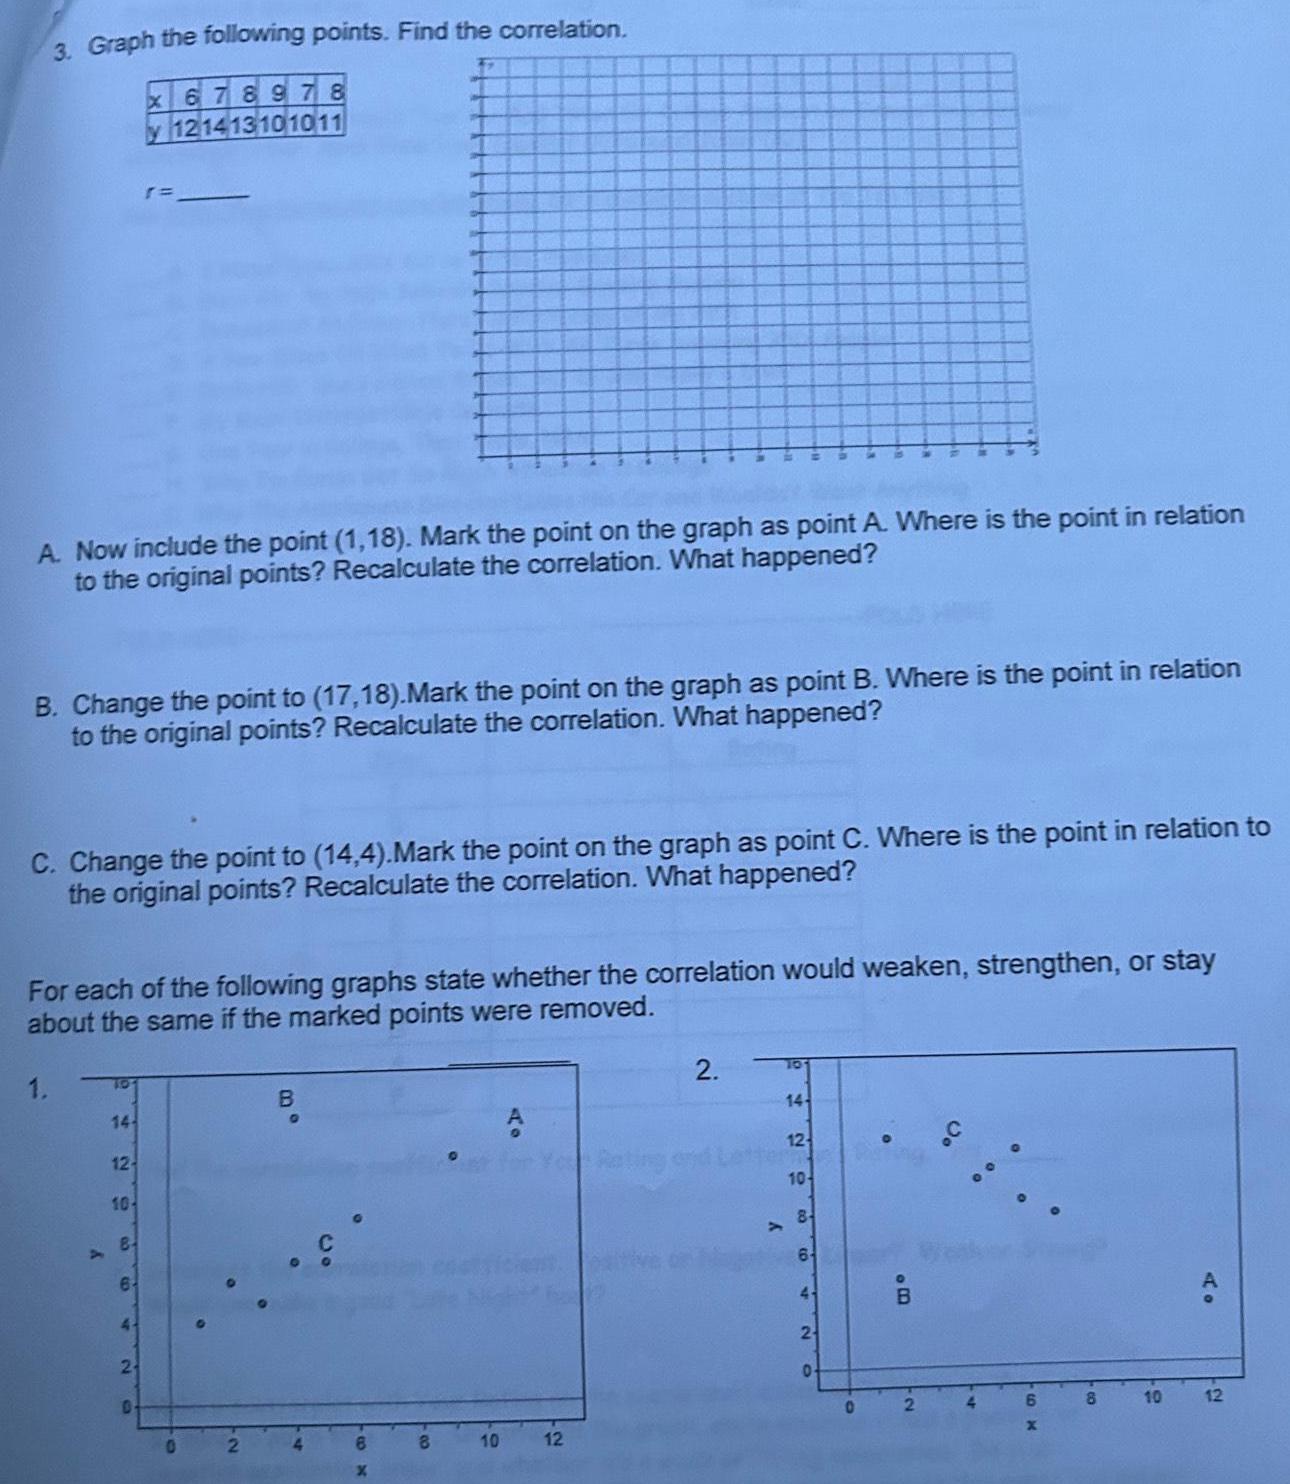
Statisticsthe following points Find the correlation x 6 7 8 91011 y 12141310 9 8 r A Now include the point 1 18 Mark the point on the graph as point A Where is the point in relation to the original points Recalculate the correlation What happened B Change the point to 17 6 Mark the point on the graph as point B Where is the point in relation to the original points Recalculate the correlation What happened C Change the point to 14 16 Mark the point on the graph as point C Where is the point in relation to the original points Recalculate the correlation What happened D Change the point to 1 1 Mark the point on the graph as point D Where is the point in relation to the original points Recalculate the correlation What happened 813 1 E Change the point to 8 11 Mark the point on the graph as point E Where is the point in relation to the original points Recalculate the correlation What happened Change the point to 8 19 Mark the point on the graph as point F Where is the point in relation to the original points Recalculate the correlation What happened Change the point to 19 10 Mark the point on the graph as point G Where is the point in rolotin the original points Recalculate the correlation

Statistics
Statistics1 Graph the following points Find the correlation x 123456 y 243758 8537 r B TRITA BOLE noilsis ni inloq ertal enerW A injog es dasip edl no iniog snit heM 81 1 Inioq srit sould A Now include the point 4 5 Mark the point on the graph above as point A Where is the point in relation to the original points Recalculate the correlation What happened pt noitelen ni Iniog er ei storW 8 Inlog es rigsip edino Inlog sitt XhGM 8 Tt of Iroq erti agner B Change the point to 8 9 Mark the point on the graph as point B Where is the point in relation to the original points Recalculate the correlation What happened da ni tniog prit al startW O inlog se donng edi no mioo ad is 01 Pr of inlog ent agrieri C Change the point to 14 16 Mark the point on the graph as point C Where is the point in relation to the original points Recalculate the correlation What happened nousisi ni Inioa erit ei ensriW Otniog as riqsip ant no fning ort sigM ft of inlog or sonen 0 D Change the point to 10 5 Mark the point on the graph as point D Where is the point in relation to the original points Recalculate the correlation What happened tourishing arti aj enerW 3 inioo as riqsig att no iniog er heMitt 8 al inico ed egredo a E Change the point to 18 5 Mark the point on the graph as point E Where is the point in relation to the original points Recalculate the correlation What happened J g en dosip art no Iniog orit REN Gr at mig ent conda F Change the point to 5 14 Mark the point on the graph as point F Where is the point in relation to the original points Recalculate the correlation What happened tolog ell espanW 3 thing as riqng prit no injog nu hem ten al foglasi sonona G Change the point to 1 10 Mark the point on the graph as point G Where is the point in relation to

Statistics
StatisticsCoefficient of Determination 1 Nine students were tested to determine the effect of test anxiety on test scores The data is shown below Test Anxiety Score x 23 Exam Score y 43 a Find the correlation coefficient 14 59 b Find the least squares line Name 14 48 0 17 20 20 15 21 77 50 52 46 51 51 c Compute the coefficient of determination How does it compare to part a A sample of automobiles traveling a certain stretch of highway is selected Each one travels at roughly a constant rate of speed although speed does vary from car to car Let x speed and y time needed to travel this segment of highway Would the sample correlation coefficient be closest to 9 3 3 or 9 Explain
Statistics
Statistics3 Graph the following points Find the correlation 17 A Now include the point 1 18 Mark the point on the graph as point A Where is the point in relation to the original points Recalculate the correlation What happened B Change the point to 17 18 Mark the point on the graph as point B Where is the point in relation to the original points Recalculate the correlation What happened C Change the point to 14 4 Mark the point on the graph as point C Where is the point in relation to the original points Recalculate the correlation What happened 1 For each of the following graphs state whether the correlation would weaken strengthen or stay about the same if the marked points were removed 14 12 10 x 678978 y 121413101011 8 6 2 0 0 B 6 x 8 10 12 2 y 14 12 10 8 64 2 0 0 BO 8 10 12