Statistics Questions
The best high school and college tutors are just a click away, 24×7! Pick a subject, ask a question, and get a detailed, handwritten solution personalized for you in minutes. We cover Math, Physics, Chemistry & Biology.

Statistics
Statistics18 Since many individuals walk around their homes in their socks a manufacturer has created a material for socks that is believed to be more resistant to wear than cotton The manufacturer wishes to test this belief over a period of a month Given a group of volunteers which of the following designs will best test this new material s resistance to wear A have the volunteers wear the socks made from the new material for a month and check the wear on the socks at the end of the month B Allow half of the volunteers to wear cotton socks while the other half wear socks made of the new material Compare the wear on the socks at the end of the month C Randomly assign half of the volunteers to wear cotton socks while the other half wear socks made of the new material Compare the wear on the socks at the end of the month D Randomly assign half of the volunteers to wear cotton socks while the other half wear socks made of the new material At the end of two weeks the volunteers should change sock types Compare the wear on the socks at the end of the month E For each volunteer randomly choose which foot wears a cotton sock while the other foot wears a sock made of the new material Compare the wear on the socks at the end of the month

Statistics
Statistics10 In a certain community 20 of cable subscribers also subscribe to the company s broadband service for their Internet connection You would like to design a simulation to estimate the probability that one of six randomly selected subscribers has the broadband service Using digits 0 through 9 which of the following assignments would be appropriate to model this situation Pearson s test prep pg 169 7 A Assign even digits to broadband subscribers and odd digits to cable only subscribers B Assign 0 and 1 to broadband subscribers and 2 3 4 5 6 7 8 and 9 to cable only subscribers C Assign 0 1 and 2 to broadband subscribers and 3 4 5 6 7 8 and 9 to cable only subscribers D Assign 1 2 3 4 5 and 6 to broadband subscribers and 7 8 9 and 0 to cable only subscribers E Assign 0 1 and 2 to broadband subscribers 3 4 5 and 6 to cable only subscribers and ignore digits 7 8 and 9

Statistics
Probability15 Which of the following is a true statement about experimental design A Replication is a key component in experimental design Thus an experiment needs to be conducted on repeated samples before generalizing results B Control is a key component of experimental design Thus a control group that receives a placebo is a requirement for experimentation C Randomization is a key component in experimental design Randomization is used to reduce bias D Blocking eliminates the effects of all lurking variables E The placebo effect is a concern for all experiments

Statistics
Probability14 In a game of chance three fair coins are tossed simultaneously If all three coins show heads then the player wins 15 If all three coins show tails then the player wins 10 If it costs 5 to play the game what is the player s expected net gain or loss at the end of two games C gain 3 75 D lose 1 88 A gain 15 B gain 1 88 E lose 3 75

Statistics
Statistics9 A newlywed couple is trying to choose one of two neighborhood supermarkets for their grocery shopping They decide to randomly select 20 items check their price at each store then conduct a test to determine if one store is significantly less expensive than the other What test should they conduct A Two sample z test E Linear regression t test B Two sample t test C Matched pairs t test D x goodness of fit test

Statistics
Statistics11 The number of T shirts a school store sells monthly has the following probability distribution of T shirts X 0 1 2 3 4 5 6 7 8 9 10 P X 0 02 0 15 0 18 0 21 0 14 0 08 0 08 0 04 0 03 0 02 0 05 If each T shirt sells for 10 but costs the store 4 to purchase what is the expected monthly T shirt profit A 3 78 B 15 12 C 22 68 D 30 00 E 37 80

Statistics
StatisticsQuestion 2 A 1934 investment earns 7 2 interest compounded semi annually Write an equation for the value of the investment as a function of time in years b Determine the value of the investment after 7 years How long will it take for the investment to quadruple in value Suppose that a penalty for early withdrawal of 4 of the initial Investment is applied if the withdrawal occurs within the first 7 year Write an equation for the adjusted value of the investment as a function of time Describe the effect this adjustment would have on the graph of the original function Note that 1 year 2 semi annuals 4 quarters 12 months 52 weeks 365 days Open Response

Statistics
Statistics20 Which of the following hypothesis tests automatically include blocking as part of the design A two sample t test test E none of these B matched pairs t test C 2 proportion z D linear regression t test for slope

Statistics
StatisticsDesign a study Question 3 Marine iguanas do not really pay attention to humans Historically they have had no reason to fear them Now with the influx of tourists the iguanas are becoming more timid Conservationists are interested in the distance at which an iguana begins to show alarm with and without exposure to tourists Alarm is shown by a rapid head movement accompanied by a low clicking sound a Design an experiment to determine the distance at which iguanas become alarmed by human contact

Statistics
Statistics4 A researcher planning a survey of heads of households in a particular state has census lists for each of the 23 counties in that state The procedure will be to obtain a random sample of 10 heads of households from each of the 23 counties Which of the following is a true statement about the resulting sample I This is not a proper study because children were not included II This stratified random sample is a type of simple random sample because subjects were randomly selected from each county III This is not a simple random sample because all possible groups of 230 subjects did not have the same probability of being selected IV This study may give important information about the similarities and differences of the 23 counties A III and IV B I and II C I and III None of these gives a complete set D I II and III E

Statistics
Statistics12 A young woman works two jobs and receives tips for both jobs As a hair dresser her distribution of weekly tips has mean 65 and standard deviation 5 75 As a waitress her distribution of weekly tips has mean 154 and standard deviation 8 02 What are the mean and standard deviation of her combined weekly tips Assume independence for the two jobs Pearson s test prep pg 170 10 A mean 167 16 standard deviation 9 87 B mean 167 16 standard deviation 13 77 C mean 219 00 standard deviation 2 27 D mean 219 00 standard deviation 9 87 E mean 219 00 standard deviation 13 77 13 A cause and effect relationship between two variables can best be determined from which of the following prep pg 170 11 Pearson s test A A survey conducted using a simple random sample of individuals B a survey conducted using a stratified random sample of individuals C When the two variables have a correlation coefficient near 1 or 1 D An observational study where the observational units are chosen randomly E A controlled experiment where the observational units are assigned randomly to treatments

Statistics
Statistics5 A study is made to determine whether studying Latin helps students achieve higher scores on the verbal section of the SAT exam In comparing records of 200 students half of whom have taken at least 1 year of Latin it is noted that the average SAT verbal score is higher for those 100 students who have taken Latin than for those who have not Based on this study guidance counselors begin to recommend Latin for students who want to do well on the SAT exam Which of the following are true statements I While this study indicates relation it does not prove causation II There could well be a confounding variable responsible for the seeming relationship III Self selection here makes drawing the counselors conclusion difficult A I and II B I and III C II and III D I II and III of these gives a true complete set E None

Statistics
StatisticsQuestion 2 Dr Bicep is studying muscle growth He randomly selects 30 patients to add instant protein to their daily diet and 30 patients to eat as they normally would Both groups are required to hit the weight training room three times a week The hypothesis is that the instant protein group will increase their muscle mass more than the group without the extra protein a What is the treatment imposed in this experiment b Describe a possible confounding variable c Describe a possible observational study for the same problem

Statistics
Statistics1 In one study subjects were randomly given either 500 or 1000 milligrams of vitamin C daily and the number of colds they came down with during a winter season was noted In a second study people responded to a questionnaire asking about the average number of hours they sleep per night and the number of colds they came down with during a winter season A The first study was an experiment without a control group while the second was an observational study B The first study was an observational study while the second was a controlled experiment C Both studies were controlled experiments D Both studies were observational studies E None of the above is a correct statement

Statistics
Statistics3 To survey the opinions of bleacher fans at Wrigley Field a surveyor plans to select every one hundredth fan entering the bleachers one afternoon Will this result in a simple random sample of Cub fans who sit in the bleachers A Yes because each bleacher fan has the same chance of being selected B Yes but only if there is a single entrance to the bleachers C Yes because the 99 out of 100 bleacher fans who are not selected will form a control group D Yes because this is an example of systematic sampling which is a special case of simple random sampling E No because not every sample of the intended size has an equal chance of being selected

Statistics
Probability2 Ann Landers who wrote a daily advice column appearing in newspapers across the country once asked her readers If you had it to do over again would you have children Of the more than 10 000 readers who responded 70 said no I m certain your parents would say yes What does this show A The survey is meaningless because of voluntary response bias B No meaningful conclusion is possible without knowing something more about the characteristics of her readers C The survey would have been more meaningful if she had picked a random sample of the 10 000 readers who responded D The survey would have been meaningful if she had used a control group E This was a legitimate sample drawn from her readers and of sufficient size to allow the conclusion that most of her readers who are parents would have second thoughts about having children

Statistics
Statistics1A What are the null and alternative hypotheses in this example Scores on a standardized test have a mean of 70 Modifications are made to the test and an educator believes that the mean may have changed B To determine how big a difference Between Test Statistic and Ho Value below we reject Ho we do hypothesis tests What are the two things of the sample distribution that these hypothesis tests consider for that decision

Statistics
StatisticsLet z denote a random variable that has a standard norma your answers to four decimal places USE SALT a P 0 79 z 0 54 b P Z 3 0 0013 c P z 2 3 37 d P Z 4 99 1 X X

Statistics
Statistics1A What is the purpose of a hypothesis test Compare the idea of hypothesis test with criminal trial B What do we do at the start of hypothesis test and describe the process of Rejecting the Null Hypothesis After rejecting the null hypothesis what do we do C What is role of test statistic in rejecting null hypothesis Ho

Statistics
StatisticsSuppose that follows a chi square distribution with 6 degrees of freedom Use the ALEKS calculator to answer the following a Compute P 6 x 9 Round your answer to at least three decimal places P 6 x 9 b Find such that P x k 0 05 Round your answer to at least two decimal places k 0 X

Statistics
Statistics7 points Check your understanding A test is made of Ho 40 versus H 40 The test statistic is z 1 28 Find and interpret the P value Hint P for z Get the z value and P value yourself

Statistics
StatisticsCholesterol levels The National Health and Nutrition Examination Survey NHANES measured the serum HDL cholesterol levels in a large number of women Following is a sample of 40 HDL levels in milligrams per deciliter that are based on the results of that survey They have been sorted into numerical order 28 29 29 29 31 32 34 36 36 36 41 44 45 47 48 50 51 53 55 56 57 58 61 64 65 71 71 72 72 75 76 77 77 78 79 79 80 80 83 85 Part 0 4 Part 1 of 4 a Find the first and third quartiles of these data The first quartile of these data is The third quartile of these data is

Statistics
Statistics16 4 points The dean of a business school wants to determine whether the mean starting salary of graduates of her school is greater than 50 000 She will perform a hypothesis test with the following null and alternate Hypotheses Ho 50 000 versus H 50 000 Decide if a Type I error Type Il error or a correct decision occurs in each case The true mean is 50 000 and the dean rejects Ho The true mean is 55 000 and the dean rejects Ho The true mean is 55 000 and the dean does not reject Ho

Statistics
StatisticsA scientist claims that more than 4 percent of mammals are monogamous For which confidence interval should you reject Ho 0 03 to 0 06 0 07 to 0 08 0 015 to 0 02 0 029 to 0 051

Statistics
StatisticsSubmit quiz Scores on a standardized intelligence test are normally distributed with a mean of 100 and a standard deviation of 10 Use the 68 95 99 7 Rule to find the percentage of people taking the test who score above 130 The percentage of people taking the test who score above 130 is Type an integer or a decimal point s possible WSO

Statistics
StatisticsConsider the Standard Normal distribution The mean is always and the standard deviation is always Next Question

Statistics
ProbabilityDetermine whether the following statement is true or false A score in the 50th percentile on a standardized test is the median Choose the correct answer below A The statement is false because a score in the 50th percentile is the standard deviation B The statement is false because the median or first quartile is the 25th percentile Oc The statement is true because the median or second quartile is the 50th percentile D The statement is false because the median or third quartile is the 75th percentile

Statistics
StatisticsA random sample of 56 fluorescent light bulbs has a mean life of 645 hours and assume that the population standard deviation is 31 hours Construct a 95 confidence interval for the population mean OA 636 9 653 1 O B 112 0 118 9 OC 539 6 551 2 OD 712 0 768 0 ACCES

Statistics
StatisticsIn a sample of 10 randomly selected women it was found that their mean height was 63 4 inches From previous studies it can be assumed that the population standard deviation o is 2 4 and that the population of height measurements is normally distributed Construct the 95 confidence interval for the population mean OA 59 7 66 5 OB 58 1 67 3 OC 61 9 64 9 OD 60 8 65 4

Statistics
ProbabilityIn a random sample of 60 computers the mean repair cost was 150 and assume that the population standard deviation is 36 Construct a 90 confidence interval for the population mean OA 537 654 OB 141 159 OC 138 162 O D 142 158

Statistics
StatisticsA group of 49 randomly selected students has a mean age of 22 4 years and assume that the population standard deviation is 3 8 Construct a 98 confidence interval for the population mea O A 19 8 25 1 OB 21 1 23 7 OC 20 3 24 5 OD 18 8 26 3 CCD

Statistics
StatisticsThe grade point average collected from a random sample of 150 students Assume that the population standard deviation is 0 78 Find the margin of error if c 0 98 A 0 12 OB 0 15 OC 0 08 OD 0 11

Statistics
StatisticsFind the margin of error for the given values of c o and n c 0 95 o 2 7 n 100 E Click the icon to view a table of common critical values Round to three decimal place Table of Common Critical Values Level of Confidence 90 95 99 Zc 1 645 1 96 2 575 X

Statistics
Statisticsheight was recorded for each high school basketball player in a sample of 30 A 95 confidence interval for u is 11 22 inches a The individual object in the study was a randomly selected This is computer graded so use exact wording from the problem above b What was the variable information recorded for each object in the study This is computer graded so use exact wording from the problem above c State the statistical interpretation of the confidence interval in the context of this problem We are 95 confident that basketball players is are between d What is the symbol and value of the point estimate for u C Othe e What is the margin of error for the given interval inches B inches height of all Remember the sample statistic is the midpoint of the confidence interval and the difference between the highest and lowest value of your interval its width is the two times the margin of error Ohigh school f Fill in the boxes below to show the relation on the number line between the numeric values of the point estimate and the interval estimate for u B and

Statistics
StatisticsA sample of 30 incoming college students was taken and whether or not they took the SAT in high school was recorded A 95 confidence interval for p is 9 5 10 8 a The individual object in the study was a randomly selected This is computer graded so use exact wording from the problem above Remember an individual is ONE of something b What was the variable information recorded for each object in the study This is computer graded so use exact wording from the problem above The variable information was whether or not they c State the statistical interpretation of the confidence interval in the context of this problem We are 95 confident that that took the SAT in high school is between o the percentage X d What is the symbol and value of the point estimate for p e What is the margin of error for the given interval B O of all Remember the sample statistic is the midpoint of the confidence interval and the difference between the highest and lowest value of your interval its width is the two times the margin of error of incoming college students and f Fill in the boxes below to show the relation on the number line between the numeric values of the point estimate and the interval estimate for p

Statistics
StatisticsA new car that is a gas and electric powered hybrid has recently hit the market The distance travelled on 1 gallon of fuel is normally distributed with a mean of 65 miles and a standard deviation of 5 miles Find the probability of the following events A The car travels more than 73 miles per gallon Probability B The car travels less than 60 miles per gallon Probability C The car travels between 60 and 71 miles per gallon Probability

Statistics
ProbabilityPractice 1 You roll a six sided die What is the probability of rolling a 1 or an 2 You roll a six sided die What is the probability of rolling a number less than 4 or an even number 3 In a survey of 300 students 150 like pop music or country music There are 97 students who like pop music and there are 83 students who like country music What is the probability that a randomly selected student likes both pop music and country music

Statistics
StatisticsThe percentage of people taking the test who score between 183 and 909 is This question 1 point s possible Scores on the GRE Graduate Record Examination are normally distributed with a mean of 546 and a standard deviation of 121 Use the 68 95 99 7 Rule to find the percentage of people taking the test who score between 183 and 909 Submit quiz

Statistics
Statistics2 7 points The mean height of adult women in the U S is 63 7 inches with a standard deviation of 4 inches A sociologist believes that taller women may be more likely to be promoted so the mean height u of female executives may be greater than the mean height of the entire female population A simple random sample of 200 female executives has a mean height of 65 4 in Assume that the standard deviation of female executive heights is a 5 inches Can we conclude that female executives are taller on the average than the general female population at the a 0 05 level Hints SELECT zu or a Calculator STAT Test ZTest or Calculate b Area to the right of z value of this question to be P Calculate

Statistics
Probabilityabout a mean using the critical value method 4 7 points Example Hypothesis Test Critical Value A computer software vendor claims that a new version of their operating system will crash less than seven times per year on average A system administrator installs the operating system on a random sample of 41 computers At the end of a year the sample mean number of crashes is 8 1 with a standard deviation of 3 9 Can you conclude that the vendor s claim is false Use the a 0 05 significance level Degrees of Freedom Hints Area in the Right Tail 0 10 0 05 0 025 39 1 304 40 1 303 50 1 299 1 685 1 684 1 676 2 023 2 021 2 009 In Calculator to find t Use STAT Tests Ttest Stats HO X S X n o o o Calculate If t ta we reject Ho If t ta we don t reject Ho 4 points Describe the relationship between hypothesis tests and confidence intervals through an example

Statistics
Statistics7 points Example Making a Decision about Hel Suppose the P value of a hypothesis test is P 0 0266 a Do you reject Ho at the a 0 01 level b is the result statistically significant at the a 0 05 level Hint If Ps a reject Ho If P a do not reject Hol 7 points Ellie and Brenna each plan to perform a hypothesis test using the same sample Ellie will use a significance level of a 0 05 and Brenna will use a significance

Statistics
Statistics9 2 1 Perform hypothesis tests 17 7 points Example Hypothesis Test A College Board study suggests that coached students taking the SAT should have a mean score of approximately 525 A teacher who runs an online coaching program thinks that students coached by his method have a higher score than this Because the teacher believes that the mean score for his students is greater than 525 the null and alternate hypotheses are Ho 525 versus H 525 Suppose now that the teacher draws a random sample of 150 students that went through his program and their mean SAT score was X 558 Can the teacher reject and conclude that the mean of all students who go through his program will be greater than 525 H Left tailed Right tailed Two tailed Significance Level a 0 02 2 054 2 054 2 326 0 10 0 05 1 282 1 645 1 282 1 645 1 96 1 645 0 01 2 326 2 326 2 576

Statistics
Probability9 4 1 Test a hypothesis about a proportion using the P value me 27 7 points Example Hypothesis Test P value An educational specialist is studying attitudes of teachers about the use of virtual reality in the classroom She samples 555 teachers and finds that 417 of them believe that virtual reality would have a positive effect Can she conclude that the proportion of teachers who believe it will have a positive effect is greater than 90 Use the a 0 05 level of significance Hints Z p Po Po 1 P n Z Statistic To get Z value in calculator STAT Tests 1 PropZtest Stats pc n prop Po Po po Calculate Output will be z po p n To find p from z use this function normalcdf 3 13 199 0 1 8 7499861955 4

Statistics
Statistics9 4 2 Test a hypothesis about a proportion using the critical value method 28 7 points A nationwide survey of working adults indicates that only 45 of them are satisfied with their jobs The president of a large company believes that more than 45 of employees at his company are satisfied He surveys a random sample of 111 employees and 45 of them report that they are satisfied with their jobs Can he conclude that more than 45 of employees at the company are satisfied with their jobs Use the a 0 05 level of significance Hint o o Z p Po Po 1 P n Statistic If z 2 za we reject Ho

Statistics
Probabilityson grac 3 What is the probability that a tool selected at random is defective given that the tool was produced by the new method

Statistics
StatisticsRed Background Blue Background Words were displayed on a computer screen with background colors of red and blue Results from scores on a test of word recall are given below Use a 0 05 significance level to test the claim t the samples are from populations with the same standard deviation Assume that both samples are independent simple random samples from populations having normal distributions Does the background color appear to have an effect on the variation of word recall scores C Ho 0 0 2 H 0 0 2 n 35 36 What are the null and alternative hypotheses A Ho 0 0 2 H 0 1 20 2 dentify the test statistic X S 15 52 5 95 12 32 5 43 Round to two decimal places as needed A C of B Ho o 0 2 H 07 0 2 D Ho 0 02 H 0 0 2 Save

Statistics
StatisticsThe function f R R is defined by f x 4 2 and is plotted below displaying the use of the trapezium rule to calculate the area under f on the interval 2 2 O n 2 00 N T 24 T Enter your answer as a rational pur N N Area 8 00 i Using the slider in the graph above what is the approximate area under f on the interval 2 2 taking 8 subintervals n 8 on the slider Area the form 1 ii Now using the trapezoidal rule calculate the approximation of the area under the graph on the interval 2 2 with 8 subintervals n 8 on the slider

Statistics
ProbabilityConsidering the selling price of items from a large estate sale of a wealthy individual a Is the median item value more or less than the mean value Why Typed document only except for hand drawn graph

Statistics
StatisticsCQ1 Considering the selling price of items from a large estate sale of a wealthy individual a Is the median item value more or less than the mean value Why
Statistics
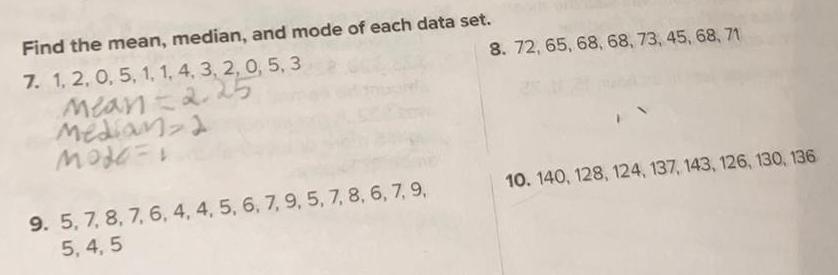
StatisticsFind the mean median and mode of each data set 7 1 2 0 5 1 1 4 3 2 0 5 3 Mean 2 25 Median 2 Mode 8 72 65 68 68 73 45 68 71 9 5 7 8 7 6 4 4 5 6 7 9 5 7 8 6 7 9 5 4 5 10 140 128 124 137 143 126 130 136