Statistics Questions
The best high school and college tutors are just a click away, 24×7! Pick a subject, ask a question, and get a detailed, handwritten solution personalized for you in minutes. We cover Math, Physics, Chemistry & Biology.
Statistics
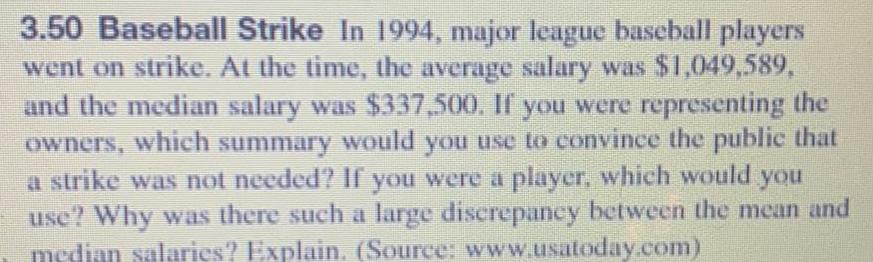
Statistics3 50 Baseball Strike In 1994 major league baseball players went on strike At the time the average salary was 1 049 589 and the median salary was 337 500 If you were representing the owners which summary would you use to convince the public that a strike was not needed If you were a player which would you use Why was there such a large discrepancy between the mean and median salaries Explain Source www usatoday com

Statistics
StatisticsNote Reported interquartile ranges will vary depending on technology 3 39 Name two measures of the center of a distribution and state the conditions under which each is preferred for describing the typical value of a single data set
Statistics
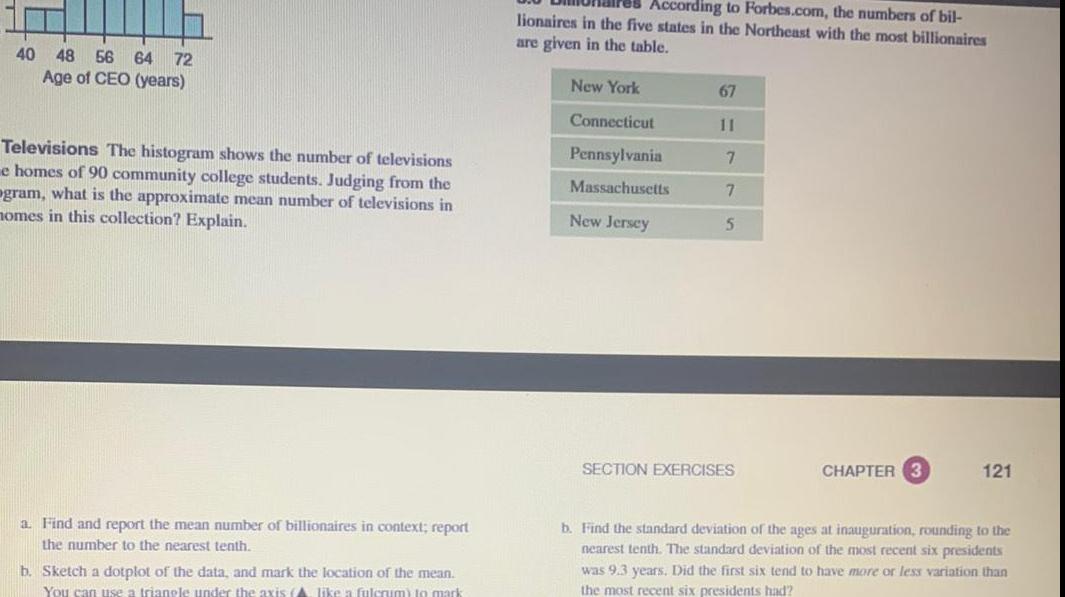
Probability40 48 56 64 72 Age of CEO years Televisions The histogram shows the number of televisions e homes of 90 community college students Judging from the ogram what is the approximate mean number of televisions in homes in this collection Explain a Find and report the mean number of billionaires in context report the number to the nearest tenth b Sketch a dotplot of the data and mark the location of the mean You can use a triangle under the axis A like a fulcrum to mark According to Forbes com the numbers of bil lionaires in the five states in the Northeast with the most billionaires are given in the table New York Connecticut Pennsylvania Massachusetts New Jersey 67 11 7 7 5 SECTION EXERCISES CHAPTER 3 121 b Find the standard deviation of the ages at inauguration rounding to the nearest tenth The standard deviation of the most recent six presidents was 9 3 years Did the first six tend to have more or less variation than the most recent six presidents had
Statistics
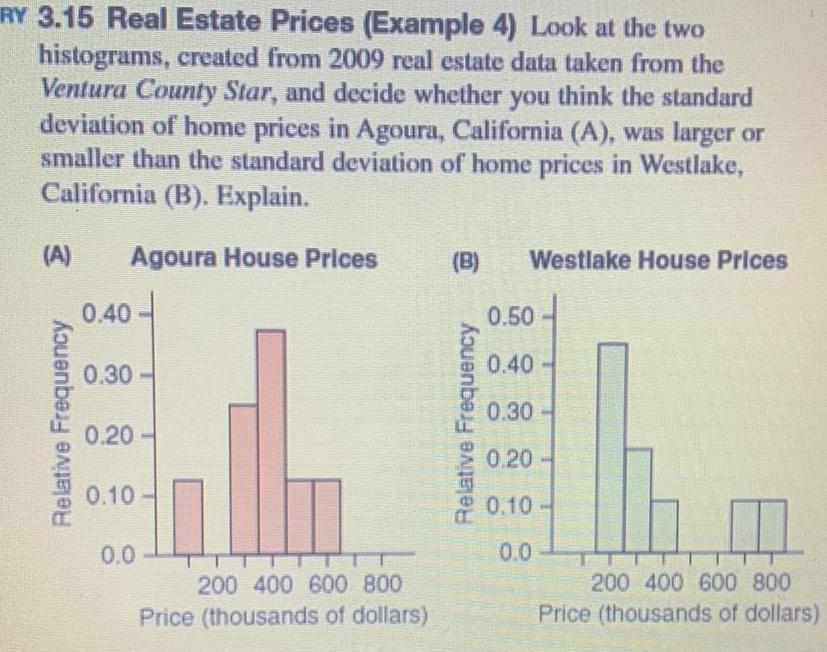
StatisticsRY 3 15 Real Estate Prices Example 4 Look at the two histograms created from 2009 real estate data taken from the Ventura County Star and decide whether you think the standard deviation of home prices in Agoura California A was larger or smaller than the standard deviation of home prices in Westlake California B Explain A Agoura House Prices Relative Frequency 0 40 0 30 0 20 0 10 0 0 200 400 600 800 Price thousands of dollars B Relative Frequency Westlake House Prices 0 50 0 40 0 30 0 20 0 10 0 0 200 400 600 800 Price thousands of dollars
Statistics
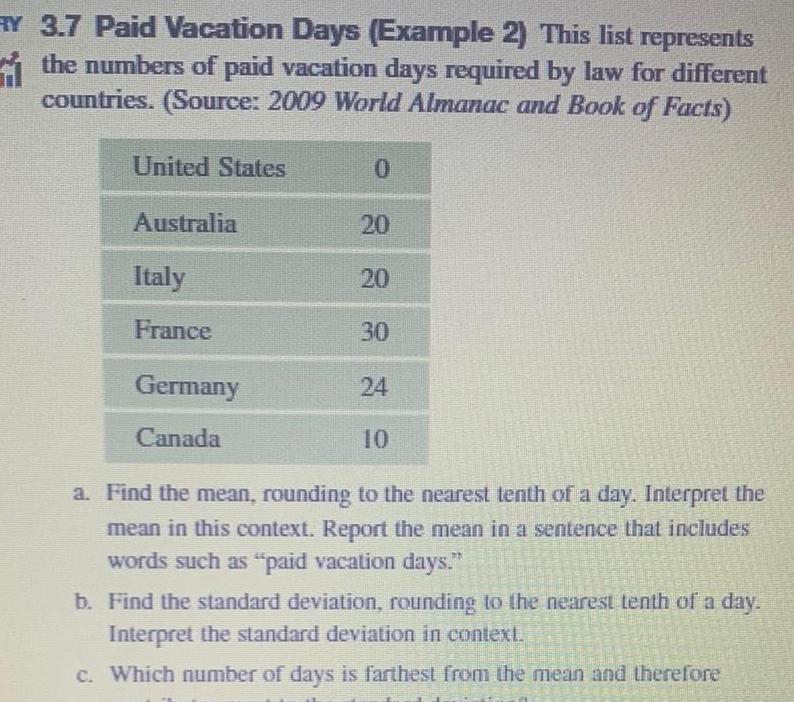
StatisticsY 3 7 Paid Vacation Days Example 2 This list represents the numbers of paid vacation days required by law for different countries Source 2009 World Almanac and Book of Facts United States Australia Italy France Germany Canada 0 20 20 30 24 10 a Find the mean rounding to the nearest tenth of a day Interpret the mean in this context Report the mean in a sentence that includes words such as paid vacation days b Find the standard deviation rounding to the nearest tenth of a day Interpret the standard deviation in context c Which number of days is farthest from the mean and therefore

Statistics
Statistics3 5 Billionaires According to Forbes com the numbers of bil lionaires in the five states in the Midwest with the most billionaires are given in the table Illinois Wisconsin Michigan Minnesota Ohio 20 10 10 6 5 a Find and report the mean number of billionaires per state in context The mean number of billionaires in these five states is Report the number to the nearest tenth b Sketch a dotplot of the data and mark the location of the mean You can use a triangle under the axis A like a fulcrum to mark the location it should be at the balance point c Find and report the standard deviation of the number of billionaires per state in context round to the nearest tenth d Which of the given numbers is farthest from the mean and therefore contributes most to the standard deviation

Statistics
Statistics3 2 Houses A real estate agent claims that all things being equal houses with swimming pools tend to sell for less than those without swimming pools What does this statement mean Pick the best choice a There are fewer homes with swimming pools than without b The typical price for homes with pools is smaller than the typical price for homes without pools c There s more variability in the price of homes with pools than in the price of those without d The most expensive houses sold do not have pools

Statistics
ProbabilityHow much can you afford to borrow You can afford monthly payments of 500 If current mortgage rates are 3 03 for a 15 year fixed rate loan how much can you afford to borrow If you are required to make a 10 DU down payment and you have the cash on hand to do it how expensive a home can you afford Hint You will need to solve the loan payment formula for P Round to the nearest dollar as needed Points 0 of 1 BEUR Save
Statistics
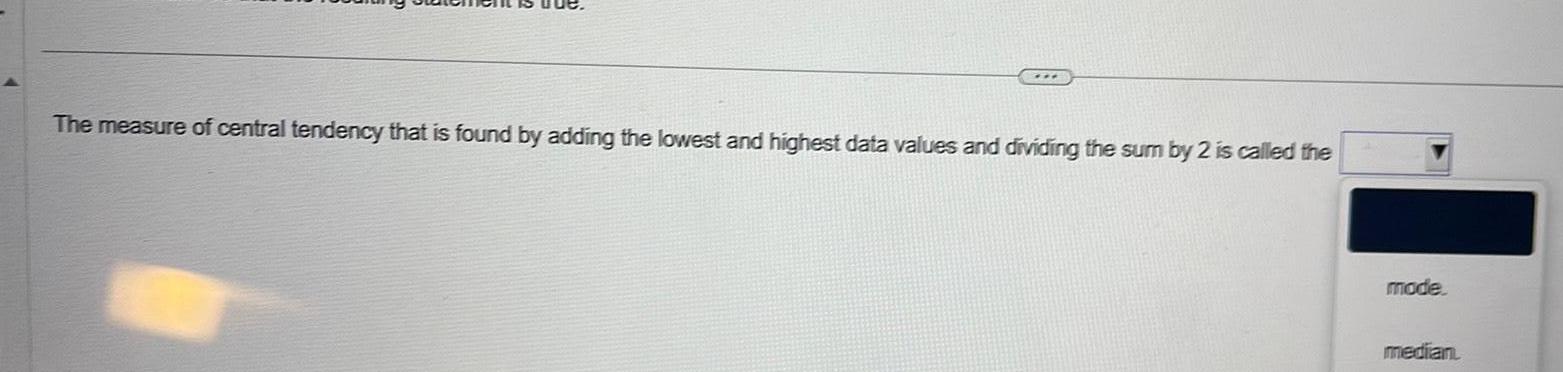
StatisticsThe measure of central tendency that is found by adding the lowest and highest data values and dividing the sum by 2 is called the mode median
Statistics
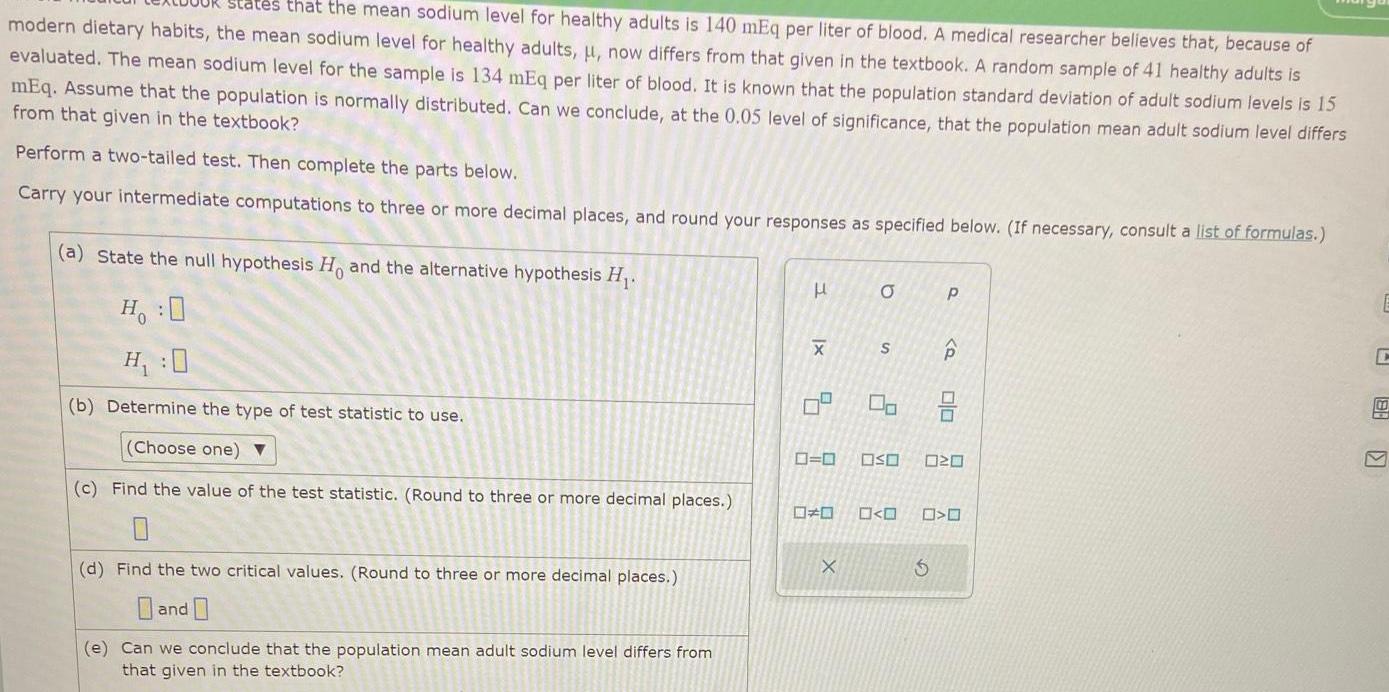
Probabilitystates that the mean sodium level for healthy adults is 140 mEq per liter of blood A medical researcher believes that because of modern dietary habits the mean sodium level for healthy adults now differs from that given in the textbook A random sample of 41 healthy adults is evaluated The mean sodium level for the sample is 134 mEq per liter of blood It is known that the population standard deviation of adult sodium levels is 15 mEq Assume that the population is normally distributed Can we conclude at the 0 05 level of significance that the population mean adult sodium level differs from that given in the textbook Perform a two tailed test Then complete the parts below Carry your intermediate computations to three or more decimal places and round your responses as specified below If necessary consult a list of formulas a State the null hypothesis H and the alternative hypothesis H H O H 0 b Determine the type of test statistic to use Choose one c Find the value of the test statistic Round to three or more decimal places 0 d Find the two critical values Round to three or more decimal places and e Can we conclude that the population mean adult sodium level differs from that given in the textbook H x X 5 1 a X S 0 0 OSO 00 P Q Olo 20 O C 88 V
Statistics
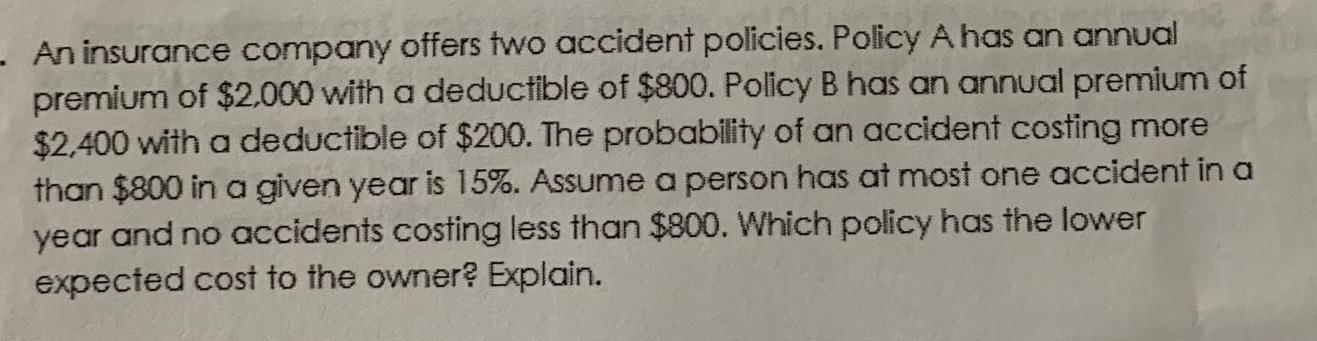
ProbabilityAn insurance company offers two accident policies Policy A has an annual premium of 2 000 with a deductible of 800 Policy B has an annual premium of 2 400 with a deductible of 200 The probability of an accident costing more than 800 in a given year is 15 Assume a person has at most one accident in a year and no accidents costing less than 800 Which policy has the lower expected cost to the owner Explain
Statistics
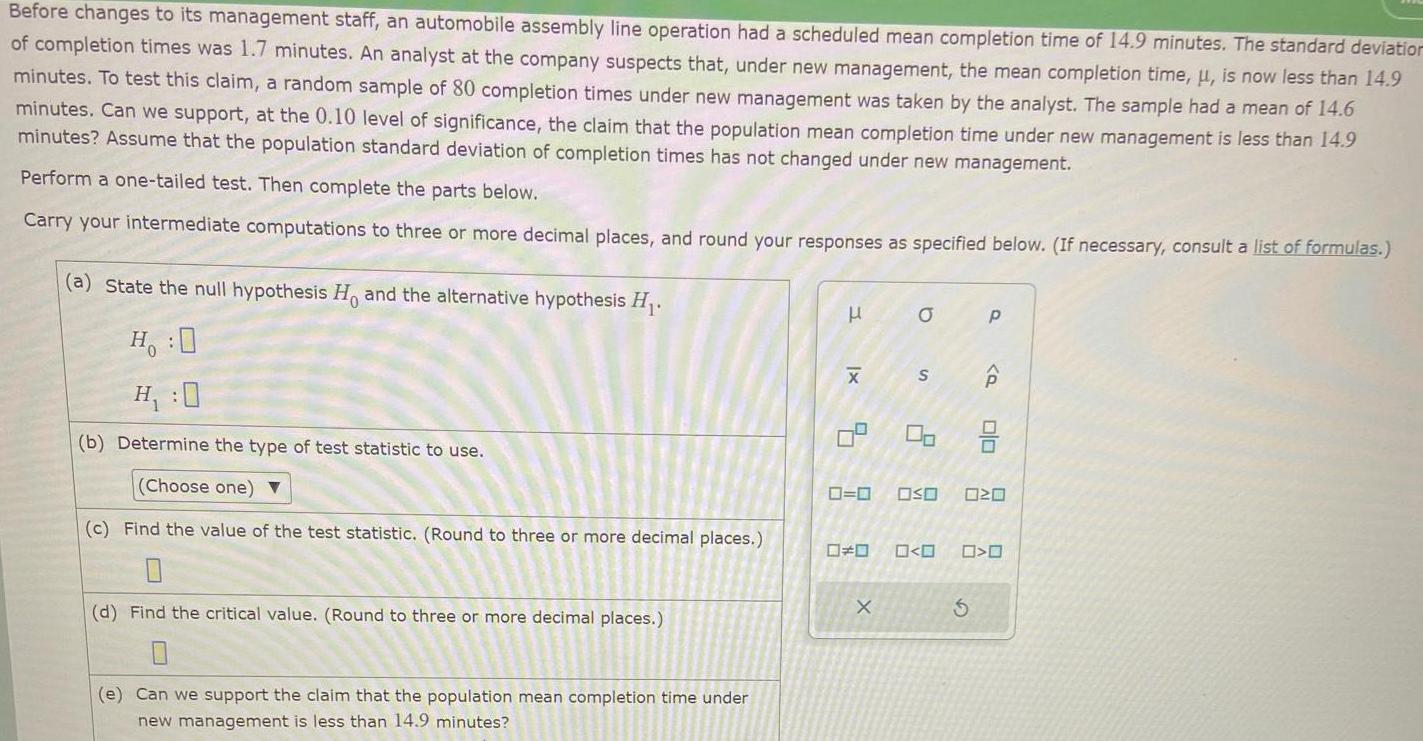
StatisticsBefore changes to its management staff an automobile assembly line operation had a scheduled mean completion time of 14 9 minutes The standard deviation of completion times was 1 7 minutes An analyst at the company suspects that under new management the mean completion time is now less than 14 9 minutes To test this claim a random sample of 80 completion times under new management was taken by the analyst The sample had a mean of 14 6 minutes Can we support at the 0 10 level of significance the claim that the population mean completion time under new management is less than 14 9 minutes Assume that the population standard deviation of completion times has not changed under new management Perform a one tailed test Then complete the parts below Carry your intermediate computations to three or more decimal places and round your responses as specified below If necessary consult a list of formulas a State the null hypothesis Ho and the alternative hypothesis H H 0 H 0 b Determine the type of test statistic to use Choose one c Find the value of the test statistic Round to three or more decimal places d Find the critical value Round to three or more decimal places e Can we support the claim that the population mean completion time under new management is less than 14 9 minutes x 9 a X S 0 0 OSO 06 O p Q P olo WE O O
Statistics
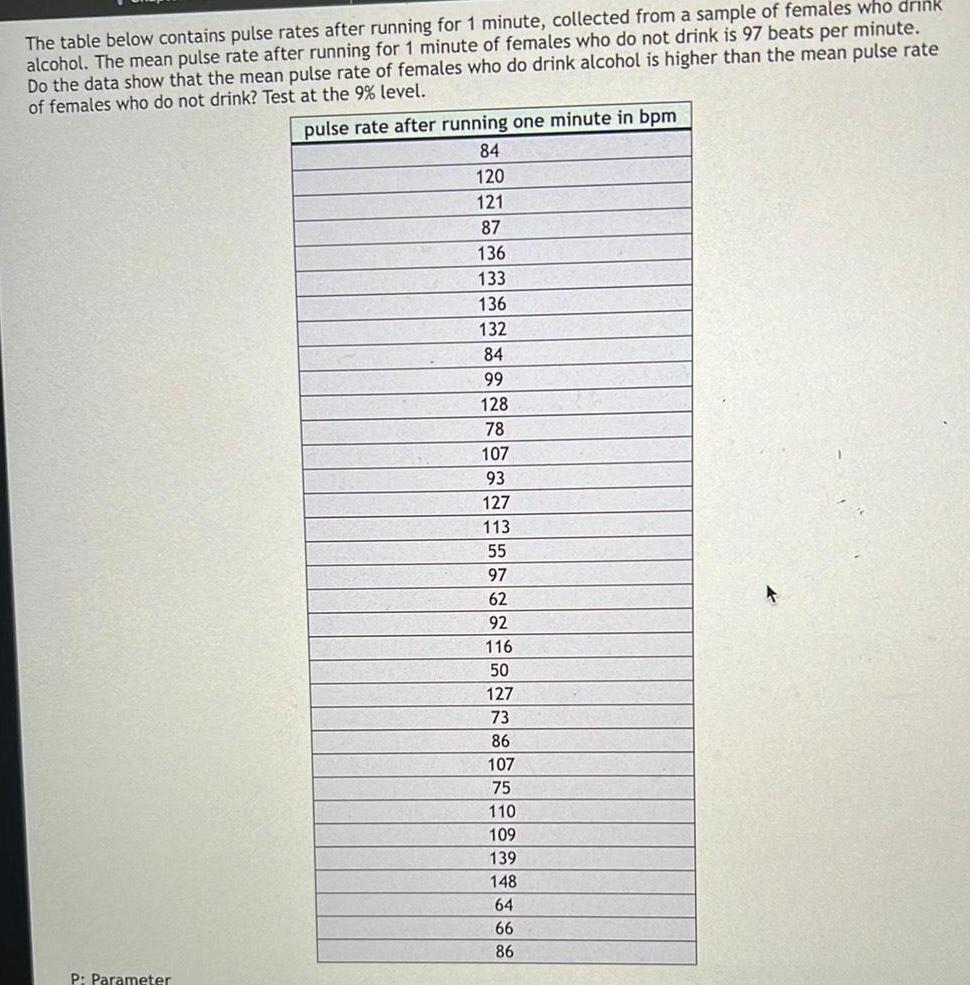
StatisticsThe table below contains pulse rates after running for 1 minute collected from a sample of females who drink alcohol The mean pulse rate after running for 1 minute of females who do not drink is 97 beats per minute Do the data show that the mean pulse rate of females who do drink alcohol is higher than the mean pulse rate of females who do not drink Test at the 9 level P Parameter pulse rate after running one minute in bpm 84 120 121 87 136 133 136 132 84 99 128 78 107 93 127 113 55 97 62 92 116 50 127 73 86 107 75 110 109 139 148 64 66 86
Statistics
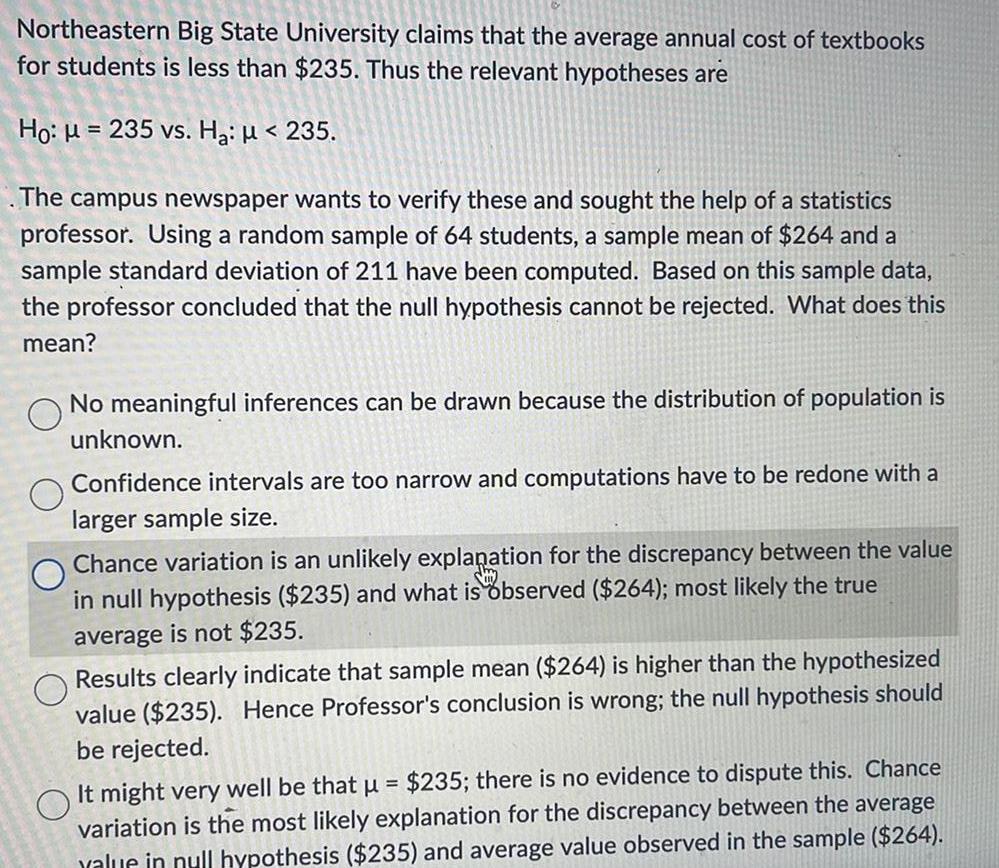
StatisticsNortheastern Big State University claims that the average annual cost of textbooks for students is less than 235 Thus the relevant hypotheses are Ho 235 vs H 235 The campus newspaper wants to verify these and sought the help of a statistics professor Using a random sample of 64 students a sample mean of 264 and a sample standard deviation of 211 have been computed Based on this sample data the professor concluded that the null hypothesis cannot be rejected What does this mean No meaningful inferences can be drawn because the distribution of population is unknown Confidence intervals are too narrow and computations have to be redone with a larger sample size Chance variation is an unlikely explanation for the discrepancy between the value in null hypothesis 235 and what is observed 264 most likely the true average is not 235 Results clearly indicate that sample mean 264 is higher than the hypothesized value 235 Hence Professor s conclusion is wrong the null hypothesis should be rejected It might very well be that 235 there is no evidence to dispute this Chance variation is the most likely explanation for the discrepancy between the average value in null hypothesis 235 and average value observed in the sample 264
Statistics
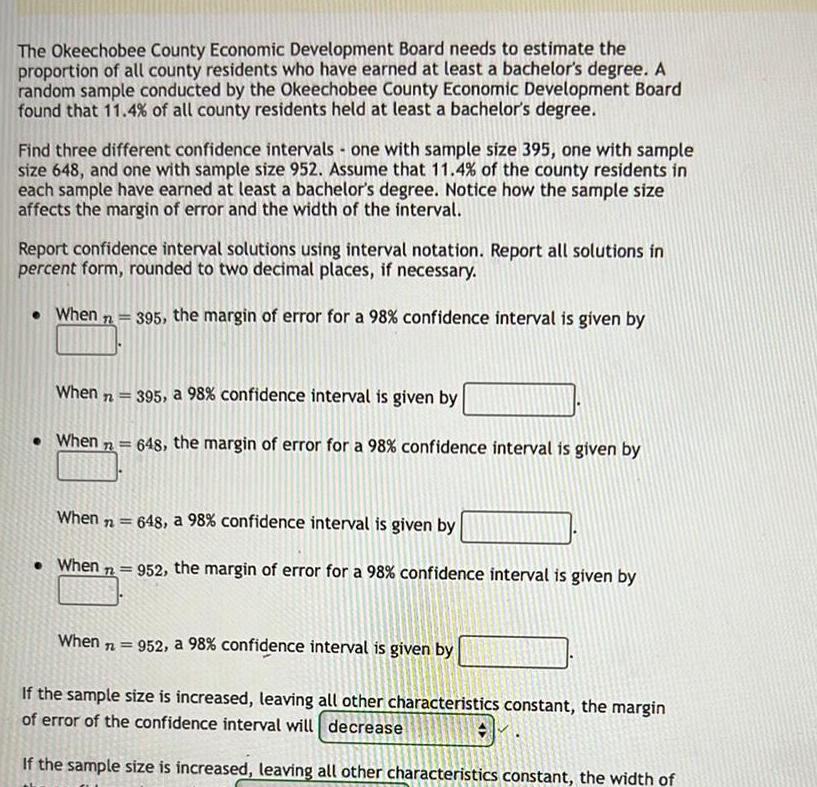
StatisticsThe Okeechobee County Economic Development Board needs to estimate the proportion of all county residents who have earned at least a bachelor s degree A random sample conducted by the Okeechobee County Economic Development Board found that 11 4 of all county residents held at least a bachelor s degree Find three different confidence intervals one with sample size 395 one with sample size 648 and one with sample size 952 Assume that 11 4 of the county residents in each sample have earned at least a bachelor s degree Notice how the sample size affects the margin of error and the width of the interval Report confidence interval solutions using interval notation Report all solutions in percent form rounded to two decimal places if necessary When n 395 the margin of error for a 98 confidence interval is given by When n When 72 When n 395 a 98 confidence interval is given by 648 the margin of error for a 98 confidence interval is given by When n 648 a 98 confidence interval is given by When 952 the margin of error for a 98 confidence interval is given by 952 a 98 confidence interval is given by If the sample size is increased leaving all other characteristics constant the margin of error of the confidence interval will decrease If the sample size is increased leaving all other characteristics constant the width of
Statistics
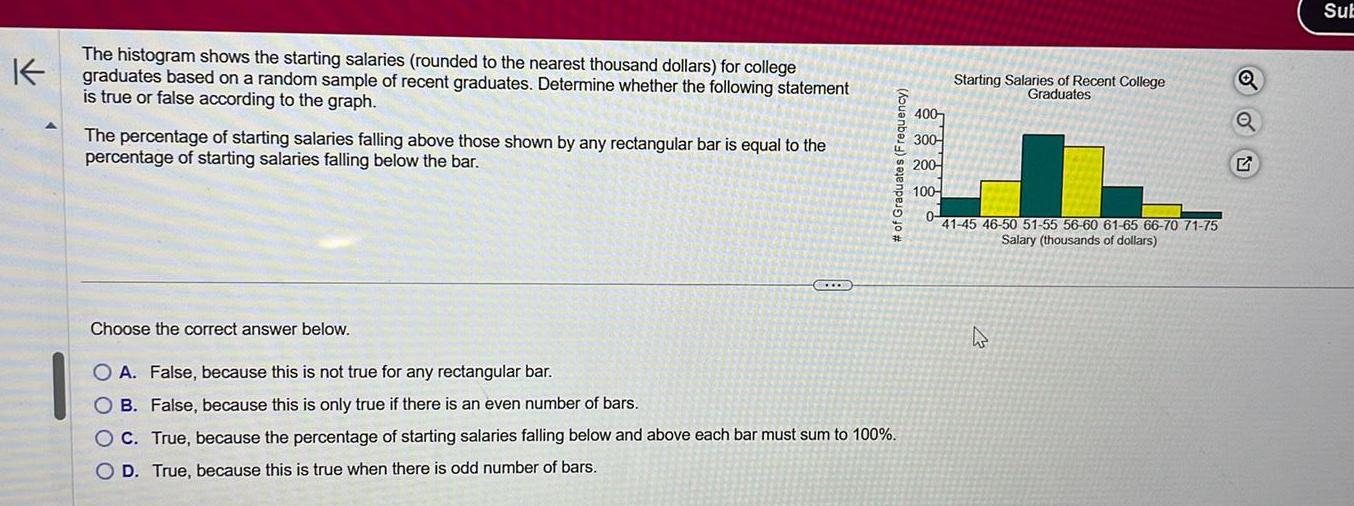
StatisticsK The histogram shows the starting salaries rounded to the nearest thousand dollars for college graduates based on a random sample of recent graduates Determine whether the following statement is true or false according to the graph The percentage of starting salaries falling above those shown by any rectangular bar is equal to the percentage of starting salaries falling below the bar Choose the correct answer below BOCCON of Graduates Frequency O A False because this is not true for any rectangular bar OB False because this is only true if there is an even number of bars OC True because the percentage of starting salaries falling below and above each bar must sum to 100 OD True because this is true when there is odd number of bars 400 300 200 100 Starting Salaries of Recent College Graduates 04 41 45 46 50 51 55 56 60 61 65 66 70 71 75 Salary thousands of dollars W Q Q Sub
Statistics
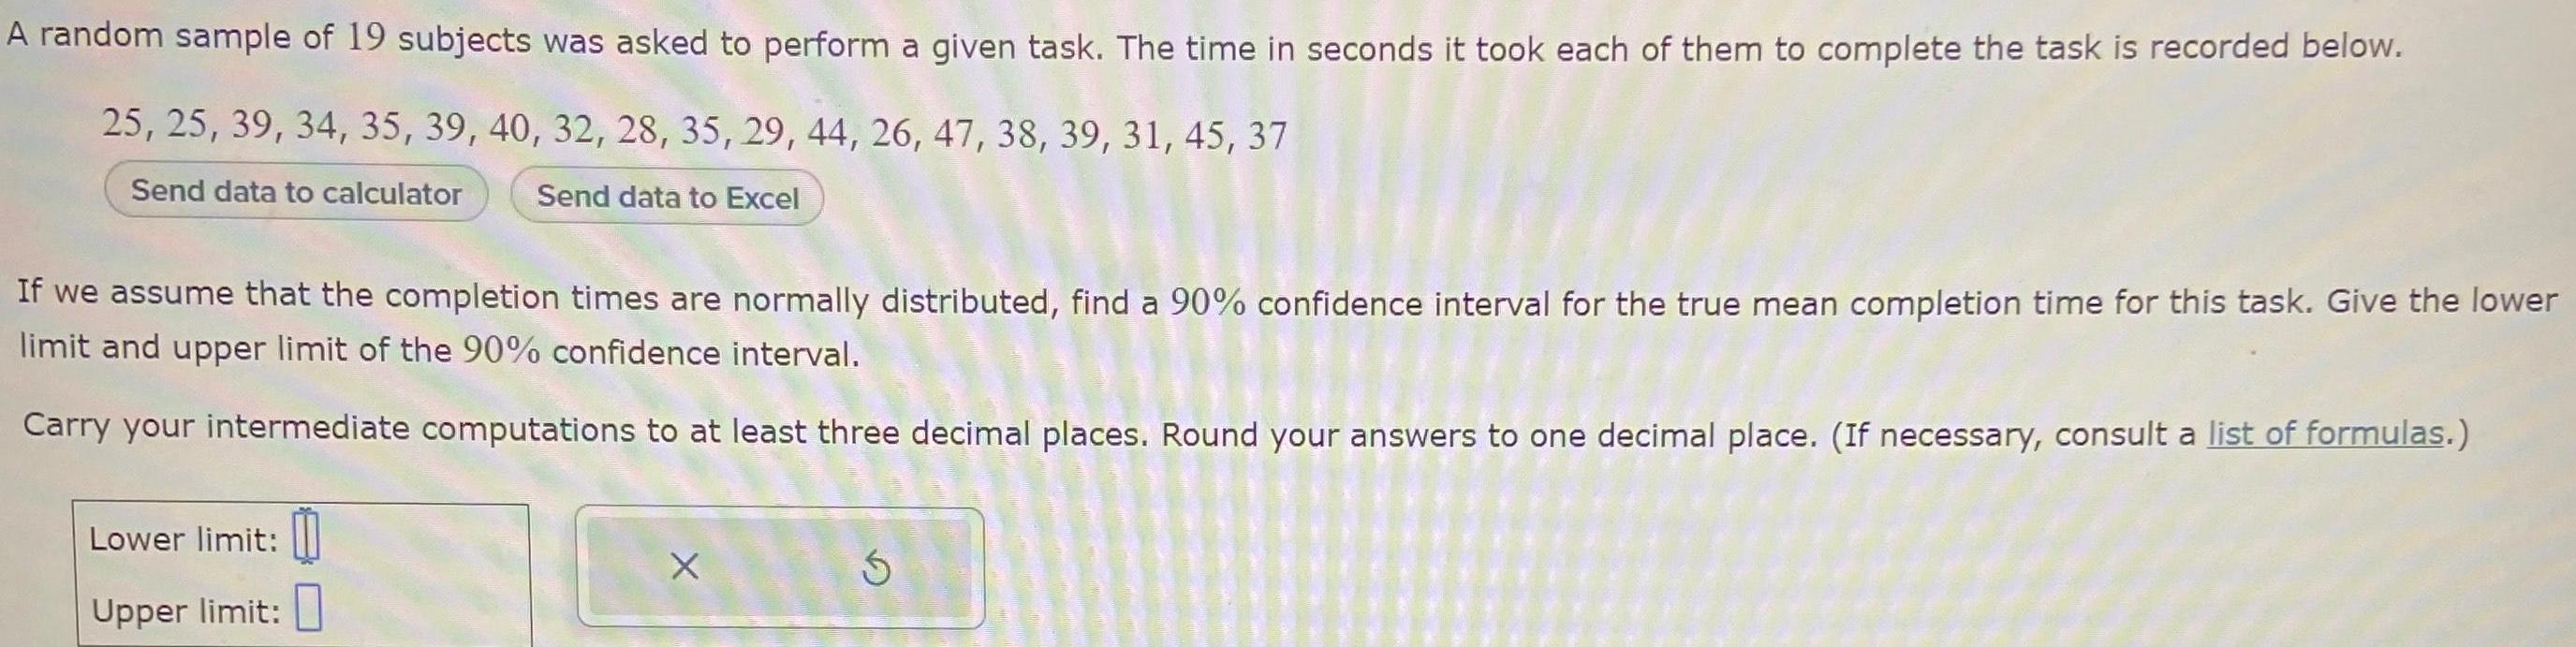
StatisticsA random sample of 19 subjects was asked to perform a given task The time in seconds it took each of them to complete the task is recorded below 25 25 39 34 35 39 40 32 28 35 29 44 26 47 38 39 31 45 37 Send data to calculator Send data to Excel If we assume that the completion times are normally distributed find a 90 confidence interval for the true mean completion time for this task Give the lower limit and upper limit of the 90 confidence interval Carry your intermediate computations to at least three decimal places Round your answers to one decimal place If necessary consult a list of formulas Lower limit Upper limit X

Statistics
ProbabilityAssuming there is a 0 5 probability that a coin will land on heads what is the probability that flipping coin will land on heads then heads then tails and then heads again
Statistics
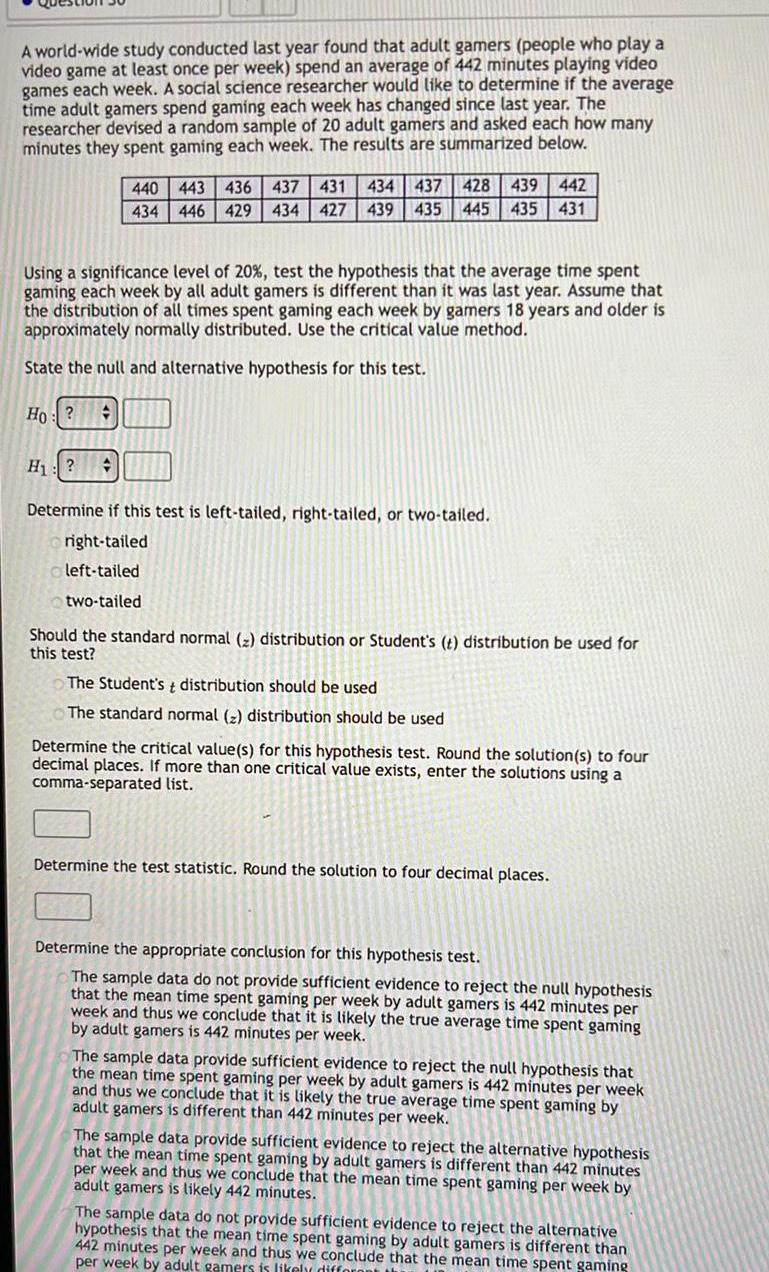
StatisticsA world wide study conducted last year found that adult gamers people who play a video game at least once per week spend an average of 442 minutes playing video games each week A social science researcher would like to determine if the average time adult gamers spend gaming each week has changed since last year The researcher devised a random sample of 20 adult gamers and asked each how many minutes they spent gaming each week The results are summarized below H 440 434 Using a significance level of 20 test the hypothesis that the average time spent gaming each week by all adult gamers is different than it was last year Assume that the distribution of all times spent gaming each week by gamers 18 years and older is approximately normally distributed Use the critical value method State the null and alternative hypothesis for this test Ho 428 439 442 443 436 437 431 434 437 446 429 434 427 439 435 445 435 431 Determine if this test is left tailed right tailed or two tailed right tailed left tailed two tailed Should the standard normal z distribution or Student s t distribution be used for this test The Student st distribution should be used The standard normal distribution should be used Determine the critical value s for this hypothesis test Round the solution s to four decimal places If more than one critical value exists enter the solutions using a comma separated list Determine the test statistic Round the solution to four decimal places Determine the appropriate conclusion for this hypothesis test The sample data do not provide sufficient evidence to reject the null hypothesis that the mean time spent gaming per week by adult gamers is 442 minutes per week and thus we conclude that it is likely the true average time spent gaming by adult gamers is 442 minutes per week minutes per The sample data provide sufficient evidence to reject the null hypothesis that the mean time spent gaming per week by adult gamers is 442 minutes per week and thus we conclude that it is likely the true average time spent gaming by adult gamers is different than 442 minutes per week The sample data provide sufficient evidence to reject the alternative hypothesis that the mean time spent gaming by adult gamers is different than 442 minutes per week and thus we conclude that the mean time spent gaming per week by adult gamers is likely 442 minutes The sample data do not provide sufficient evidence to reject the alternative hypothesis that the mean time spent gaming by adult gamers is different than 442 minutes per week and thus we conclude that the mean time spent gaming per week by adult gamers is likely different

Statistics
ProbabilityWhen rolling a die what is the probability of rolling a I or a 4 Write your answer as a fraction

Statistics
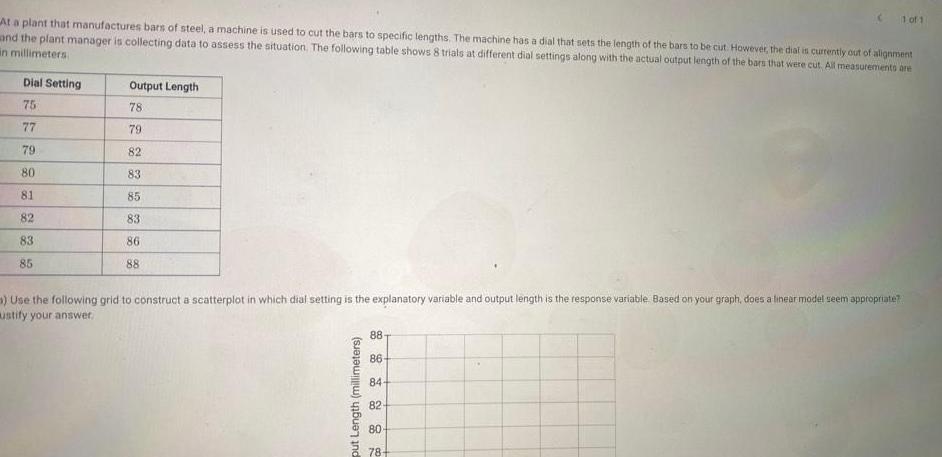
ProbabilityApril 25 2023 at 4 30 PM At a plant that manufactures bars of steel a machine is used to cut the bars to specific lengths The machine has a dial that sets the length of the bars to be cut However the dial is currently out of alignment and the plant manager is collecting data to assess the situation The following table shows 8 trials at different dial settings along with the actual output length of the bars that were cut All measurements are in millimeters the test statistic for the appropriate test is t 9 018 Does the data provide convincing statistical evidence that there is a linear relationship between output length and dial setting
Statistics
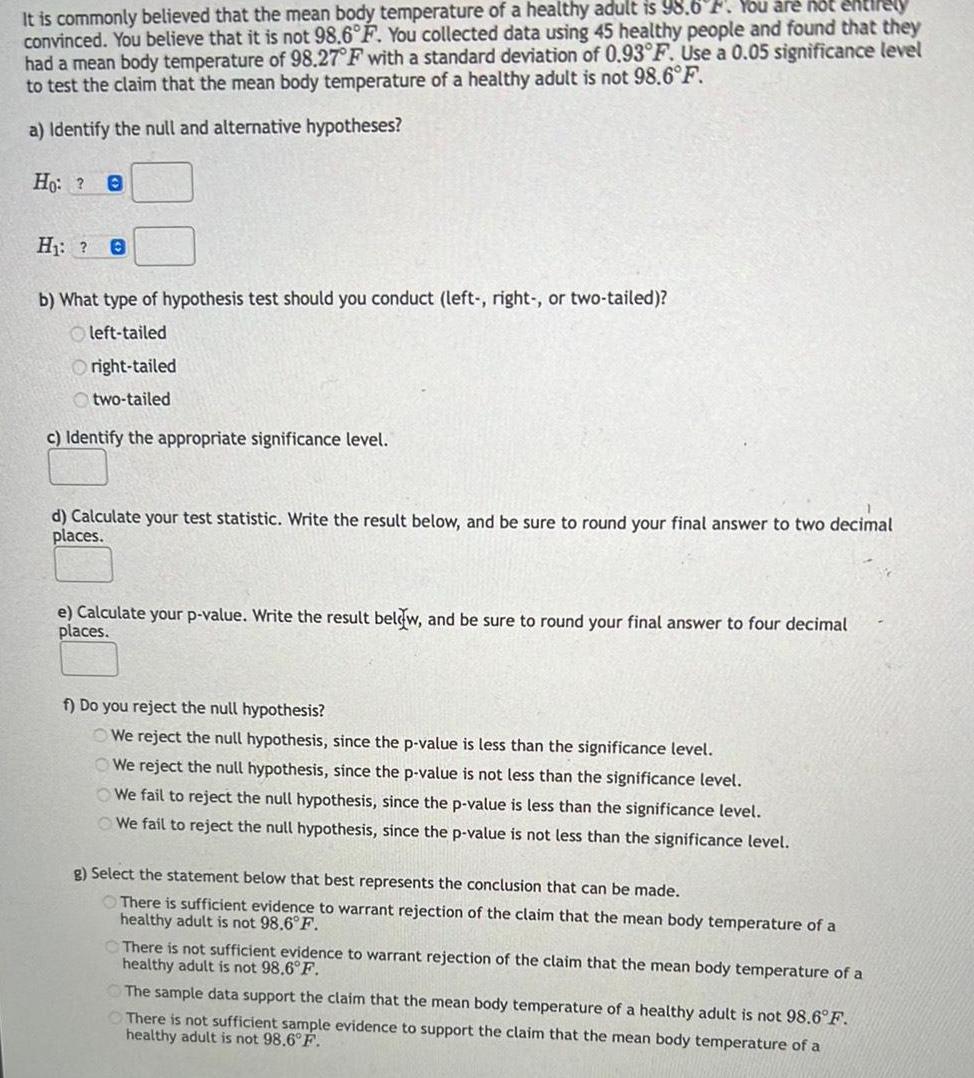
StatisticsIt is commonly believed that the mean body temperature of a healthy adult is 98 6 F You are not entirely convinced You believe that it is not 98 6 F You collected data using 45 healthy people and found that they had a mean body temperature of 98 27 F with a standard deviation of 0 93 F Use a 0 05 significance level to test the claim that the mean body temperature of a healthy adult is not 98 6 F a Identify the null and alternative hypotheses Ho 0 H 0 b What type of hypothesis test should you conduct left right or two tailed left tailed Oright tailed two tailed c Identify the appropriate significance level d Calculate your test statistic Write the result below and be sure to round your final answer to two decimal places e Calculate your p value Write the result below and be sure to round your final answer to four decimal places f Do you reject the null hypothesis We reject the null hypothesis since the p value is less than the significance level We reject the null hypothesis since the p value is not less than the significance level We fail to reject the null hypothesis since the p value is less than the significance level We fail to reject the null hypothesis since the p value is not less than the significance level g Select the statement below that best represents the conclusion that can be made There is sufficient evidence to warrant rejection of the claim that the mean body temperature of a healthy adult is not 98 6 F There is not sufficient evidence to warrant rejection of the claim that the mean body temperature of a healthy adult is not 98 6 F The sample data support the claim that the mean body temperature of a healthy adult is not 98 6 F There is not sufficient sample evidence to support the claim that the mean body temperature of a healthy adult is not 98 6 F
Statistics
StatisticsAt a plant that manufactures bars of steel a machine is used to cut the bars to specific lengths The machine has a dial that sets the length of the bars to be cut However the dial is currently out of alignment and the plant manager is collecting data to assess the situation The following table shows 8 trials at different dial settings along with the actual output length of the bars that were cut All measurements are in millimeters Dial Setting 75 77 79 80 81 82 83 85 Output Length 78 79 82 88888 83 85 83 86 88 Use the following grid to construct a scatterplot in which dial setting is the explanatory variable and output length is the response variable Based on your graph does a linear model seem appropriate ustify your answer put Length millimeters 88 86 84 82 80 78 1 of 1
Statistics
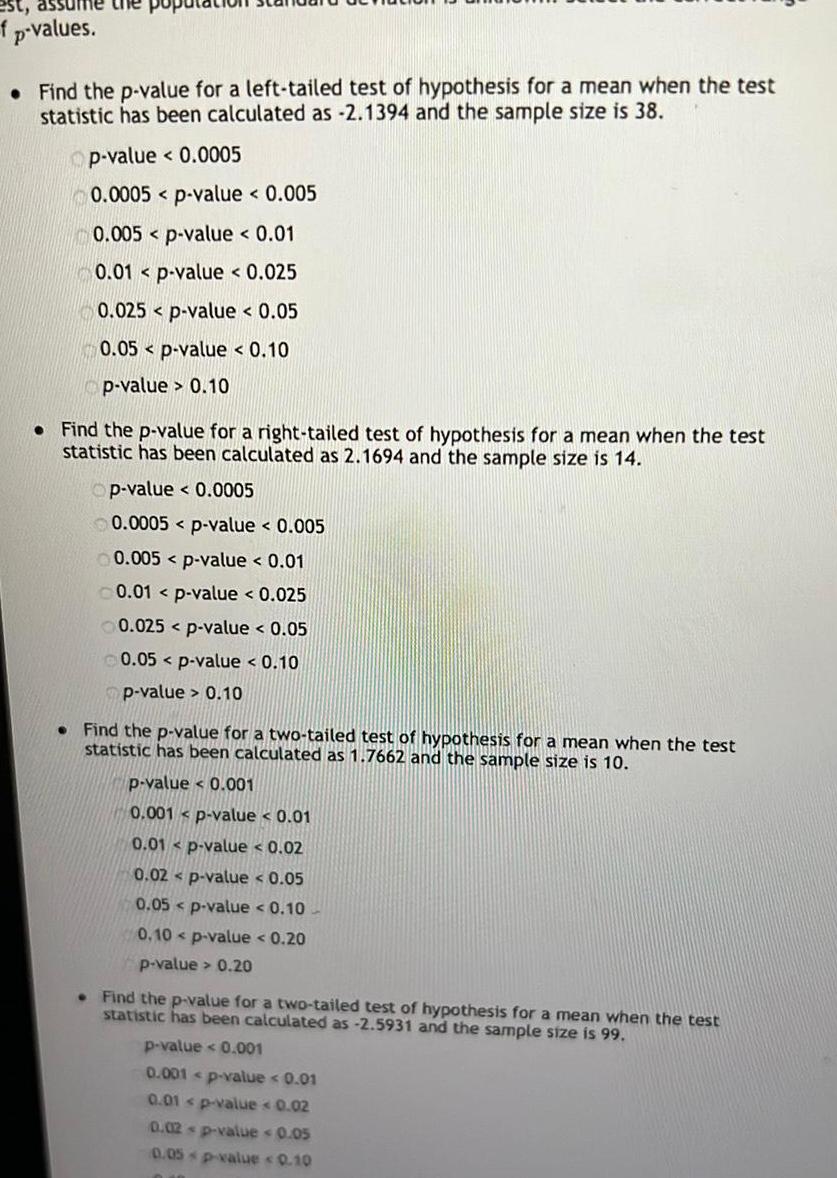
Statisticsest assume the po f p values Find the p value for a left tailed test of hypothesis for a mean when the test statistic has been calculated as 2 1394 and the sample size is 38 Op value 0 0005 0 0005 p value 0 005 0 005 p value 0 01 0 01 p value 0 025 0 025 p value 0 05 0 05 p value 0 10 p value 0 10 Find the p value for a right tailed test of hypothesis for a mean when the test statistic has been calculated as 2 1694 and the sample size is 14 Op value 0 0005 0 0005 p value 0 005 0 005 p value 0 01 0 01 p value 0 025 0 025 p value 0 05 0 05 p value 0 10 p value 0 10 Find the p value for a two tailed test of hypothesis for a mean when the test statistic has been calculated as 1 7662 and the sample size is 10 p value 0 001 0 001 p value 0 01 0 01 p value 0 02 0 02 p value 0 05 0 05 p value 0 10 0 10 p value 0 20 p value 0 20 Find the p value for a two tailed test of hypothesis for a mean when the test statistic has been calculated as 2 5931 and the sample size is 99 p value 0 001 0 001 p value 0 01 0 01 p value 0 02 0 02 p value 0 05 0 05 p value 0 10

Statistics
StatisticsA filmologist is currently writing a report about feature films in the late 2010s As a part of her research the filmologist would like to estimate the mean length of feature films in the late 2010s A random sample of 266 feature films from the 2010s was selected and the average of the sample was found to be 104 minutes Suppose the standard deviation of the lengths of all feature films in the late 2010s is known to be 8 5 minutes Find three different confidence intervals one with a 99 confidence level one with a 95 confidence level and one with a 90 confidence level for the average length of all feature films in the late 2010s Notice how the confidence level affects the margin of error and the width of the interval Report confidence interval solutions using interval notation Round solutions to three decimal places if necessary The margin of error for a 99 confidence interval is given by E A 99 confidence interval is given by The margin of error for a 95 confidence interval is given by E A 95 confidence interval is given by The margin of error for a 90 confidence interval is given by E A 90 confidence interval is given by If the level of confidence is decreased leaving all other characteristics constant the margin of error of the confidence interval will Select an answer If the level of confidence is decreased leaving all other characteristics constant the width of the confidence interval will Select an answer
Statistics
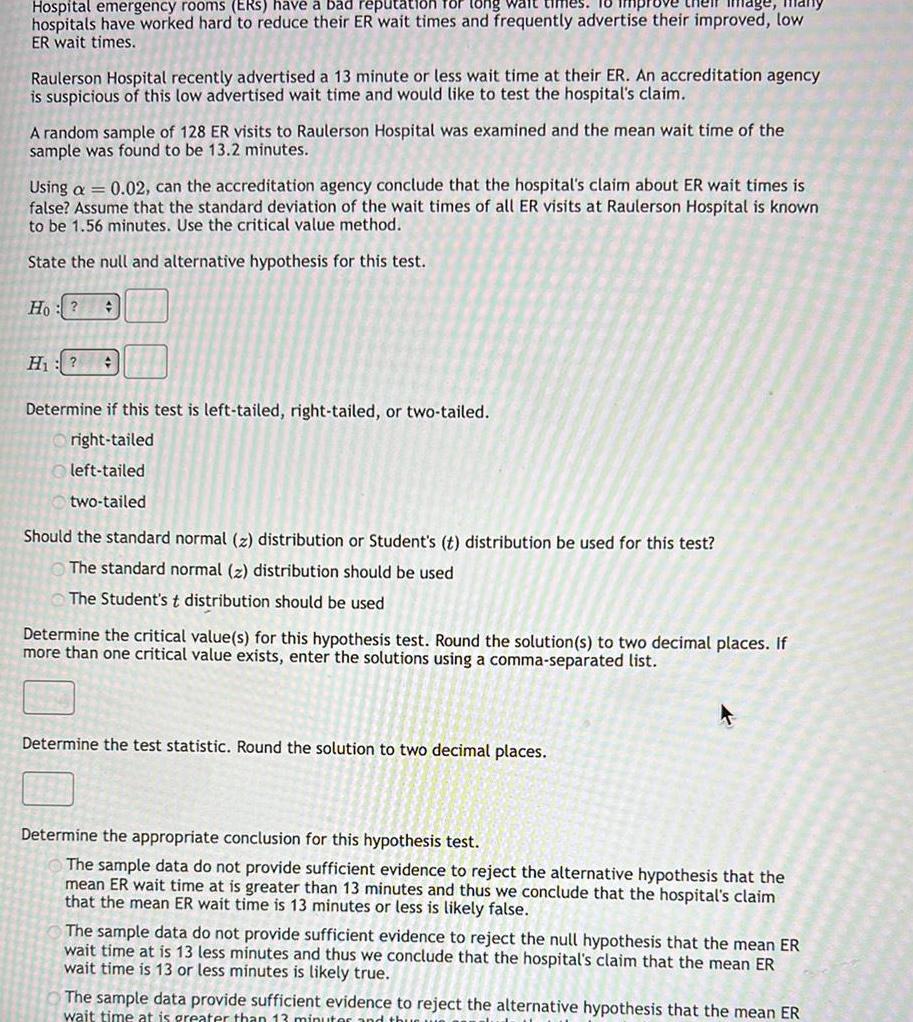
StatisticsImage Hospital emergency rooms ERS have a bad reputation for long wait times hospitals have worked hard to reduce their ER wait times and frequently advertise their improved low ER wait times Raulerson Hospital recently advertised a 13 minute or less wait time at their ER An accreditation agency is suspicious of this low advertised wait time and would like to test the hospital s claim A random sample of 128 ER visits to Raulerson Hospital was examined and the mean wait time of the sample was found to be 13 2 minutes Using a 0 02 can the accreditation agency conclude that the hospital s claim about ER wait times is false Assume that the standard deviation of the wait times of all ER visits at Raulerson Hospital is known to be 1 56 minutes Use the critical value method State the null and alternative hypothesis for this test Ho H Determine if this test is left tailed right tailed or two tailed right tailed left tailed two tailed Should the standard normal z distribution or Student s t distribution be used for this test The standard normal z distribution should be used The Student s t distribution should be used Determine the critical value s for this hypothesis test Round the solution s to two decimal places If more than one critical value exists enter the solutions using a comma separated list Determine the test statistic Round the solution to two decimal places Determine the appropriate conclusion for this hypothesis test The sample data do not provide sufficient evidence to reject the alternative hypothesis that the mean ER wait time at is greater than 13 minutes and thus we conclude that the hospital s claim that the mean ER wait time is 13 minutes or less is likely false or less is likely The sample data do not provide sufficient evidence to reject the null hypothesis that the mean ER wait time at is 13 less minutes and thus we conclude that the hospital s claim that the mean ER wait time is 13 or less minutes is likely true The sample data provide sufficient evidence to reject the alternative hypothesis that the mean ER wait time at is greater than 13 minuter and
Statistics
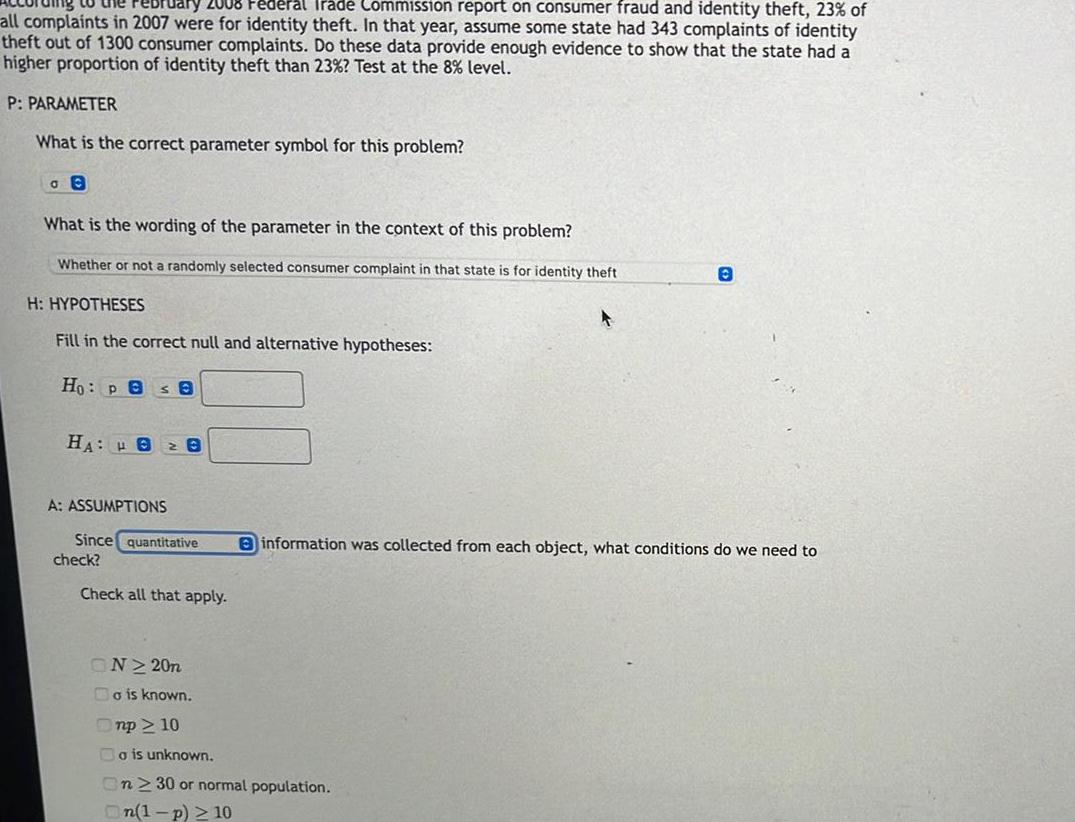
StatisticsJary 2008 Federal Trade Commission report on consumer fraud and identity theft 23 of all complaints in 2007 were for identity theft In that year assume some state had 343 complaints of identity theft out of 1300 consumer complaints Do these data provide enough evidence to show that the state had a higher proportion of identity theft than 23 Test at the 8 level P PARAMETER What is the correct parameter symbol for this problem GO What is the wording of the parameter in the context of this problem Whether or not a randomly selected consumer complaint in that state is for identity theft H HYPOTHESES Fill in the correct null and alternative hypotheses Ho Pes 8 HA 82 8 A ASSUMPTIONS Since quantitative check Check all that apply ON220n Bo is known Onp 10 A o is unknown n 30 or normal population On 1 p 10 0 information was collected from each object what conditions do we need to
Statistics
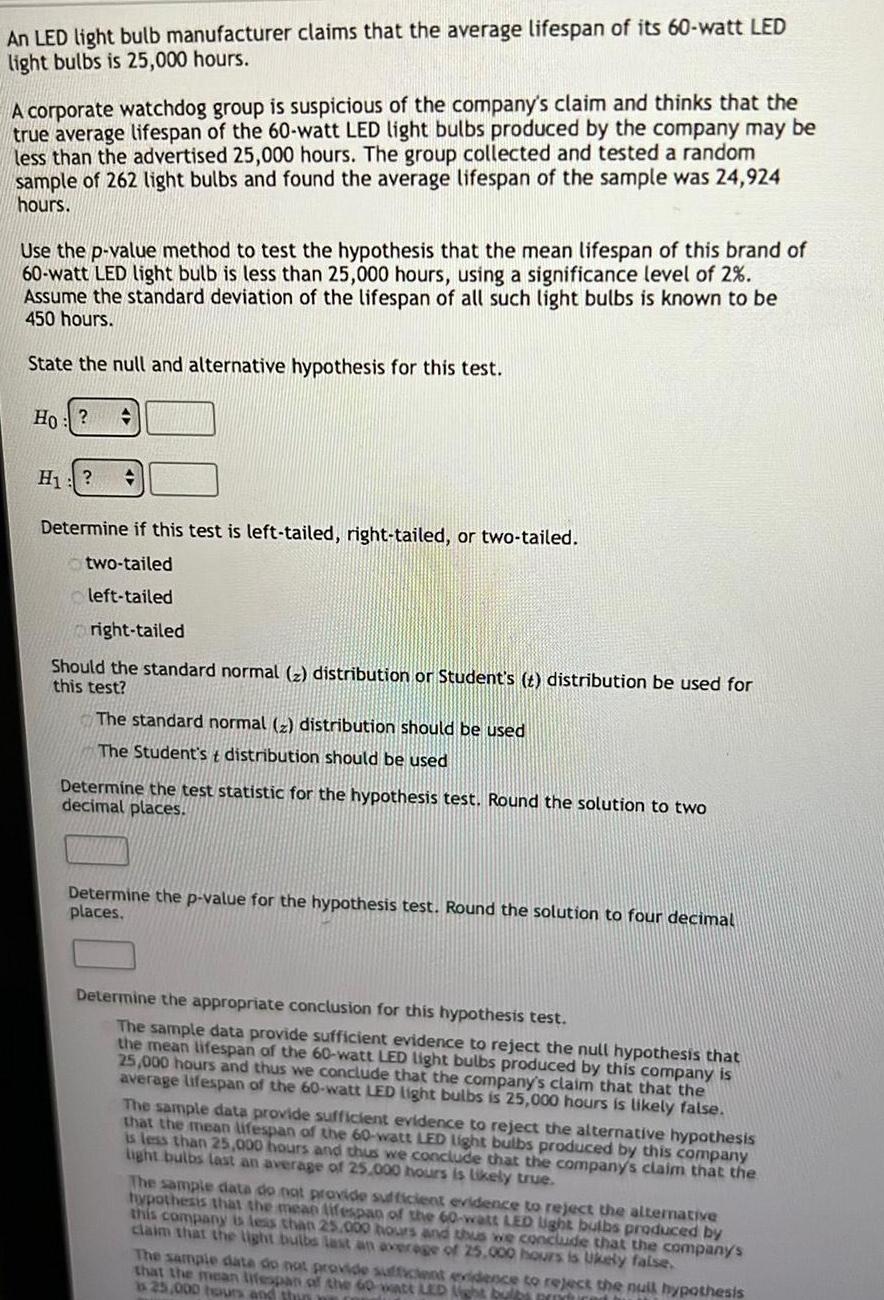
StatisticsAn LED light bulb manufacturer claims that the average lifespan of its 60 watt LED light bulbs is 25 000 hours A corporate watchdog group is suspicious of the company s claim and thinks that the true average lifespan of the 60 watt LED light bulbs produced by the company may be less than the advertised 25 000 hours The group collected and tested a random sample of 262 light bulbs and found the average lifespan of the sample was 24 924 hours Use the p value method to test the hypothesis that the mean lifespan of this brand of 60 watt LED light bulb is less than 25 000 hours using a significance level of 2 Assume the standard deviation of the lifespan of all such light bulbs is known to be 450 hours State the null and alternative hypothesis for this test Ho H Determine if this test is left tailed right tailed or two tailed two tailed left tailed right tailed Should the standard normal z distribution or Student s t distribution be used for this test The standard normal distribution should be used The Student st distribution should be used Determine the test statistic for the hypothesis test Round the solution to two decimal places Determine the p value for the hypothesis test Round the solution to four decimal places Determine the appropriate conclusion for this hypothesis test The sample data provide sufficient evidence to reject the null hypothesis that the mean lifespan of the 60 watt LED light bulbs produced by this company is 25 000 hours and thus we conclude that the company s claim that that the average lifespan of the 60 watt LED light bulbs is 25 000 hours is likely false The sample data provide sufficient evidence to reject the alternative hypothesis that the mean lifespan of the 60 watt LED light bulbs produced by this company is less than 25 000 hours and thus we conclude that the company s claim that the light bulbs last an average of 25 000 hours is likely true The sample data do not provide sufficient evidence to reject the alternative hypothesis that the mean lifespan of the 60 watt LED light bulbs produced by this company is less than 25 000 hours and thus we conclude that the company s claim that the light bulbs last an average of 25 000 hours is Ukely false The sample date do not provide sufficient evidence to reject the null hypothesis that the mean lifespan of the 60 watt LED light bulbs n is 25 000 hours and thin

Statistics
StatisticsGiven the five number summary for the distribution and then draw a box and whisker plot a Give the five number summary for the distribution and b draw a box and whisker plot 6 20 25 17 26 35 16 19 41 28 35 39 46 46 55 m
Statistics
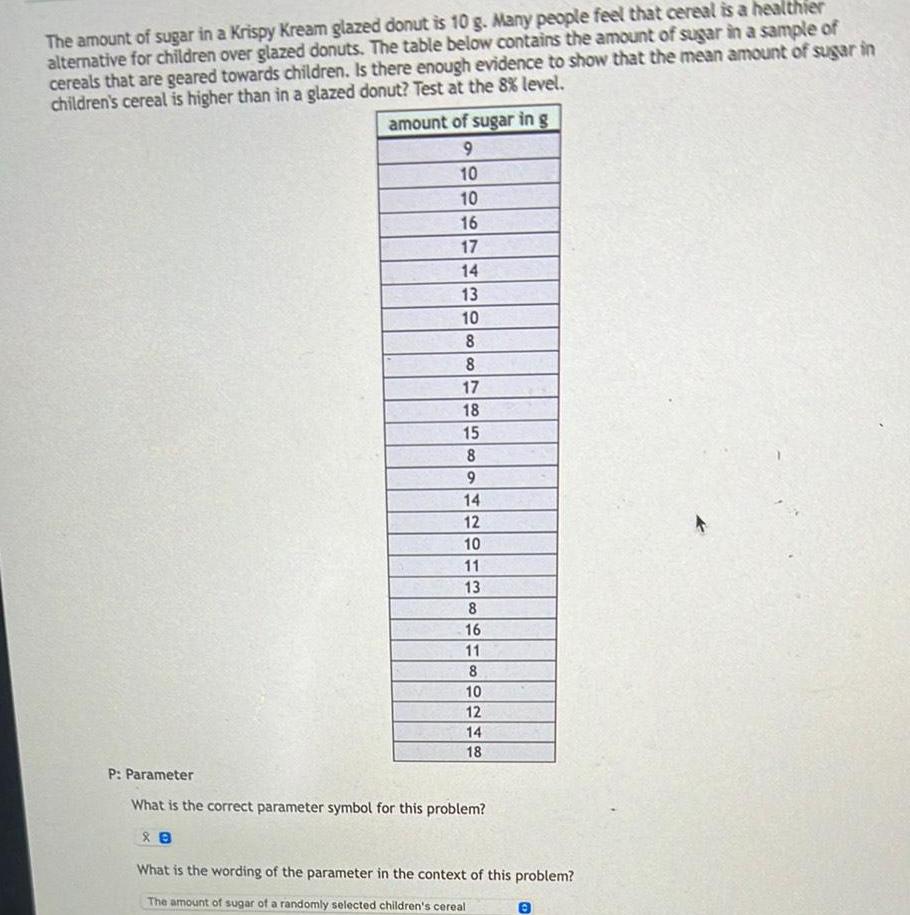
ProbabilityThe amount of sugar in a Krispy Kream glazed donut is 10 g Many people feel that cereal is a healthier alternative for children over glazed donuts The table below contains the amount of sugar in a sample of cereals that are geared towards children Is there enough evidence to show that the mean amount of sugar in children s cereal is higher than in a glazed donut Test at the 8 level amount of sugar in g 9 10 10 16 17 14 13 10 8 8 17 18 15 8 9 14 12 88 10 11 13 8 16 11 8 10 12 14 18 P Parameter What is the correct parameter symbol for this problem What is the wording of the parameter in the context of this problem The amount of sugar of a randomly selected children s cereal
Statistics
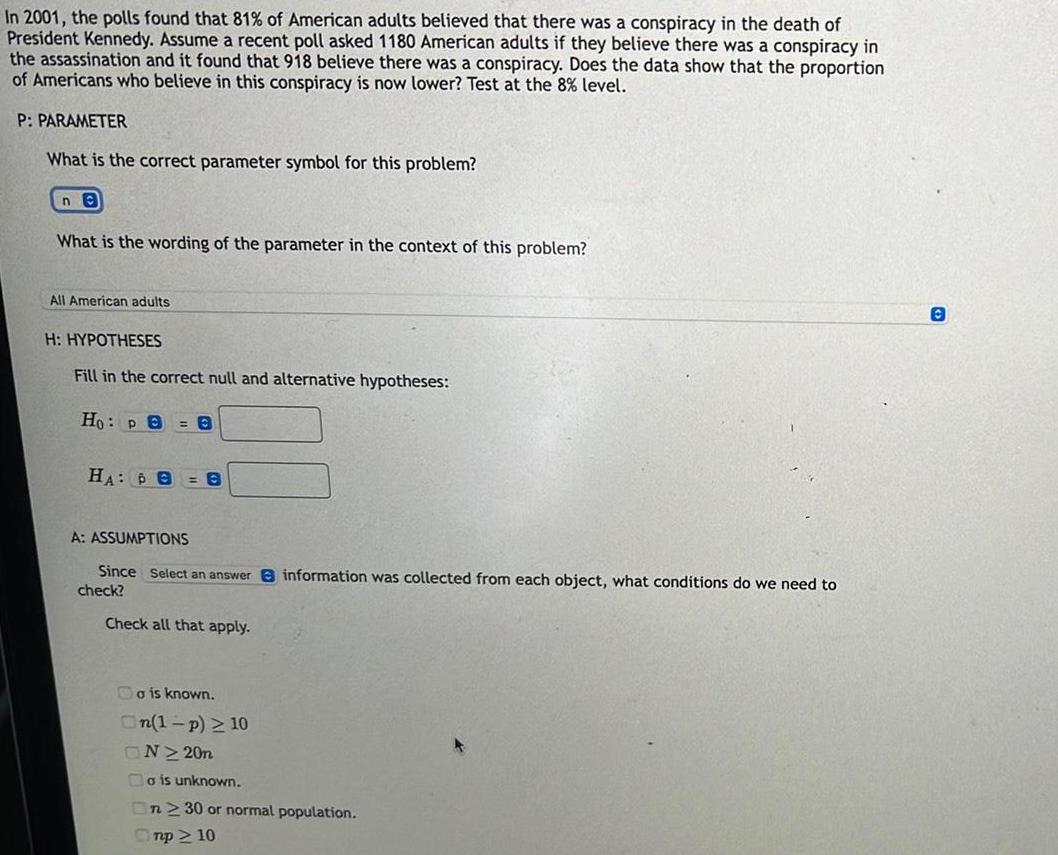
StatisticsIn 2001 the polls found that 81 of American adults believed that there was a conspiracy in the death of President Kennedy Assume a recent poll asked 1180 American adults if they believe there was a conspiracy in the assassination and it found that 918 believe there was a conspiracy Does the data show that the proportion of Americans who believe in this conspiracy is now lower Test at the 8 level P PARAMETER What is the correct parameter symbol for this problem ne What is the wording of the parameter in the context of this problem All American adults H HYPOTHESES Fill in the correct null and alternative hypotheses Ho pe 0 HA B 0 A ASSUMPTIONS Since Select an answer information was collected from each object what conditions do we need to check Check all that apply o is known On 1 p 10 ON 20n o is unknown On 230 or normal population mp 10 O
Statistics
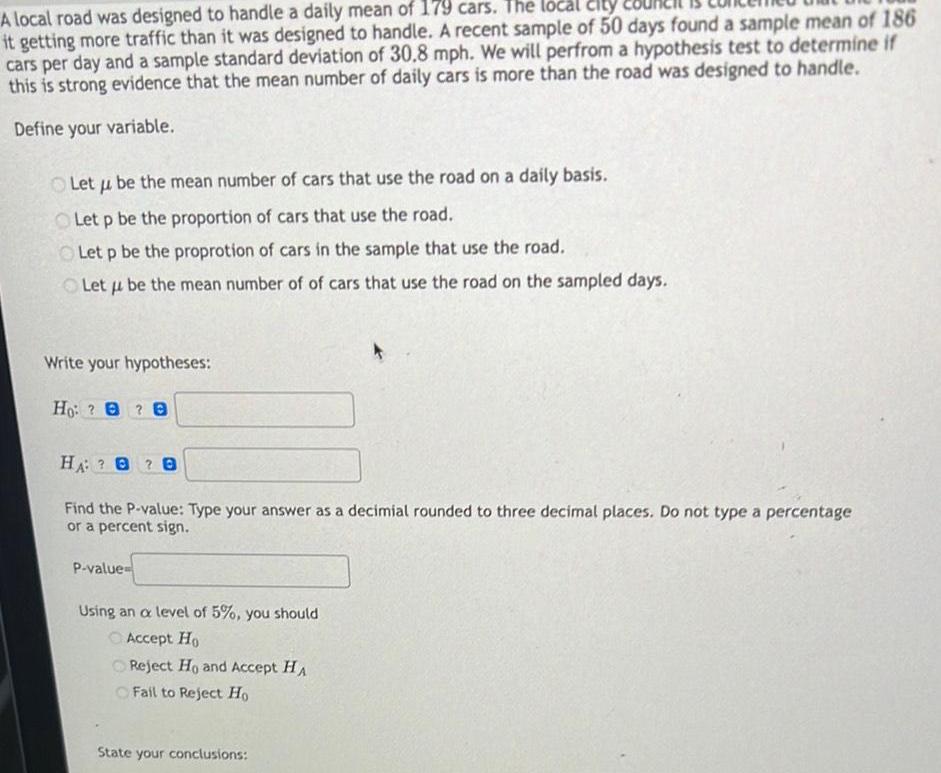
StatisticsA local road was designed to handle a daily mean of 179 cars The local city it getting more traffic than it was designed to handle A recent sample of 50 days found a sample mean of 186 cars per day and a sample standard deviation of 30 8 mph We will perfrom a hypothesis test to determine if this is strong evidence that the mean number of daily cars is more than the road was designed to handle Define your variable Let u be the mean number of cars that use the road on a daily basis Let p be the proportion of cars that use the road Let p be the proprotion of cars in the sample that use the road Let u be the mean number of of cars that use the road on the sampled days Write your hypotheses Ho 8 HA B Find the P value Type your answer as a decimial rounded to three decimal places Do not type a percentage or a percent sign P value Using an a level of 5 you should Accept Ho Reject Ho and Accept HA Fail to Reject Ho State your conclusions
Statistics
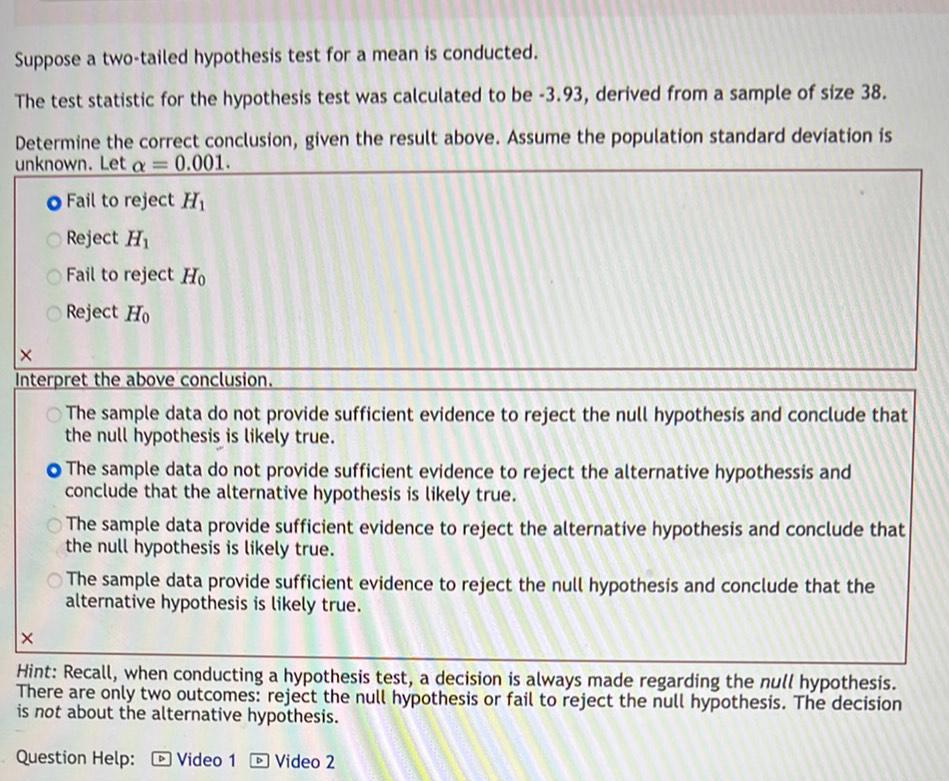
StatisticsSuppose a two tailed hypothesis test for a mean is conducted The test statistic for the hypothesis test was calculated to be 3 93 derived from a sample of size 38 Determine the correct conclusion given the result above Assume the population standard deviation is unknown Let a 0 001 O Fail to reject H Reject H Fail to reject Ho Reject Ho X Interpret the above conclusion The sample data do not provide sufficient evidence to reject the null hypothesis and conclude that the null hypothesis is likely true O The sample data do not provide sufficient evidence to reject the alternative hypothessis and conclude that the alternative hypothesis is likely true The sample data provide sufficient evidence to reject the alternative hypothesis and conclude that the null hypothesis is likely true The sample data provide sufficient evidence to reject the null hypothesis and conclude that the alternative hypothesis is likely true X Hint Recall when conducting a hypothesis test a decision is always made regarding the null hypothesis There are only two outcomes reject the null hypothesis or fail to reject the null hypothesis The decision is not about the alternative hypothesis Question Help Video 1 Video 2
Statistics
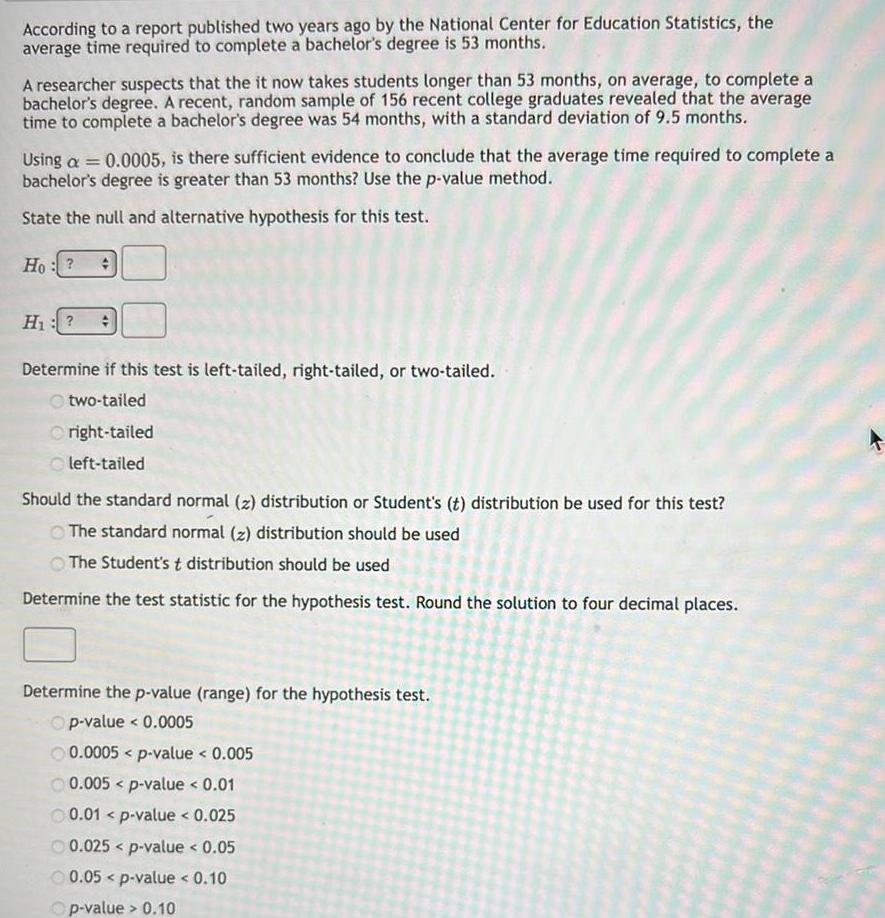
StatisticsAccording to a report published two years ago by the National Center for Education Statistics the average time required to complete a bachelor s degree is 53 months A researcher suspects that the it now takes students longer than 53 months on average to complete a bachelor s degree A recent random sample of 156 recent college graduates revealed that the average time to complete a bachelor s degree was 54 months with a standard deviation of 9 5 months Using a 0 0005 is there sufficient evidence to conclude that the average time required to complete a bachelor s degree is greater than 53 months Use the p value method State the null and alternative hypothesis for this test Ho H Determine if this test is left tailed right tailed or two tailed two tailed Oright tailed left tailed Should the standard normal z distribution or Student s t distribution be used for this test The standard normal z distribution should be used The Student s t distribution should be used Determine the test statistic for the hypothesis test Round the solution to four decimal places Determine the p value range for the hypothesis test Op value 0 0005 0 0005 p value 0 005 0 005 p value 0 01 0 01 p value 0 025 0 025 p value 0 05 0 05 p value 0 10 Op value 0 10
Statistics
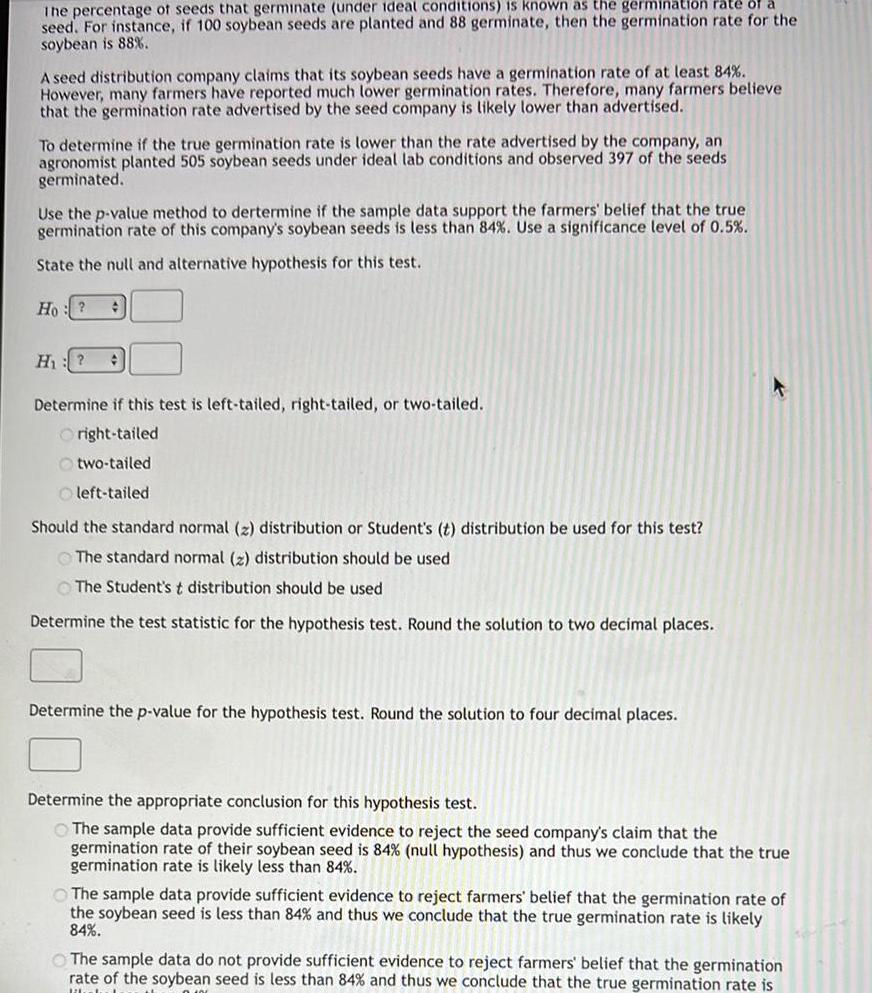
StatisticsThe percentage of seeds that germinate under ideal conditions is known as the germination rate of a seed For instance if 100 soybean seeds are planted and 88 germinate then the germination rate for the soybean is 88 A seed distribution company claims that its soybean seeds have a germination rate of at least 84 However many farmers have reported much lower germination rates Therefore many farmers believe that the germination rate advertised by the seed company is likely lower than advertised To determine if the true germination rate is lower than the rate advertised by the company an agronomist planted 505 soybean seeds under ideal lab conditions and observed 397 of the seeds germinated Use the p value method to dertermine if the sample data support the farmers belief that the true germination rate of this company s soybean seeds is less than 84 Use a significance level of 0 5 State the null and alternative hypothesis for this test Ho H Determine if this test is left tailed right tailed or two tailed Oright tailed Otwo tailed left tailed Should the standard normal z distribution or Student s t distribution be used for this test The standard normal 2 distribution should be used The Student s t distribution should be used Determine the test statistic for the hypothesis test Round the solution to two decimal places Determine the p value for the hypothesis test Round the solution to four decimal places Determine the appropriate conclusion for this hypothesis test The sample data provide sufficient evidence to reject the seed company s claim that the germination rate of their soybean seed is 84 null hypothesis and thus we conclude that the true germination rate is likely less than 84 The sample data provide sufficient evidence to reject farmers belief that the germination rate of the soybean seed is less than 84 and thus we conclude that the true germination rate is likely 84 The sample data do not provide sufficient evidence to reject farmers belief that the germination rate of the soybean seed is less than 84 and thus we conclude that the true germination rate is libbel
Statistics
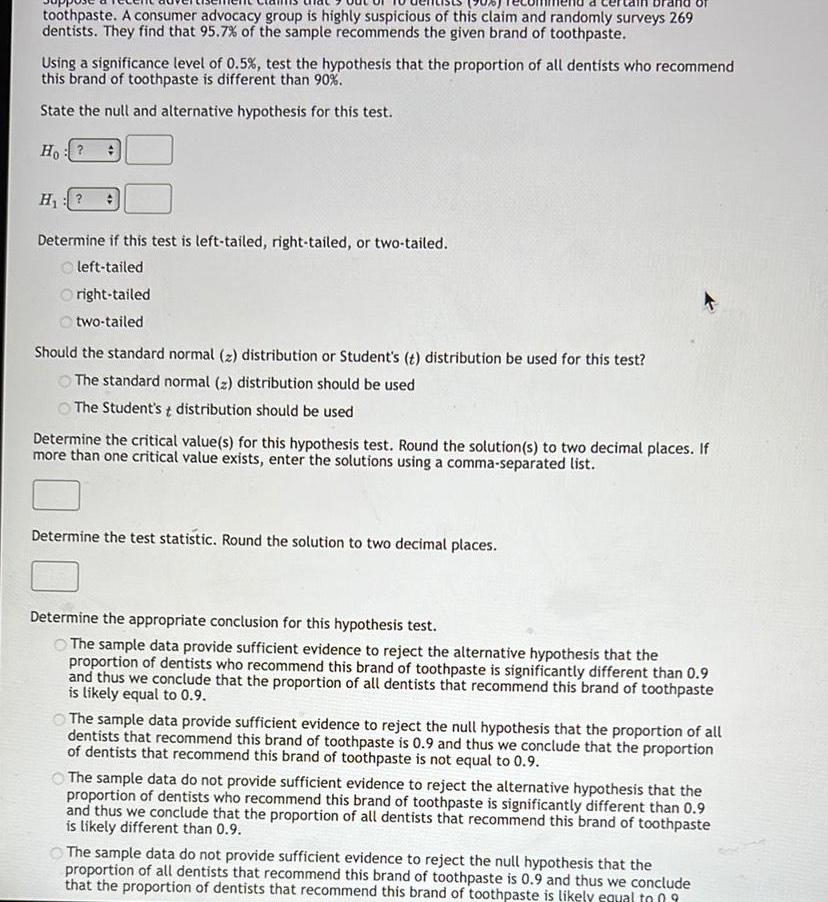
Statisticstoothpaste A consumer advocacy group is highly suspicious of this claim and randomly surveys 269 dentists They find that 95 7 of the sample recommends the given brand of toothpaste Using a significance level of 0 5 test the hypothesis that the proportion of all dentists who recommend this brand of toothpaste is different than 90 State the null and alternative hypothesis for this test Ho H Determine if this test is left tailed right tailed or two tailed Oleft tailed right tailed two tailed Should the standard normal z distribution or Student s t distribution be used for this test The standard normal z distribution should be used The Student s t distribution should be used Determine the critical value s for this hypothesis test Round the solution s to two decimal places If more than one critical value exists enter the solutions using a comma separated list Determine the test statistic Round the solution to two decimal places Determine the appropriate conclusion for this hypothesis test The sample data provide sufficient evidence to reject the alternative hypothesis that the proportion of dentists who recommend this brand of toothpaste is significantly different than 0 9 and thus we conclude that the proportion of all dentists that recommend this brand of toothpaste is likely equal to 0 9 The sample data provide sufficient evidence to reject the null hypothesis that the proportion of all dentists that recommend this brand of toothpaste is 0 9 and thus we conclude that the proportion of dentists that recommend this brand of toothpaste is not equal to 0 9 The sample data do not provide sufficient evidence to reject the alternative hypothesis that the proportion of dentists who recommend this brand of toothpaste is significantly different than 0 9 and thus we conclude that the proportion of all dentists that recommend this brand of toothpaste is likely different than 0 9 The sample data do not provide sufficient evidence to reject the null hypothesis that the proportion of all dentists that recommend this brand of toothpaste is 0 9 and thus we conclude that the proportion of dentists that recommend this brand of toothpaste is likely equal to 09
Statistics
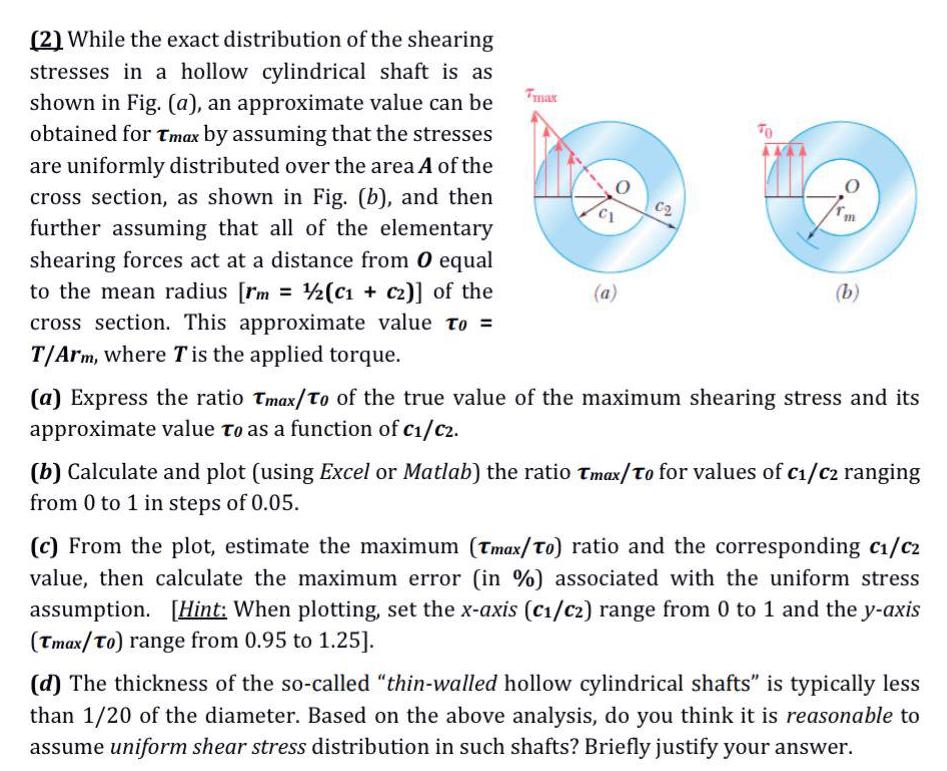
Statistics2 While the exact distribution of the shearing stresses in a hollow cylindrical shaft is as shown in Fig a an approximate value can be obtained for Tmax by assuming that the stresses are uniformly distributed over the area A of the cross section as shown in Fig b and then further assuming that all of the elementary shearing forces act at a distance from O equal to the mean radius rm 1 2 C1 c2 of the cross section This approximate value to T Arm where T is the applied torque a C2 O b a Express the ratio Tmax To of the true value of the maximum shearing stress and its approximate value to as a function of C C2 b Calculate and plot using Excel or Matlab the ratio Tmax To for values of c C ranging from 0 to 1 in steps of 0 05 c From the plot estimate the maximum Tmax To ratio and the corresponding c C2 value then calculate the maximum error in associated with the uniform stress assumption Hint When plotting set the x axis C C2 range from 0 to 1 and the y axis Tmax To range from 0 95 to 1 25 d The thickness of the so called thin walled hollow cylindrical shafts is typically less than 1 20 of the diameter Based on the above analysis do you think it is reasonable to assume uniform shear stress distribution in such shafts Briefly justify your answer
Statistics
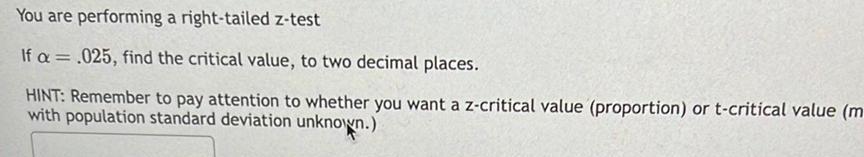
ProbabilityYou are performing a right tailed z test If a 025 find the critical value to two decimal places HINT Remember to pay attention to whether you want a z critical value proportion or t critical value m with population standard deviation unknown
Statistics
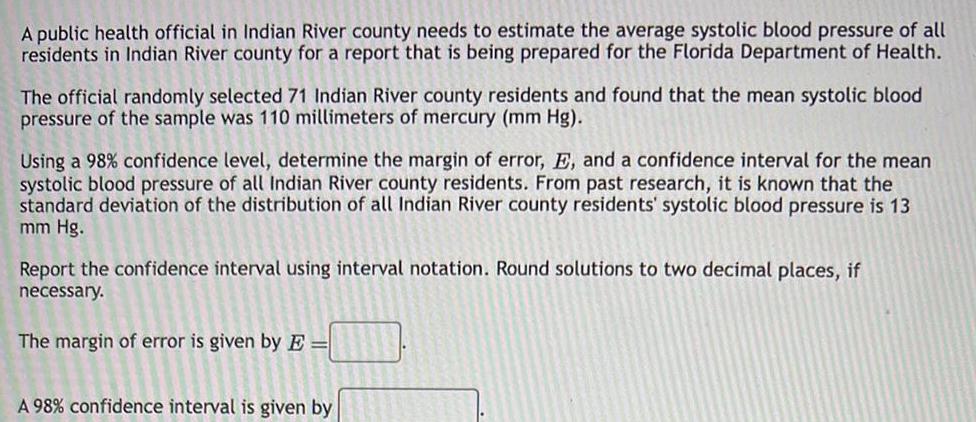
ProbabilityA public health official in Indian River county needs to estimate the average systolic blood pressure of all residents in Indian River county for a report that is being prepared for the Florida Department of Health The official randomly selected 71 Indian River county residents and found that the mean systolic blood pressure of the sample was 110 millimeters of mercury mm Hg Using a 98 confidence level determine the margin of error E and a confidence interval for the mean systolic blood pressure of all Indian River county residents From past research it is known that the standard deviation of the distribution of all Indian River county residents systolic blood pressure is 13 mm Hg Report the confidence interval using interval notation Round solutions to two decimal places if necessary The margin of error is given by E A 98 confidence interval is given by
Statistics
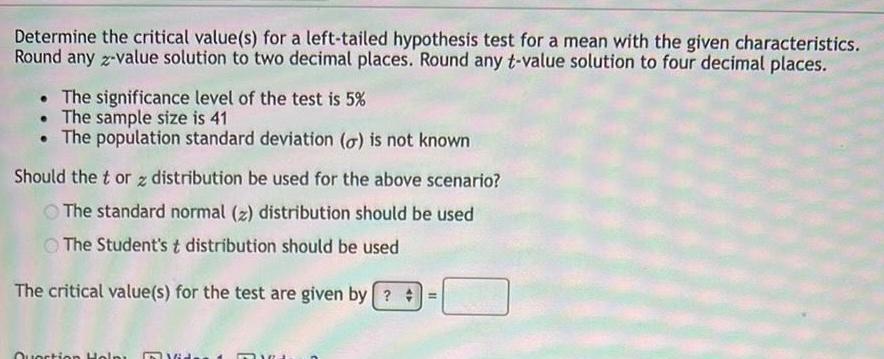
StatisticsDetermine the critical value s for a left tailed hypothesis test for a mean with the given characteristics Round any z value solution to two decimal places Round any t value solution to four decimal places The significance level of the test is 5 The sample size is 41 The population standard deviation o is not known Should the tor z distribution be used for the above scenario The standard normal z distribution should be used The Student s t distribution should be used The critical value s for the test are given by Question Help 16 TRA
Statistics
StatisticsAn adviser in student services would like to estimate the average monthly car payment of all IRSC students From past research it is known that the standard deviation of the distribution of all IRSC student car payments is 47 Determine the sample size necessary such that the margin of error of the estimate for a 96 confidence interval for the average monthly car payment of all IRSC students is at most 6 16 Round the solution up to the nearest whole number n
Statistics
StatisticsA forester with the National Park Service was tasked with estimating the average age of the bald cypress trees Taxodium distichum in Big Cypress Swamp a region in Everglades National Park The forester extracted core samples from 48 randomly selected bald cypress trees in Big Cypress Swamp The mean age of the sample was 338 3 years with a standard deviation of 20 5 years Using a 98 confidence level determine the margin of error E and a confidence interval for the average age of all bald cypress trees in Big Cypress Swamp Report the confidence interval using interval notation Round solutions to two decimal places if necessary The margin of error is given by E A 98 confidence interval is given by
Statistics
ProbabilityAn epidemiologist with the Florida Department of Health needs to estimate the proportion of Floridians who are infected with the corona virus but are asymptomatic show no signs of the virus The epidemiologist compiled a preliminary random sample of infected patients and found that 47 of the sample were also asymptomatic How large a sample should be selected such that the margin of error of the estimate for a 96 confidence interval is at most 4 43 Round the solution up to the nearest whole number n
Statistics
StatisticsSuppose a hypothesis test was conducted for a proportion using a signifance level of 0 5 The p value for the test was calculated to be p 0 0039 Determine the correct conclusion given the result above Reject Ho O Fail to reject H Reject H O Fail to reject Ho Interpret the above conclusion The sample data do not provide sufficient evidence to reject the alternative hypothessis and conclude that the alternative hypothesis is likely true The sample data provide sufficient evidence to reject the alternative hypothesis and conclude that the null hypothesis is likely true The sample data provide sufficient evidence to reject the null hypothesis and conclude that the alternative hypothesis is likely true The sample data do not provide sufficient evidence to reject the null hypothesis and conclude that the null hypothesis is likely true
Statistics
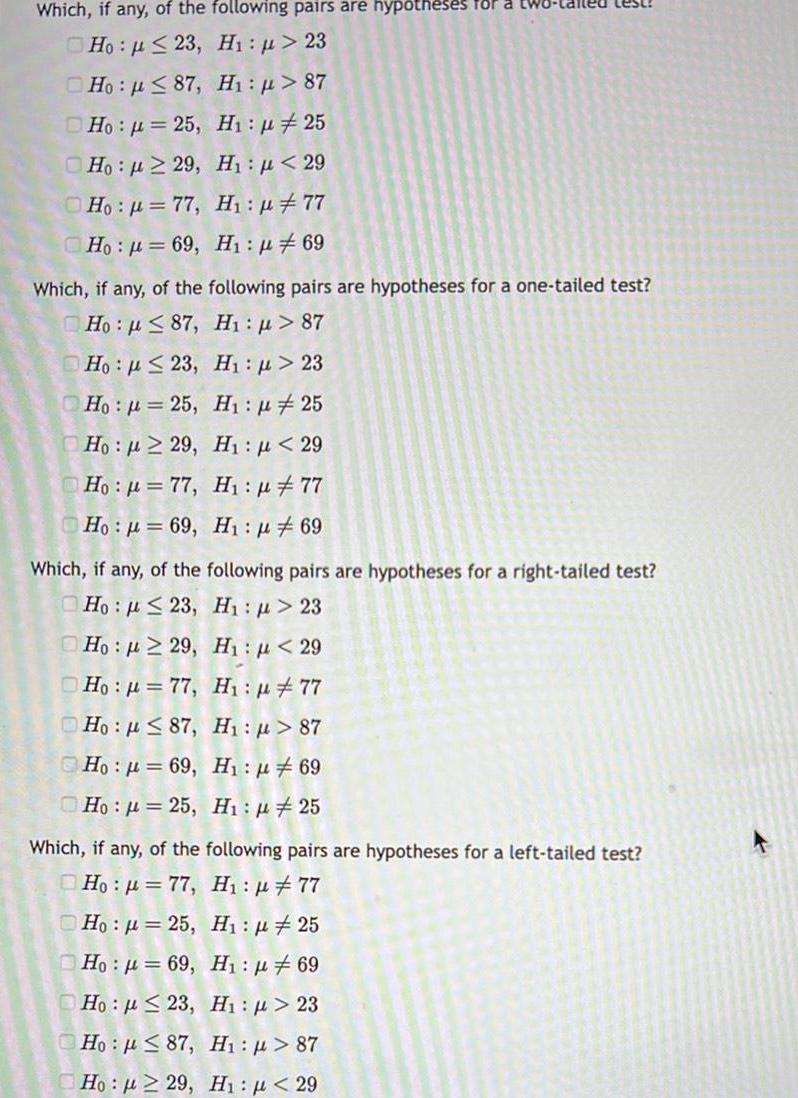
ProbabilityWhich if any of the following pairs are hypotheses for Ho p 23 Hi p 23 Ho 87 H p 87 Ho 25 H 25 Ho 229 H 29 H p 77 Ho p 77 Ho 69 H 69 Which if any of the following pairs are hypotheses for a one tailed test Ho 87 H 87 Ho 23 H 23 Ho 25 Ho 29 00 H 25 H 29 Hop 77 H 77 Ho 69 H 69 Which if any of the following pairs are hypotheses for a right tailed test Ho 23 H 23 Ho 29 H 29 Ho 77 H 77 Ho 87 H 87 Ho 69 H 69 Ho 25 Hi 25 Which if any of the following pairs are hypotheses for a left tailed test Ho 77 H 77 Ho 25 H1 25 Ho 69 H 69 Ho 23 Hi p 23 H p 87 Hn p 87 H p 29 H1 29
Statistics
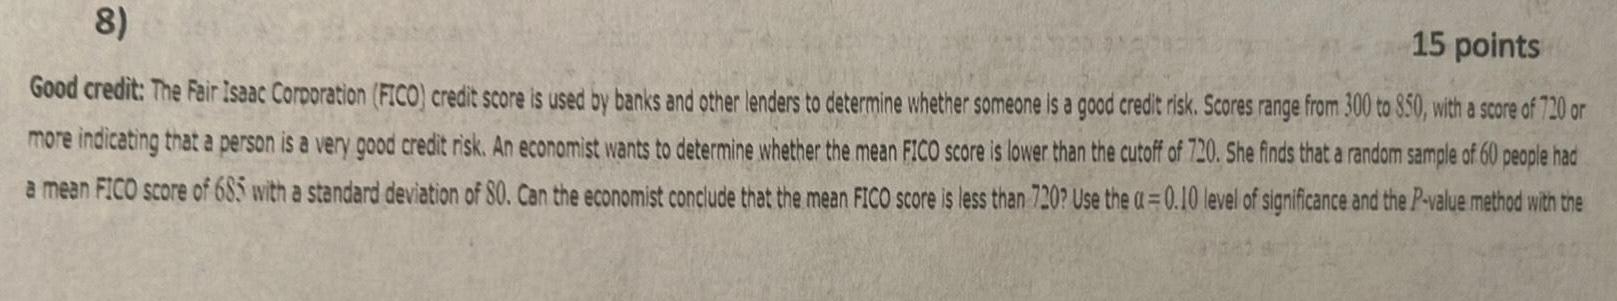
Statistics15 points 8 Good credit The Fair Isaac Corporation FICO credit score is used by banks and other lenders to determine whether someone is a good credit risk Scores range from 300 to 850 with a score of 720 or more indicating that a person is a very good credit risk An economist wants to determine whether the mean FICO score is lower than the cutoff of 720 She finds that a random sample of 60 people had a mean FICO score of 685 with a standard deviation of 80 Can the economist conclude that the mean FICO score is less than 720 Use the a 0 10 level of significance and the P value method with the
Statistics
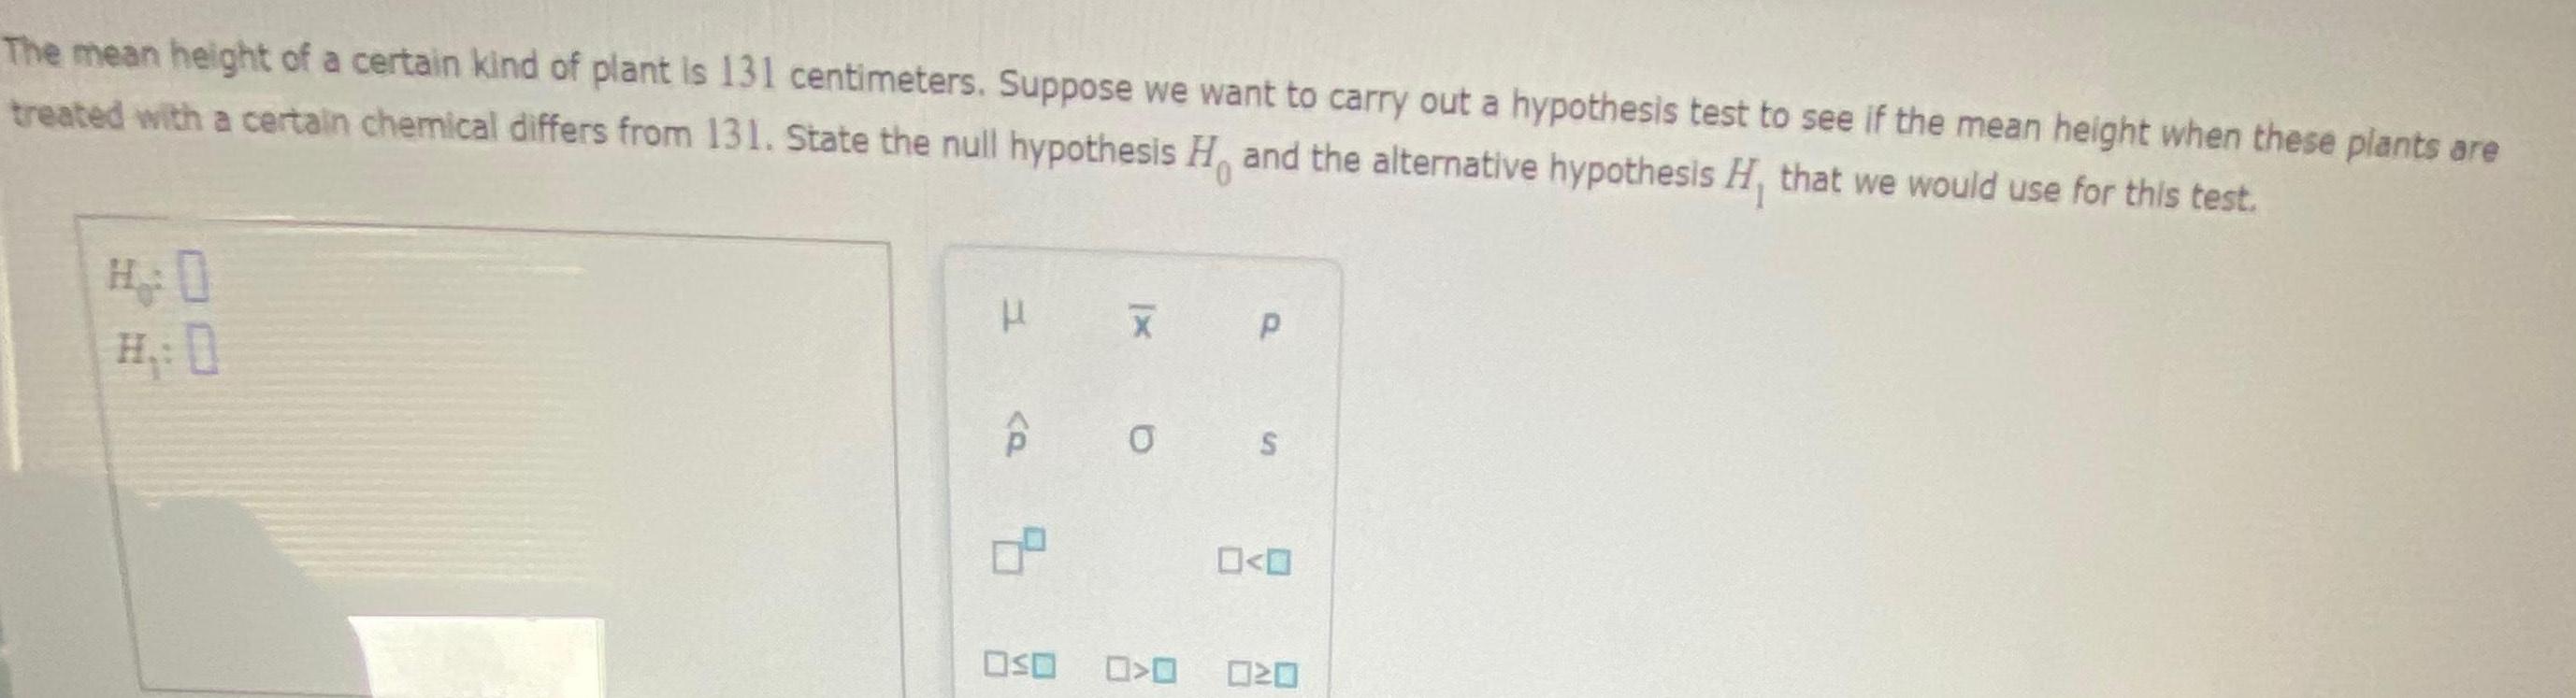
StatisticsThe mean height of a certain kind of plant is 131 centimeters Suppose we want to carry out a hypothesis test to see if the mean height when these plants are treated with a certain chemical differs from 131 State the null hypothesis H and the alternative hypothesis H that we would use for this test OSO 0 P S 0 0 O O 020
Statistics
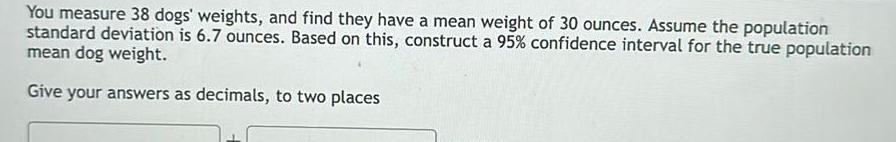
ProbabilityYou measure 38 dogs weights and find they have a mean weight of 30 ounces Assume the population standard deviation is 6 7 ounces Based on this construct a 95 confidence interval for the true population mean dog weight Give your answers as decimals to two places

Statistics
Statistics9 15 points Cable TV choices A telecommunications company provided Its cable TV subscribers with free access to a new sports channel for a period of one month It then chose a sample of 400 television viewers and asked them whether they would be willing to pay an extra 10 per month to continue to access the channel A total of 28 of the 400 replied that they would be willing to pay The marketing director of the company claims that less than 9 of all its subscribers would pay for the channel Can you conclude that the director s claim is true Use the a 0 10 level of significance and the P value method with the table