Statistics Questions
The best high school and college tutors are just a click away, 24×7! Pick a subject, ask a question, and get a detailed, handwritten solution personalized for you in minutes. We cover Math, Physics, Chemistry & Biology.

Statistics
StatisticsRecently we investigated a scatterplot on Gapminder org The table below shows the Income per capita in thousands of dollars per year and Life Expectancy in years some of the countries that were on the graph in 2019 Income x 1 9 3 16 7 23 8 48 14 3 23 Use three decimal places for the following questions a Find the sample correlation coefficient r 0 969 Life Expectancy y 69 1 66 7 69 5 70 8 75 9 80 b Find the equation of the line of best fit Write the equation in the box below

Statistics
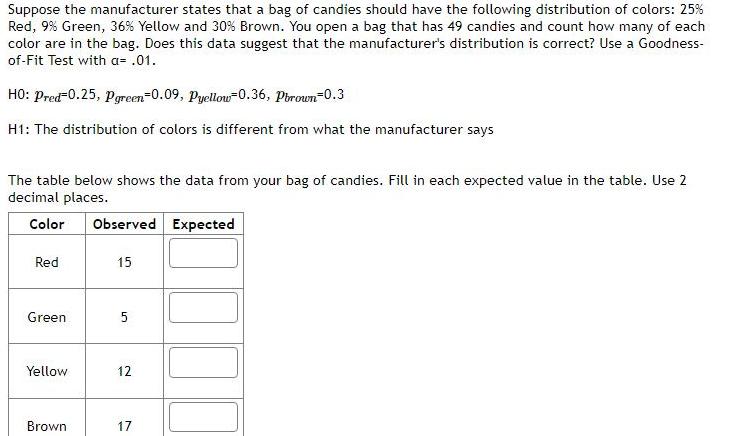
StatisticsSuppose the manufacturer states that a bag of candies should have the following distribution of colors 25 Red 9 Green 36 Yellow and 30 Brown You open a bag that has 49 candies and count how many of each color are in the bag Does this data suggest that the manufacturer s distribution is correct Use a Goodness of Fit Test with a 01 HO Pred 0 25 Pgreen 0 09 Pyellow 0 36 Pbrown 0 3 H1 The distribution of colors is different from what the manufacturer says The table below shows the data from your bag of candies Fill in each expected value in the table Use 2 decimal places Color Observed Red Green Yellow Brown 15 5 12 17 Expected 15 49 49 49 17 49 What is the chi square test statistic for this data Use 3 decimal places x

Statistics
StatisticsIn a sample of 380 adults 242 dressed up for Halloween this year even though they had to socially distance Construct a 99 confidence interval for the true population proportion of adults who dressed up for Halloween a Give your answers as decimals to three places 0 573 p 0 700 b Choose the correct interpretation of the confidence interval you found There is a 99 chance that the proportion of the population is between the two values I found With 99 confidence the proportion of all adults who dressed up for Halloween is between the two values I found There is a 99 chance that the proportion of people who dressed up for Halloween this year from the 390 adults sampled will be between the two values I found With 99 confidence a randomly selected adult dresses up for Halloween some percentage of time somewhere between the two values I found c To the best of your ability explain how you found the values in the confidence interval in the last question You may want to tell me which formula you used what you plugged in to the formula etc Partial credit may be awarded for any parts in this explanation that are correct even if your final answer was incorrect

Statistics
ProbabilityAt an unconventional casino you bet on the roll of an 18 sided die If you roll a 7 you win 2 If you roll a 1 or 18 you win 1 If you roll a 13 you lose 3 If you roll any other number you lose 1 to the casino Let X denote the amount of money you win from playing this game once a Fill in the table to create a probability distribution for X Use fractions or decimals rounded to three decimal places when necessary Please enter values into the table as they were introduced in the paragraph above P x 2 1 3 1 X 18 710 b Find the expected profit Round to the nearest cent two decimal places c Is this game profitable for you How does the expected value tell you whether it is profitable or not

Statistics
StatisticsAl wants to study the customers who eat at his restaurant He randomly selects 39 customers to participate in the study The proportion of customers in the survey who said they loved Al s restaurant was 96 Match he following terms with the correct aspects of the study The true proportion of customers who love Al s All customers who eat at Al s The 39 customers who participated in the study The proportion of the 39 customers who love Al s The answer Yes or No to loving Al s The list of the 39 Yes or No answers for each customer a Statistic b Parameter c Data d Variable e Sample f Population
Statistics
ProbabilitySuppose the manufacturer states that a bag of candies should have the following distribution of colors 25 Red 9 Green 36 Yellow and 30 Brown You open a bag that has 49 candies and count how many of each color are in the bag Does this data suggest that the manufacturer s distribution is correct Use a Goodness of Fit Test with a 01 HO Pred 0 25 Pgreen 0 09 Pyellow 0 36 Pbrown 0 3 H1 The distribution of colors is different from what the manufacturer says The table below shows the data from your bag of candies Fill in each expected value in the table Use 2 decimal places Color Observed Expected 15 Red Green Yellow Brown 5 12 17
Statistics
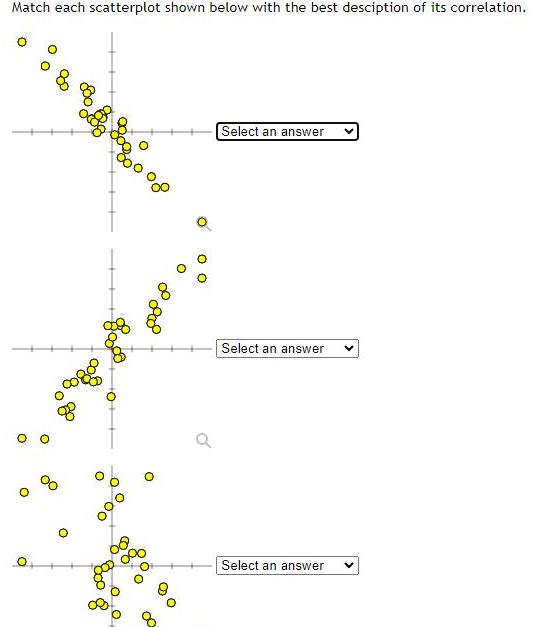
StatisticsMatch each scatterplot shown below with the best desciption of its correlation O O B 200 9 Select an answer Select an answer Select an answer

Statistics
StatisticsStronghold Corporation uses two materials P and Q to manufacture a product The following standards are provided Standard unit price 2 5 Materials P Q Yield Standard Mix 55 units 45 units Yield 68 units During the month of November the following actual production information was provided Materials Actual Mix P 3 000 units Q 2 000 units Standard cost 110 225 3 000 units Required 1 Without computing the yield variance please explain whether the yield variance is favorable or unfavorable

Statistics
Statistics1 Which system of inequalities is graphed below A B D y x 2 y 2x 1 Jy x 2 y 2x 1 Syzx 2 y 2x 1 y x 2 y 2r 1

Statistics
StatisticsSolve the given system of linear equations using the Elimination Method 4x 5y 19 x 5y I16 Be sure to type your solution as an ordered pair Do NOT use the space bar Solution

Statistics
StatisticsA manager is comparing the cost of buying baseball caps from two different companies Company X charges a 50 fee plus 7 per baseball cap Company Y charges a 30 fee plus 9 per baseball cap For what number of baseball caps will the cost be the same at both companies and how much will it cost Write the two equations It will cost for

Statistics
ProbabilityA total of 330 children and adults attended a school play There were 21 times as many children in attendance as there were adults How many children and adults attended Write the Equations Find the number of adults Find the number of children

Statistics
StatisticsFor the holiday season Brookfield Zoo will be setting up for Holiday Magic its annual lights festival Bob s job is to set up lights on various bushes and trees On Monday Bob used 44 strands of light to decorate 2 bushes and 3 trees On Tuesday Bob used 56 strands of lights to decorate 5 bushes and 3 trees Assuming all bushes and all trees are decorated with the same amount of lights how many strands of light did Bob use on each Let x strands of lights on bushes Let y strands of lights on trees a Create Equation 1 which represents the amount of lights used on Monday Equation 1 b Create Equation 2 which represents the amount of lights used on Tuesday Equation 2 c Solve for x X d Use your x value to solve for y y e Bob used strands of lights for each bush and strands of lights

Statistics
Statistics2 1 2 1 2 3 4 3 2 1 0 1 2 1 2 3 10 0 O 1 2 2 3 3 4 4 4 5 5 6 6 7 DRAG DROP THE ANSWER 2 1 6 1 No Solution 0 3 Infinite Solutions 2 3

Statistics
Statistics12 The basketball team sold t shirts and hats as a fund raiser They sold a total of 23 items and made a profit of 246 They made a profit of 10 for every t shirt they sold and 12 for every hat they sold Determine the number of t shirts and the number of hats the basketball team sold Enter the number of t shirts in the first response box Enter the number of hats in the second response box

Statistics
ProbabilityWhat two numbers have a sum of 217 and a difference of 85 Note Write you answer in order from highest to lowest Ex 10 and 8 and

Statistics
ProbabilityWhich graph represents the system of inequalities y 2x 1 y 3x 5 2 2 3 3 5 2 4 S N 2 3 4

Statistics
StatisticsTwo times Antonio s age plus three times Sarah s age equals 34 Sarah s age is also five times Antonio s age How old is Sarah and Antonio Sarah is years old and Antonio is years old 3

Statistics
ProbabilitySolve by substitution or elimination by subtraction or addition 4x 15y 17 4x 20y 52


Statistics
Probabilitystem of inequalities linear inequalities 8 6 B C 4 A 7z 14y 0 8 6 0 61 8 2 is graphed Which region below represents the solution to the system of 4 D 6 M 8

Statistics
StatisticsThe box plot shows the heights of grade 7 students in two random samples from two different schools The sample item from each school is 30 of the student population School A School B B Heights of Grade 7 Students 4 Based on the box plot which comparison is true Grade 7 students from School A are typically shorter than grade 7 students from School B because of the difference in the interquartile ranges of grade 7 student heights at the schools D 52 53 54 55 56 57 58 59 60 61 62 63 64 65 66 Height inches Grade 7 students from School A are typically shorter than grade 7 students from School B because of the difference in t medians of grade 7 student heights at the schools Grade 7 students from School A are typically taller than grade 7 students from School B because of the difference in th interquartile ranges of grade 7 student heights at the schools Grade 7 students from School A are typically taller than grade 7 students from School B because of the difference in medians of grade 7 student heights at the schools

Statistics
Statistics27 Which choice shows a set of data that could be represented by the box plot shown below 0 5 10 A 1 3 5 6 6 8 13 14 19 20 B 1 2 3 5 7 8 8 13 19 20 1 5 5 6 6 6 8 13 19 20 13567 7 8 13 10 20 15 20

Statistics
Probability1 A drawer contains 3 black socks 6 white socks 1 green sock and 10 blue socks Determine the probability of randomly selecting a sock that is not green

Statistics
StatisticsThe dot plot shows the Each dot represents 1 country 7 8 B 18 1 14 19 23 9 What is the mean number of public holidays A 20 17 10 15 11 12 13 Number of Public Holidays 17 18 16 14

Statistics
Statistics7 The dot plot shows the number of public Each dot represents 1 country 7 8 B 18 1 c 14 19 9 What is the mean number of public holidays A 20 17 D 23 10 11 12 13 14 Number of Public Holidays 15 16 DO 17 18

Statistics
StatisticsCorinne is planning a beach vacation in July and is analyzing the daily high temperatures for her potential destination She would like to choose a destination with a high median temperature and a small interquartile range She constructed box plots shown in the diagram below Ocean Beach Serene Shores Whispering Palms 70 75 80 85 90 95 100 70 75 80 85 90 95 100 Which destination has a median temperature above 80 degrees and the smallest interquartile range A Pelican Beach B Ocean Beach D Whispering Palms Pelican Beach Serene Shores

Statistics
Statisticsline plots below to compare the quiz scores for her first period math class and her second period math class She gave the same quiz to each class B QUIZ SCORES First Period Class X X X X X X AHH 0 1 2 3 4 5 6 7 8 9 10 Points X X Second Period Class X X X X X X X X X X X X X X 0 1 2 3 X X 4 5 6 Points 7 8 9 10 What conclusion can Ms Andrews make about the performance of her first and second period classes A The second period class scores had a higher mean than the first period class scores The first period class had a higher median score than the second period class

Statistics
StatisticsB The students in a study group each measured the thickness of their math notebooks The results are shown in the lineplot below A 1 inches 8 1 B 2 inches 2 2 8 7 C 2 inches 8 3 8 Thickness of Notebook inches 3 D 2 inches 8 4 8 If the students stack their notebooks one on top the other what will be the total thickness of the stack 5 8 68

Statistics
ProbabilityA B D 9 Amounts of Trall Mix 15 2 XXXXX 1 4 How much total trail mix in cups did Elijah eat 15 4 Xx Cup xx 3 4

Statistics
ProbabilityThere is a spinner with 18 equal areas number 1 18 If the spinner is spun one time what is the probability that the result is a multiple of 2 or a multiple of 5 P multiple of 2 or multiple of 5

Statistics
Statistics20 The principal of the school is looking over grade reports specifically scores on math quizzes This box and whisker plot shows the results Find median and range in the given box plot Math quiz scores 50 Median 60 70 80 and Range 90

Statistics
ProbabilityA bag contains flavored lollipops A lollipop will be randomly selected from the bag 17 lollipops are grape flavored 8 lollipops are cherry flavored 14 lollipops are watermelon flavored 16 lollipops are strawberry flavored What is the probability in decimal form that the selected lollipop will be either cherry flavored or watermelon flavored

Statistics
Statistics5 The test scores of the students in Mr Duffy s class are shown on the line plot below MR DUFFY S CLASS x XX XXX X X X X x X X X X X A 60 65 70 75 80 85 90 95 100 Most of the students in Ms Guzman s class scored higher than most of the students in Mr Duffy s class on the same test Which line plot could represent the test scores of the students in Ms Guzman s class MS GUZMAN S CLASS A x x B X X X X 4 1 X X X 60 65 70 75 80 85 90 95 100 MS GUZMAN S CLASS X X X X X X X X X X X X X X X X X X X X X X X X X X X X X 60 65 70 75 80 85 90 95 100
Statistics
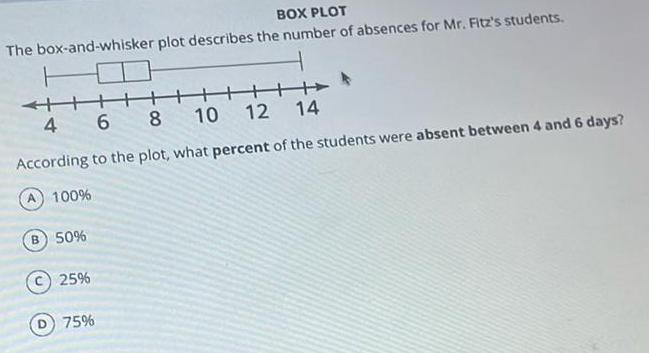
StatisticsBOX PLOT The box and whisker plot describes the number of absences for Mr Fitz s students F 4 6 8 10 12 14 According to the plot what percent of the students were absent between 4 and 6 days A 100 B 50 25 D 75

Statistics
StatisticsUse the box plot below to fill in the blanks to the five number summary below Cost of each lunch for the month in dollars H 4 5 Minimum Maximum Median First Quartile Third Quartile 6 7 8 H 9 10

Statistics
Statistics3 12 points Graph the function y 22 Find z and y intercepts hor izontal and vertical asymptotes all critical numbers intervals of in de creasing local absolute max min x 1 Draw your graph on the next page

Statistics
StatisticsBelow is a hypothesis test set up by a student who recently took introductory statistics Ho x 5 HA X 5 The sample mean of 100 cases used to implement the hypothesis test is x 4 2 Which of the following statements are accurate i This is a one sided hypothesis test ii There is an error in how these hypotheses were constructed iii It would be reasonable to swap for z in the alternative hypothesis Oi only O ii only iii only Oi and ii Oi and iii O ii and iii

Statistics
StatisticsLess than 55 of Internet users pay bills online Express the null and alternative hypotheses in symbolia form for this claim enter as a percentage Ho P H P Use the following codes to enter the following symbols

Statistics
StatisticsA New York Times article titled For Runners Soft Ground Can Be Hard on the Body considered two perspectives on whether runners should stick to hard surfaces or soft surfaces following an injury One position supported running on soft surfaces to relieve joints that were in recovery from injury The second position supported running on hard surfaces since soft surfaces can be uneven which may make worse those injuries a soft surface was intended to help Suppose we are given sufficient funds to run an experiment to study this topic With no studies to support either position which of the following hypotheses would be appropriate O The first position is more sensible so this should be a one sided test In this case we should form the alternative hypothesis around the second position O The second position makes the more sense so this should be a one sided test In this case we should form the alternative hypothesis around the first position O Because we would be interested in any difference between running on hard and soft surfaces we should use a two sided hypothesis test O Because there is uncertainty we should postpone defining the hypotheses until after we collect data to guide the test

Statistics
ProbabilityThe national average SAT score is roughly 1500 We would like to see if the high school seniors who apply to Duke have higher than average SAT scores We randomly sample 100 applicants files and record their SAT scores Which of the following is the correct set of hypotheses for this research question Hint think about how many samples we have data from O Ho x 1500 HA 1500 O Ho H 1500 HA H 1500 O Ho P 1500 HA P 1500 O Ho H 1500 HA H 1500 Ho H Duke H National HA H Duke National

Statistics
ProbabilityMore than 18 of people support legalizing gay marriage Express the null and alternative hypotheses in symbolic form for this claim enter as a percentage Ho P H p Use the following codes to enter the following symbols enter

Statistics
StatisticsA commonly cited standard for one way length duration of school bus rides for elementary school children is 30 minutes A local government office in a rural area randomly samples 100 elementary school children in their district and find an average one way commute time of 38 minutes with a standard deviation of 8 minutes Which of the following is the correct set of hypotheses for testing if the average commute time of elementary school students in this district is different than the commonly cited standard of 30 minutes O Ho H 30 HA x 38 O Ho x 38 HA H 30 O Ho H 30 HA 30 OHA H 30 Ho x 30 Ho H 30 HA 30

Statistics
ProbabilityThe mean weight of male nurses working at a local hospital is more than 174 lbs Express the null and alternative hypotheses in symbolic form for this claim Ho p H p Use the following codes to enter the following symbols enter

Statistics
StatisticsTo evaluate the effectiveness review sessions a professor gave a pre test before the review and a post test after The results are shown in the table below 50 REE 19 Pre test 1 Post test 22 7 0 49 60 79 37 67 57 60 61 65 92 16 35 13 Difference d x 1 22 57 22 33 25 63 4 24 47 10 X0 23 37 78 17 43 22 0 38 20 1 The null and alternative hypotheses would be Ho Pa H Ha o o OF o o 58 Can we say that the review session significantly harms test performance at 10 significance level 8 8 5 8 o

Statistics
Statisticspost test after The results are shown in the table below Pre test 1 Post test 48 58 46 55 65 55 60 60 46 59 42 63 42 69 Difference d 22 21 68 11 60 16 62 3 17 76 21 13 9 8 14 Can we say that the review session makes a significant difference on test performance at 5 significance level 1 The null and alternative hypotheses would be Ho Ha Select an answer H Ha Select an answer 2 The tail type of the test is Select an answer 3 The sample statistic d is

Statistics
StatisticsSolve the equation for the variable Write your solution as a simplified root If there are 2 solutions list them with a comma separating them Example 27 27 or 3 5 3 5 If there is no solution enter DNE 4x 8 392 X


