Statistics Questions
The best high school and college tutors are just a click away, 24×7! Pick a subject, ask a question, and get a detailed, handwritten solution personalized for you in minutes. We cover Math, Physics, Chemistry & Biology.

Statistics
Statisticshe safety manager at Bumbler Enterprises provides the graph shown on the right the plant manager and claims that the rate of worker injuries has been reduced y 67 over a 12 year period Does the graph support his claim Explain Choose the correct answer below SO Proportion Proportion of Workers Injured 0 58 0 48 0 38 0 28 0 18 1992 Year 2004 OA The graph supports his claim The height of the bar for 2004 is less than or equal to 67 of the height of the bar for 1992 B The graph does not support his claim The vertical scale is different for each bar OC The graph does not support his claim The vertical tick marks are too far apart to determine the exact value for the proportions The graph does not support his claim The vertical scale does not start at 0 which distorts the percent of change OR Q Q G

Statistics
StatisticsThe following graph represents the results of a survey in which a random sample of adults in a certain country was asked if a certain action was morally wrong in general Complete parts a through c below CIDE a What percent of the respondents believe the action is morally acceptable About of the respondents Round to the nearest whole number as needed b If there are 202 million adults in the country how many believe that the action is morally wrong About million adults Round to the nearest million as needed Opinion Regarding an Action Depends on situation Morally wrong Morally acceptable 0 20 40 60 80 100 Percentage of respondents c If a polling organization claimed that the results of the survey indicate that 7 of adults in the country believe that the action is acceptable in certain situations would you say this statement is descriptive or inferential Why

Statistics
StatisticsThe data to the right represent the number of customers waiting for a table at 6 00 P M for 40 consecutive Saturdays at Bobak s Restaurant Complete parts a through h below b Construct a frequency distribution of the data Number of Customers 1 3 4 6 7 9 10 12 13 15 Frequency a Are these data discrete or continuous Explain OA The data are continuous because it was recorded for 40 consecutive Saturdays OB The data are continuous because there are a finite or countable number of values OC The data are discrete because there are a finite or countable number of values OD The data are discrete because it was recorded for 40 consecutive Saturdays c Construct a relative frequency distribution of the data Number of Customers 1 3 4 6 7 9 10 12 13 15 Type integers or decimals Do not round 10 9 Relative Frequency 12 11 9 13 8 12 230 13 10 45827 12 88369 04684 10 79859 7

Statistics
StatisticsTo predict future enrollment in a school district fifty households within the district were sampled and asked to Number of disclose the number of children under the age of five living in the household The results of the survey are presented in the table Complete parts a through c below a Construct a relative frequency distribution of the data Number of Relative Children under 5 Frequency 0 1 2 3 4 Type integers or decimals Do not round b What percentage of households has two children under the age of 5 Type an integer or a decimal Do not round c What percentage of households has one or two children under the age of 5 Number of Children under 5 Households 14 16 16 3 1 Type an integer or a decimal Do not round 0 1 2 3 4

Statistics
StatisticsA researcher wanted to determine the number of televisions in households He conducts a survey of 40 randomly selected households and obtained the data to the right Draw a dot plot of the televisions per household Choose the correct dot plot below OA 0 1 2 3 4 5 Number of Televisions Q O B 0 1 2 3 4 5 Number of Televisions Q O C 1 2 2 1 2 0 1 2 3 4 5 Number of Televisions 12232 5221 N Q Q 2 3512 N 2 31312 O D 3 5 10 12216 60132 433 1 0 1 2 3 4 5 Number of Televisions

Statistics
Statisticsate the following argument Then tell whether it is a valid or invalid argument by using the Valid Argument table below or by using a Truth Table If it is Monday then I go to the gym I went to the gym Therefore it is Monday Let p and q represent the following statements p If it is Monday and q 1 go to the gym Valid Arguments 114 Invalid Arguments Fallacy of the CONVERSE f 011 p Contrapositive Reasoning Fallacy of the IRISISE Valid Argument 03 P q 2 P Misuse of Disjunctive Remoning Reaning 14

Statistics
StatisticsListen Write the symbolic statement using words p The air freshener is working q The basement smells nice p q 1 If the air freshener is not working then the basement smells nice 2 The air freshener is working if and only if the basement smells nice The air freshener is not working if and only if the basement does not smell nice 4 The air freshener is not working if and only if the basement smells nice O 3
Statistics
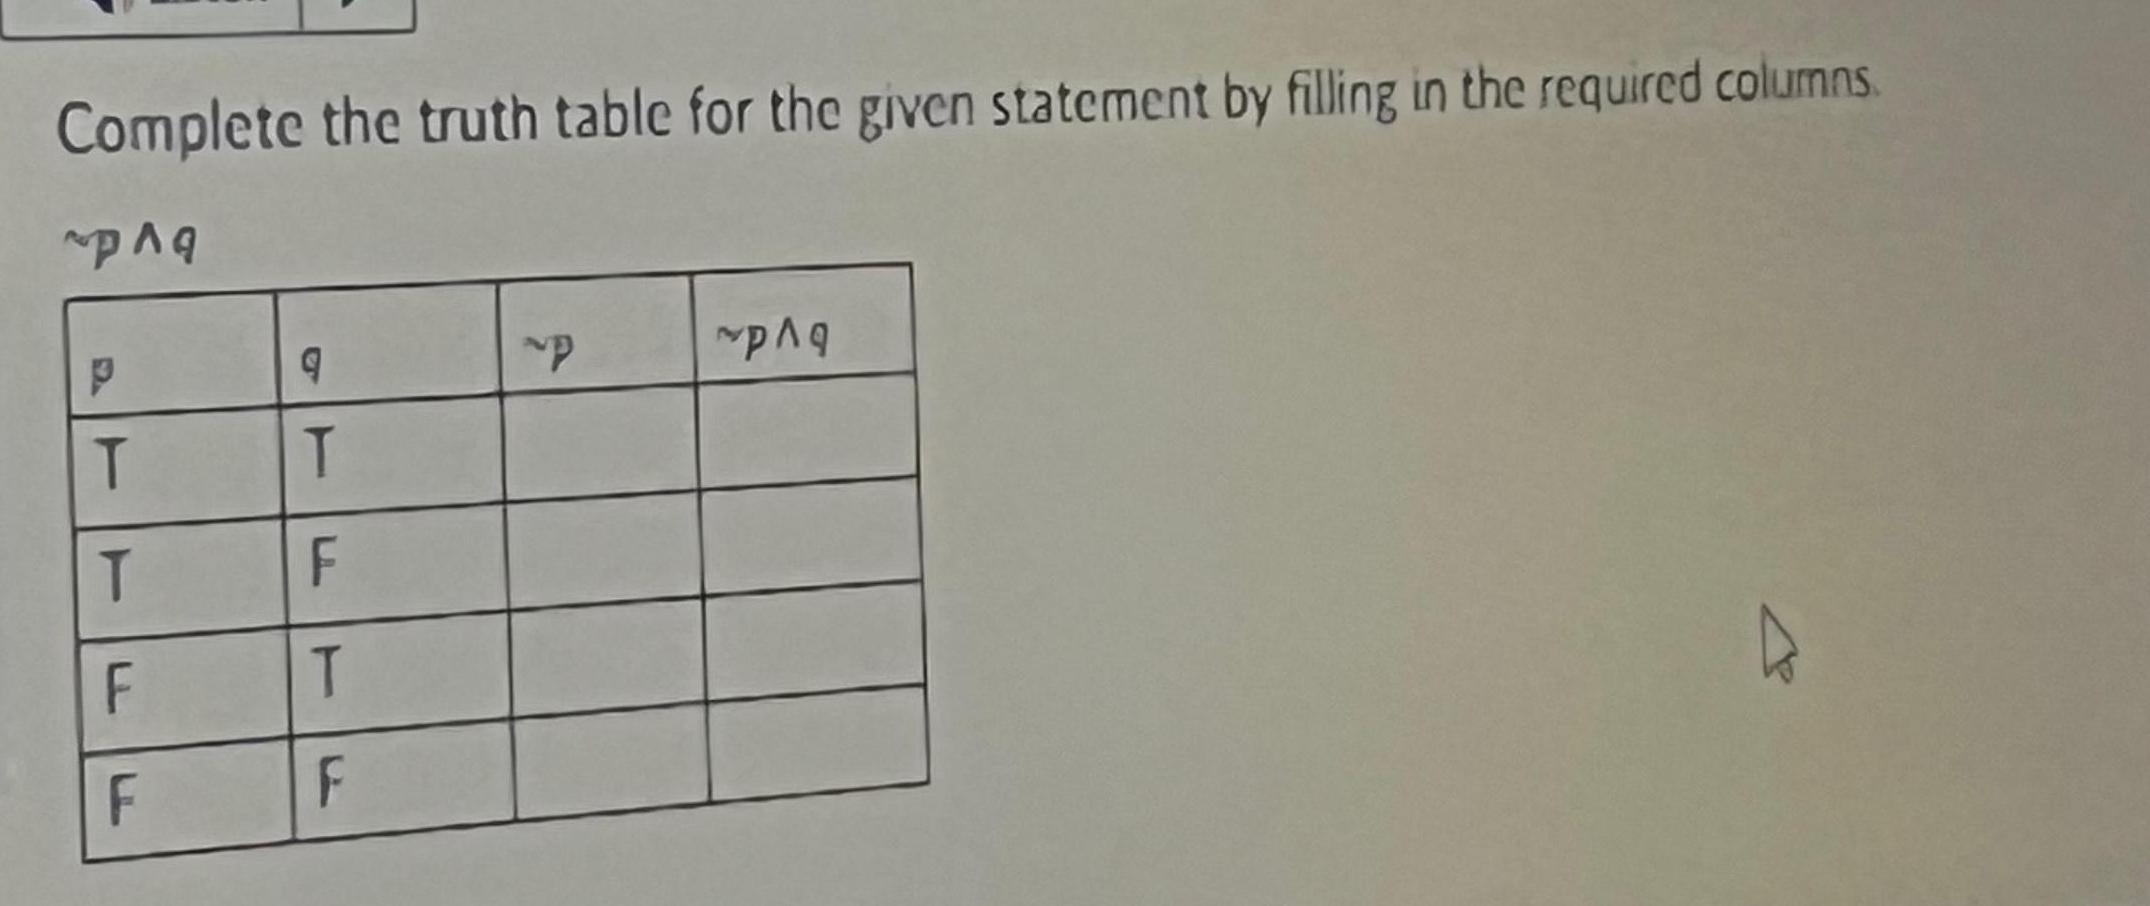
ProbabilityComplete the truth table for the given statement by filling in the required columns paq T T F F 9 T F T F P pag

Statistics
StatisticsThe price of a home is 200 000 The mortgage on the house is a 30 year foxed rate mortgage at 4 Use this information to find the amount of the monthly payment Round your answer to the nearest cent Use the formula below to solve the problem P Payment 1 954 83 O 2 859 35 3 667 67

Statistics
StatisticsLet p and q represent the following statements p She lifts weights q She does not build up strength Write the following statement using symbols only If she lifts weights then she will build up strength 1 parq P 02 p 9 3 p q 4 p q

Statistics
StatisticsThe price of a home is 270 000 The bank requires a 5 down payment at the time of closing The mortgage on the house is a 30 year fixed rate mortgage at 7 Use this information to find the amount of the monthly payment Round your answer to the nearest cent Use the formula below to solve the problem P Payment 1 1 707 O2 1 796 3 1 695

Statistics
StatisticsGiven that x has a Poisson distribution with 11 what is the probability that x 8 8 Round to four decimal places as needed
Statistics
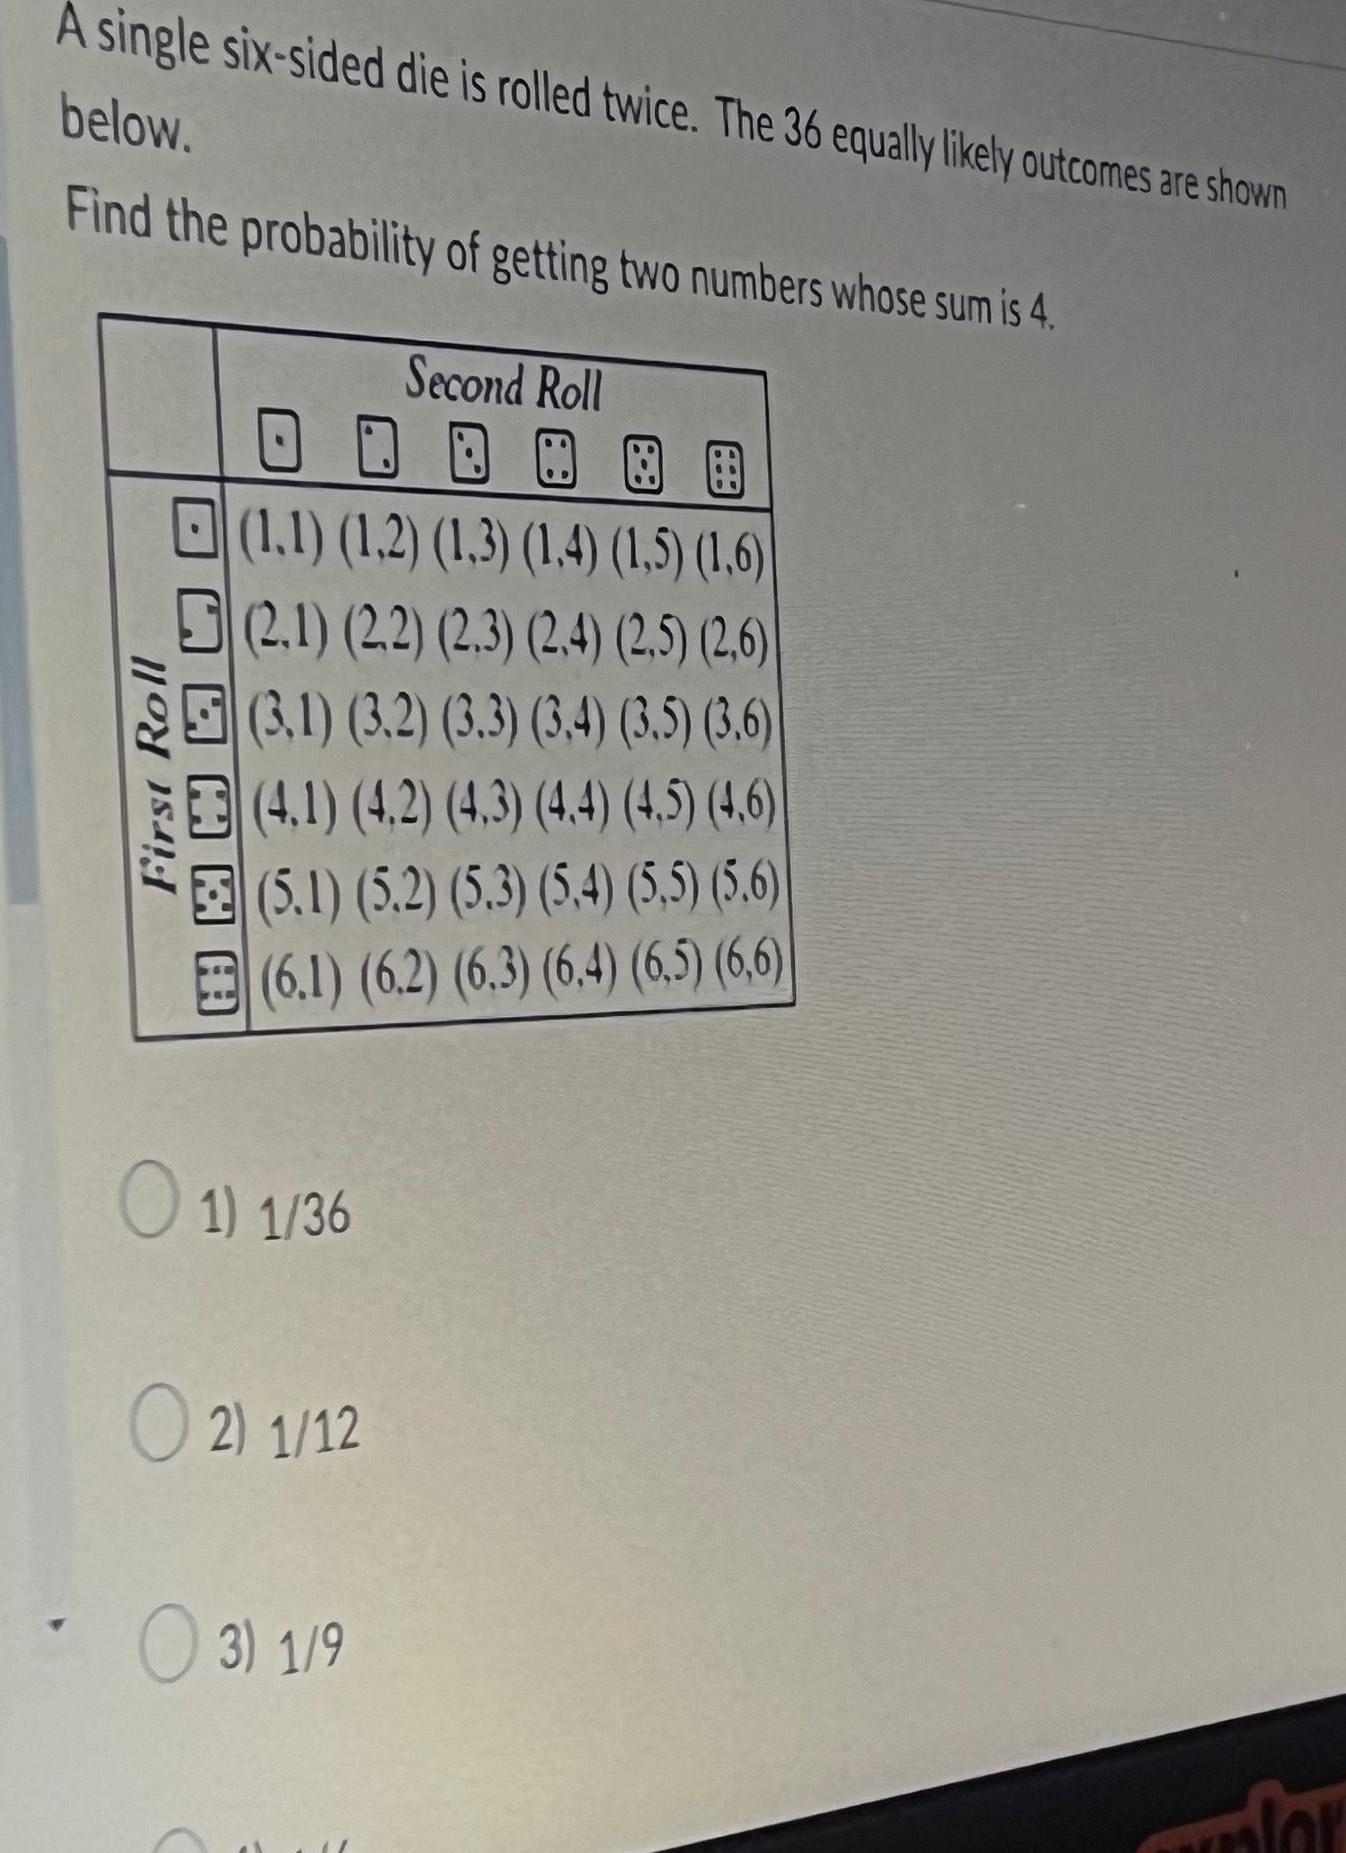
ProbabilityA single six sided die is rolled twice The 36 equally likely outcomes are shown below Find the probability of getting two numbers whose sum is 4 First Roll A 1 1 1 2 1 3 1 4 1 5 1 6 2 1 2 2 2 3 2 4 2 5 2 6 3 1 3 2 3 3 3 4 3 5 3 6 4 1 4 2 4 3 4 4 4 5 4 6 5 1 5 2 5 3 5 4 5 5 5 6 6 1 6 2 6 3 6 4 6 5 6 6 O 1 1 36 O2 1 12 Second Roll 3 1 9 for
Statistics
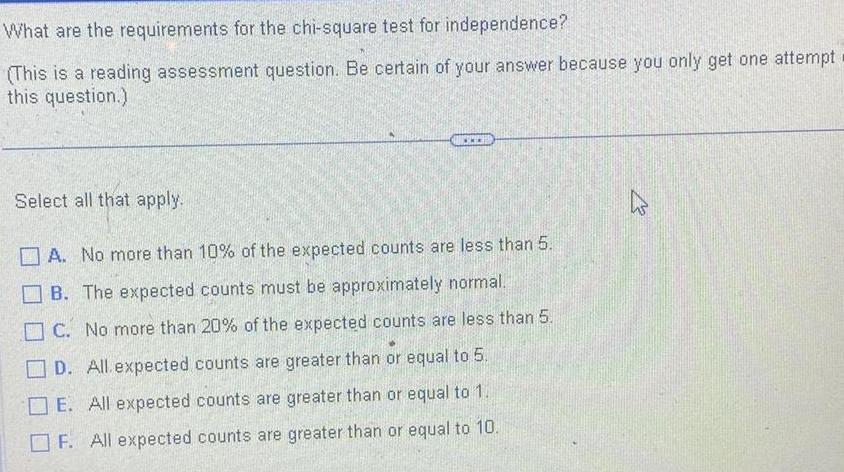
ProbabilityWhat are the requirements for the chi square test for independence This is a reading assessment question Be certain of your answer because you only get one attempt this question Select all that apply A No more than 10 of the expected counts are less than 5 B The expected counts must be approximately normal C No more than 20 of the expected counts are less than 5 D All expected counts are greater than or equal to 5 E All expected counts are greater than or equal to 1 F All expected counts are greater than or equal to 10

Statistics
StatisticsSuppose you are the president of the student government You wish to conduct a survey to determine the student body s opinion regarding student services The administration provides you with a list of the names and phone numbers of the 400 registered students a Discuss a procedure you could follow to obtain a simple random sample of 5 students b Obtain this sample Click the icon to view the portion of the random number table C a Which of the following procedures could you follow to obtain a simple random sample of 5 students Select all that apply A List the names in alphabetical order and take the first five names on the list B List each name on a separate piece of paper place them all in a hat and pick five C Ask the students to come to a meeting and pick five from those who come to the meeting D Number the names from 1 to 400 and use a random number table to produce 5 different three digit numbers corresponding to the names selected b Obtain this sample using the portion of the random number table provided in the problem statement Start with the first column of the first row and work down each column Type the numbers corresponding to the students chosen Use a comma to separate answers as needed Random Number Table 60155 97236 32113 23810 73300 00332 48569 95103 16775 00163 39781 25408 20263 58388 X

Statistics
StatisticsThe data on the right relate to characteristics of high definition televisions A through E Identify the individuals variables and data corresponding to the variables Determine whether each variable is qualitative continuous or discrete Size is a Screen type is a Number of channels available is a Screen Setup Size in Type 50 Plasma A B 58 Projection 48 Projection Projection Plasma variable C D E OB Setup A B C D E size 50 58 48 55 59 screen type Plasma Projection Projection Projection Plasma and number of channels available 298 105 425 270 289 OC Size 50 58 48 55 59 and number of channels available 298 105 425 270 289 Determine whether each variable is qualitative continuous or discrete variable variable 55 59 What are the individuals being studied OA Plasma and projection widescreen high definition televisions OB The high definition television setups A through E OC Televisions with screen sizes between 40 in and 60 in OD Television setups that include more than 100 channels What are the variables and their corresponding data being studied OA Size 50 58 48 55 59 screen type Plasma Projection Projection Projection Plasma and number of channels available 298 105 425 270 289 Number of Channels Available 298 105 425 270 289

Statistics
StatisticsA concrete mix is designed to withstand 3000 pounds per square inch psi of pressure The following data represent the strength of nine randomly selected casts in psi 3950 4090 3100 3100 2940 3830 4100 4030 3620 Compute the mean median and mode strength of the concrete in psi Compute the mean strength of the concrete Select the correct choice below and if necessary fill in the answer box to complete your choice OA The mean strength of the concrete is Round to the nearest tenth as needed B The mean does not exist psi of pressure

Statistics
StatisticsA professor has recorded exam grades for 10 students in his class but one of the grades is no longer readable If the mea score on the exam was 82 and the mean of the 9 readable scores is 85 what is the value of the unreadable score The value of the unreadable score is

Statistics
StatisticsFor a distribution that is symmetric which of the following is true This is a reading assessment question Be certain of your answer because you only get one attempt on this question Choose the correct answer below O mean median mean median mean median O

Statistics
StatisticsThe following data represent the miles per gallon for a particular make and model car for six randomly selected vehicles Compute the mean median and mode miles per gallon 32 5 38 4 32 3 31 6 33 4 29 4 Compute the mean miles per gallon Select the correct choice below and if necessary fill in the answer box to complete your choice OA The mean mileage per gallon is Round to two decimal places as needed B The mean does not exist

Statistics
StatisticsThe following frequency histogram represents the IQ scores of a random sample of seventh grade students IQs are measured to the nearest whole number The frequency of each class is labeled above each rectangle Use the histogram to answers parts a through g a How many students were sampled students Frequency 80 60 40 20 0 IQs of 7th Grade Students 12 41 57 40 32 10 23 21 60 70 80 90 100 110 120 130 140 150 16 IQ scores

Statistics
StatisticsOn the basis of a population survey there were 89 8 million males and 101 6 million females 25 years old or older in a certain country The educational attainment of the males and females is shown in the accompanying table Complete parts a through d below Click the icon to view the table of educational attainment data for the country a Construct a relative frequency distribution for males Express each relative frequency as a decimal Educational Attainment Not a high school graduate A High school graduate B Some college but no degree C Relative Frequency males Associate s degree D Bachelor s degree E Advanced degree F Type integers or decimals rounded to four decimal places as needed Educational Attainment for Men and Women Educational Attainment Not a high school graduate A High school graduate B Some college but no degree C Associate s degree D Bachelor s degree E Adunner Males in millions 13 3 29 5 16 3 5 9 16 5 Females in millions 13 7 34 1 16 9 8 5 18 8 X

Statistics
Statisticse accompanying table shows the tax in dollars on a pack of cigarettes in 30 randomly selected cities Complete parts a through g be Click the icon to view the table of data GXXXS Construct a frequency distribution Use a first class having a lower class limit of 0 and a class width of 0 50 ype integers or decimals Do not round Frequency Tax Taxes on a pack of cigarettes in dollars 2 83 0 64 1 15 1 08 2 19 0 42 0 76 2 63 0 24 0 35 0 78 0 85 1 53 3 39 0 84 4 36 2 27 2 28 1 68 1 57 1 49 1 74 1 25 0 63 0 18 1 48 2 99 0 72 0 56 0 96 X

Statistics
Statistics2 A recent study observed the number of bike riders ages 0 to 20 that wear helmets The results are 90 represented in the table bliud foodbe 0 5 years 6 10 years 11 15 years 16 20 years wear helmet did not wear helmet 21 34 14 3 4 14 18 12 6940 6902 Make an observation based on a data value that is not in the table Explain your reasoning

Statistics
StatisticsThe following data represent the ages of award winners for best actor and best actress in a leading role for the 20 years from 1985 to 2004 Answer parts a b below Full data set 24 38 35 42 34 31 27 27 22 53 47 60 28 54 38 54 30 37 41 45 Best Actor Ages 35 43 35 52 40 39 48 38 62 54 a Construct an ordered back to back stem and leaf display Best Actor Age 2 3 st 50 73 27 44 Best Actress Age 34 26 61 39 48 32 Best Actress Ages 31

Statistics
StatisticsA newspaper article claimed that the afternoon hours were the worst in terms of robberies and provided the graph to the right in support of this claim Explain how this graph is misleading Percent of Robberies 15 10 q Hourly Crime Distribution Robbery 6a 9a 9a 12p 12p 6p 6p 9p 9p 12a 12a 3a 3a 6a Choose the correct answer below OA The vertical axis has no units This can mislead readers into thinking that the percentages are actually counts OB All of the bars are the same color so they tend to blend visually with each other This makes the graph hard to read OC The vertical axis stops at 25 It should go all the way up to 100 to accurately show percentage data OD Not all of the time intervals are the same size Redistributing the time interval so they are all the same size may lead to a different shape

Statistics
StatisticsAn Internet media and market research firm measured the amount of time an individual spends viewing a specific Webpage The data in the accompanying table represent the amount of time in seconds a random sample of 40 surfers spent viewing a Webpage Create the graphical summary Write a sentence that describes the data Click the icon to view the data table Create the graphical summary Choose the correct graph below OA O B Frequency 16 Webpage Viewing Time 80 160 Viewing Time seconds Q S Frequency 26264 20 16 Webpage Viewing Time 12 8 80 160 Viewing Time seconds Q O C Frequency 16 Webpage Viewing Time 80 160 Viewing Time seconds Q Q

Statistics
StatisticsThe data in the accompanying table represent the ages of the presidents of a country on their first days in office Complete parts a and b Click the icon to view the data table a Construct a stem and leaf plot Choose the correct answer below OB President Ages 4 04 4 667899 5 1001112244444 5 555566677778 6 0111244 6 579 OA President Ages 4 04 4 667899 5 0011112244444 5 555566677778 6 01112445 6 79 Legend 410 represents 40 years Legend 4 10 represents 40 years OC President Ages 4 04 4 667899 5 0011112244444 5 555566677778 60111244 6 579 Legend 410 represents 40 years O D President Ages 4 667899 4 04 5 0011112244444 5 555566677778 6 0111244 6 579 Legend 4 16 represents 46 years

Statistics
StatisticsTo predict future enrollment in a school district fifty households within the district were sampled and asked to Number of disclose the number of children under the age of five living in the household The results of the survey are presented in the table Complete parts a through c below a Construct a relative frequency distribution of the data Number of Relative Children under 5 Frequency 0 1 2 3 Type integers or decimals Do not round Number of Children under 5 Households 17 16 0 1 2 3 4 14 2 1

Statistics
StatisticsThe following frequency histogram represents the IQ scores of a random sample of seventh grade students IQs are measured to the nearest whole number The frequency of each class is labeled above each rectangle Use the histogram to answers parts a through g a How many students were sampled students Frequency 80 60 40 20 IQs of 7th Grade Students 46 50 42 31 10 12 22 60 70 80 90 100 110 120 130 140 150 16 IQ scores

Statistics
StatisticsA manufacturer knows that their items have a lengths that are skewed right with a mean of 18 5 inches and standard deviation of 2 9 inches If 44 items are chosen at random what is the probability that their mean length is greater than 17 3 inches Round answer to four decimal places

Statistics
StatisticsThe cost of living index for Indiana in the first quarter of 2021 was 89 8 whereas the cost of living index for Illinois was 94 4 Which sentence best compares these values The cost of living is 5 1 lower in Indiana than in Illinois For every 100 spent to live in Illinois you would only spend 89 80 in Indiana Illinois has a 4 9 higher cost of living than Indiana The cost of living in Indiana is 95 less than the cost of living in Illinois The cost of living is 5 1 higher in Illinois than in Indiana
Statistics
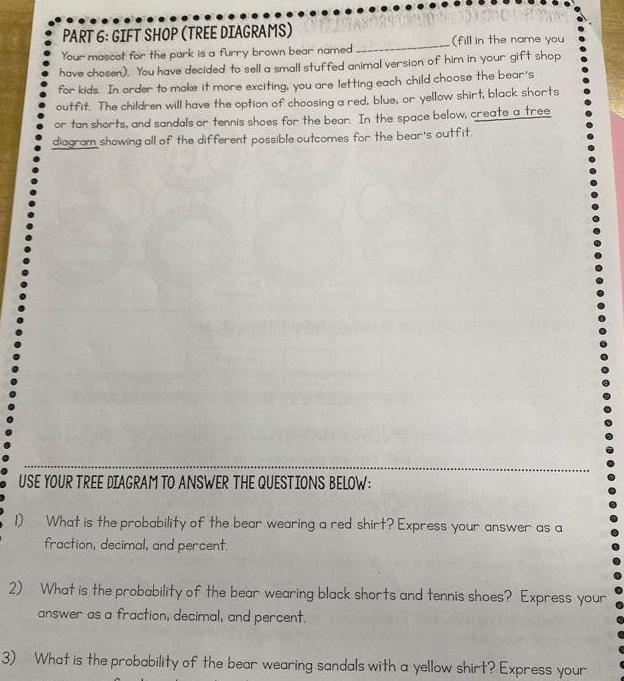
ProbabilityPART 6 GIFT SHOP TREE DIAGRAMS fill in the name you Your mascot for the park is a furry brown bear named have chosen You have decided to sell a small stuffed animal version of him in your gift shop for kids In order to make it more exciting you are letting each child choose the bear s outfit The children will have the option of choosing a red blue or yellow shirt black shorts or tan shorts and sandals or tennis shoes for the bear In the space below create a tree diagram showing all of the different possible outcomes for the bear s outfit USE YOUR TREE DIAGRAM TO ANSWER THE QUESTIONS BELOW D What is the probability of the bear wearing a red shirt Express your answer as a fraction decimal and percent 2 What is the probability of the bear wearing black shorts and tennis shoes Express your answer as a fraction decimal and percent 3 What is the probability of the bear wearing sandals with a yellow shirt Express your
Statistics
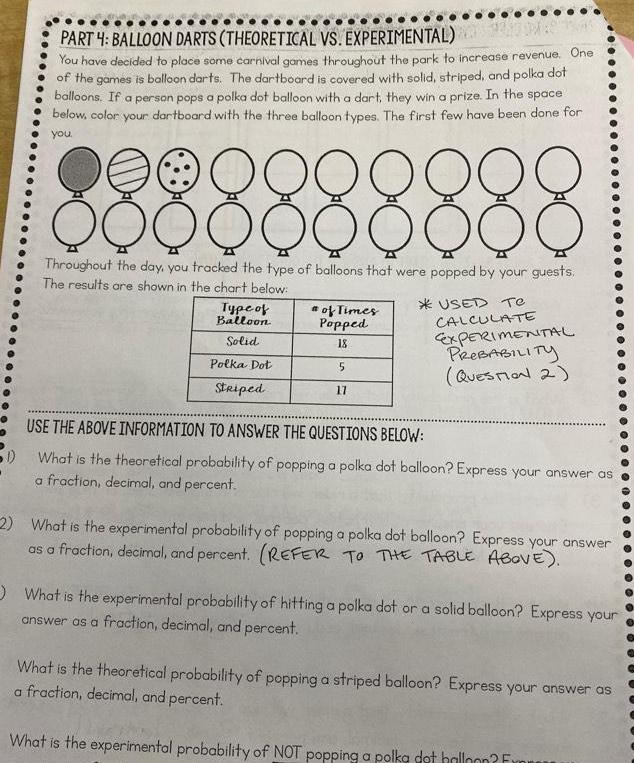
ProbabilityPART 4 BALLOON DARTS THEORETICAL VS EXPERIMENTAL You have decided to place some carnival games throughout the park to increase revenue One of the games is balloon darts The dartboard is covered with solid striped and polka dot balloons If a person pops a polka dot balloon with a dart they win a prize In the space below color your dartboard with the three balloon types The first few have been done for you 2 9 9 9 9 9 D O Q Q Q Q Q QQQ Throughout the day you tracked the type of balloons that were popped by your guests The results are shown in the chart below USED Te Type of Balloon Solid Polka Dot Striped of Times Popped 18 5 17 CALCULATE EXPERIMENTAL PROBABILITY QUESTION 2 USE THE ABOVE INFORMATION TO ANSWER THE QUESTIONS BELOW 1 What is the theoretical probability of popping a polka dot balloon Express your answer as a fraction decimal and percent 2 What is the experimental probability of popping a polka dot balloon Express your answer as a fraction decimal and percent REFER TO THE TABLE ABOVE What is the experimental probability of hitting a polka dot or a solid balloon Express your answer as a fraction decimal and percent What is the theoretical probability of popping a striped balloon Express your answer as a fraction decimal and percent What is the experimental probability of NOT popping a polka dot halloon Fr
Statistics
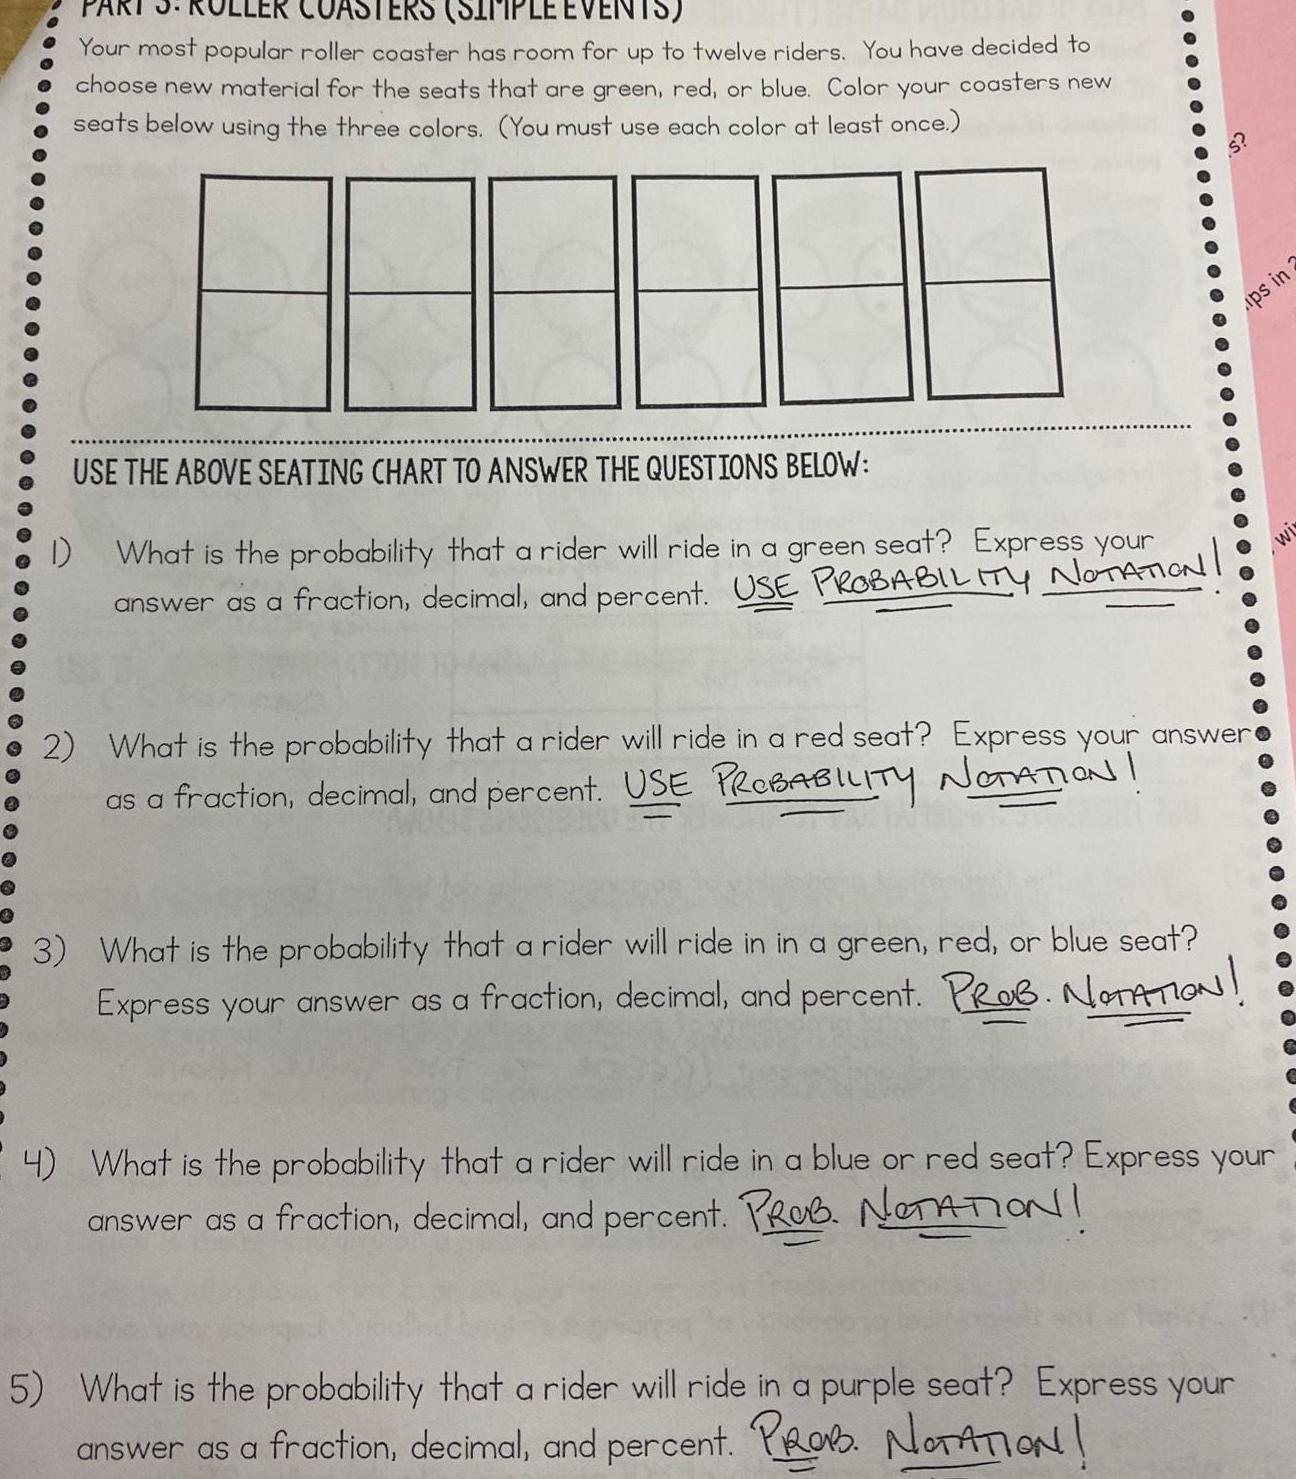
ProbabilityPART 3 ER COASTERS SIMPLE EVENTS Your most popular roller coaster has room for up to twelve riders You have decided to choose new material for the seats that are green red or blue Color your coasters new seats below using the three colors You must use each color at least once USE THE ABOVE SEATING CHART TO ANSWER THE QUESTIONS BELOW What is the probability that a rider will ride in a green seat Express your answer as a fraction decimal and percent USE PROBABILITY NOTATION 1 S 2 What is the probability that a rider will ride in a red seat Express your answer as a fraction decimal and percent USE PROBABILITY NOTATION ups in 3 What is the probability that a rider will ride in in a green red or blue seat Express your answer as a fraction decimal and percent PROB NOTATION 4 What is the probability that a rider will ride in a blue or red seat Express your answer as a fraction decimal and percent PROB NOTATION 5 What is the probability that a rider will ride in a purple seat Express your answer as a fraction decimal and percent PROB NOTATION 2 wi

Statistics
Statisticscording to the Federal Trade Commission report on consumer fraud and identity theft 23 of all nplaints in 2007 were for identity theft This year a certain state kept track of the number of its 1210 nplaints were for identity theft They want to know if the data provide enough evidence to show that s state had a higher proportion of identity theft than 23 State the random variable population ameter and hypotheses a The symbol for the random variable involved in this problem is x o The wording for the random variable in context is as follows Select an answer O The percentage of 1210 randomly selected complaints filed with the FTC for that state that are for identity theft 23 of all complaints filed with the FTC for that state are for identity theft A randomly selected complaint filed with the FTC for that state The percentage of all complaints filed with the FTC for that state that are for identity theft Whether or not a randomly selected complaint filed with the FTC for that state is for identity theft The mean number of all complaints filed with the FTC for that state that are for identity theft A randomly selected complaint filed with the

Statistics
StatisticsAccording to the Federal Trade Commission report on consumer fraud and identity theft 23 of all complaints in 2007 were for identity theft This year a certain state kept track of the number of its 1210 complaints were for identity theft They want to know if the data provide enough evidence to show that this state had a higher proportion of identity theft than 23 State the random variable population parameter and hypotheses a The symbol for the random variable involved in this problem is S

Statistics
StatisticsAccording to a survey of 1 190 adult college students the mean number of alcoholic beverages consumed per week is 10 with a standard deviation of 7 beverages What test statistic is calcuated for this scenario Hint We are given a sample with the sample standard deviation Op value mean test null test Ot value Z score

Statistics
StatisticsA club wants to sponsor a panel discussion on the upcoming national election The club wants four of its members to lead the panel discussion Write a short description of the processes that can be used to generate your sample Obtain a simple random sample from the table Click the icon to view the club membership list Which of the following would produce a simple random sample Select all that apply A Number the names from 1 to 25 and use a random number table to produce 4 different two digit numbers corresponding to the names selected B List each name on a separate piece of paper place them all in a hat and pick four C Vote on which four members should lead the panel discussion and select those four D List the members in alphabetical order and take the first four names on the list Use the portion of the random number table provided to obtain a simple random sample of size 4 from this list If you start with the first column of the first row work down each column if one must go back to the top of the table do not skip any columns and take the first four numbers between 1 and 25 what four members would be selected from the numbered list OA Ochs Engler Bolt Bolt OB Engler Bolt Washington Bolden OC Ochs Engler Bolt Washington OD Ochs Engler Bolt Bolden OE Ochs Washington Engler Bolden Member List 1 Blouin 2 Bolden 3 Bolt 4 Carter 5 Cooper 6 Debold 7 Engler 8 Grajewski 0 Haves 11 Keating 12 Lukens 13 May 14 Motola 15 Nolan 16 Ochs 17 Pawlak 18 Ramirez 19 Rice 21 Thompson 22 Washington 23 Williams COCER 24 Wright 25 Zenkel X 79034 27310 80712 16380 E 84263 68966 38854 70691 07225 34760 03867 27281
Statistics
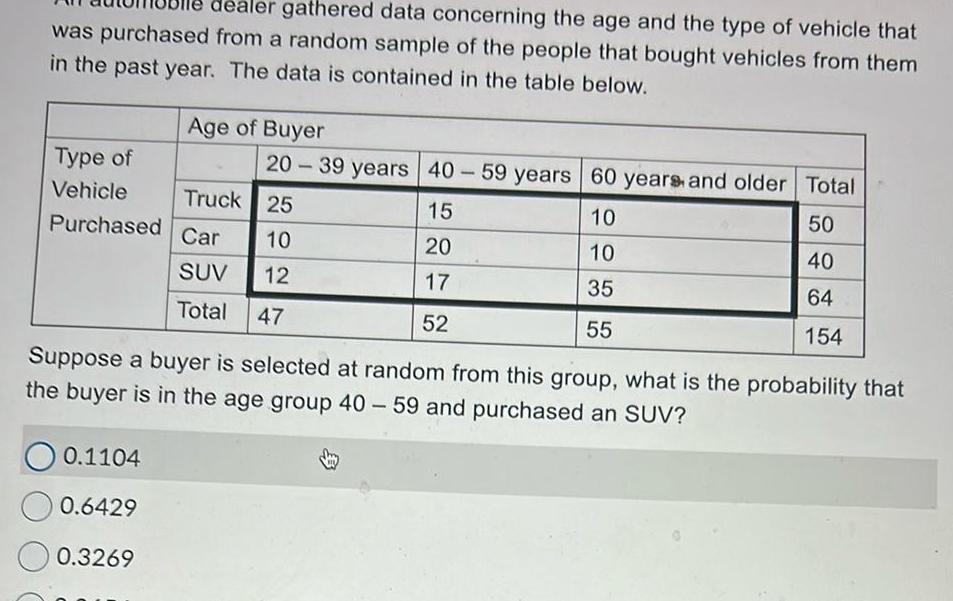
Probabilitydealer gathered data concerning the age and the type of vehicle that was purchased from a random sample of the people that bought vehicles from them in the past year The data is contained in the table below Age of Buyer Type of Vehicle Truck Purchased Car 0 1104 0 6429 0 3269 20 39 years 40 59 years 60 years and older Total 50 40 64 154 25 10 SUV 12 Total 47 15 20 17 52 10 10 35 55 Suppose a buyer is selected at random from this group what is the probability that the buyer is in the age group 40 59 and purchased an SUV

Statistics
StatisticsSuppose you are the president of the student government You wish to conduct a survey to determine the student body s opinion regarding student services The administration provides you with a list of the names and phone numbers of the 548 registe a Discuss a procedure you could follow to obtain a simple random sample of 5 students b Obtain this sample Click the icon to view the portion of the random number table a Which of the following procedures could you follow to obtain a simple random sample of 5 students Select all that apply A Number the names from 1 to 548 and use a random number table to produce 5 different three digit numbers corresponding to the names selected B List each name on a separate piece of paper place them all in a hat and pick five C List the names in alphabetical order and take the first five names on the list D Ask the students to come to a meeting and pick five from those who come to the meeting b Obtain this sample using the portion of the random number table provided in the problem statement Start with the first column of the first row and work down each column Type the numbers corresponding to the students chosen Use a comma to separate answers as needed Random Number Table CIIS 82186 99857 26753 53920 69460 50701 97494 64132 17899 11846 08145 41547 X

Statistics
Statistics15 In the diagram shown all three triangles are similar to each other 2 25 E 60 Part A What is the length of BD Part B What is the length of DE Show your work and explain your reasoning Part C Prove that the measure of ABC is 90 degrees

Statistics
ProbabilityWhat is an observational study What is a designed experiment Which allows the researcher to claim causation between an explanatory variable and a response variable What is an observational study OA An observational study is when a researcher assigns individuals to a certain group intentionally changing the value of an explanatory variable and then recording the value of the response variable for each group B An observational study measures the value of the response variable without attempting to influence the value of either the response or explanatory variables OC An observational study is a list of all individuals in a population along with certain characteristics of each individual

Statistics
StatisticsThe data on the right relate to characteristics of high definition televisions A through E Identify the individuals variables and data corresponding to the variables Determine whether each variable is qualitative continuous or discrete What are the individuals being studied OA The high definition television setups A through E OB Television setups that include more than 100 channels OC Plasma and projection widescreen high definition televisions OD Televisions with screen sizes between 40 in and 60 in Setup Size in A B Screen Type 47 Projection 56 Plasma 43 Plasma 52 Plasma 60 Projection C D E Number of Channels Available 300 118 423 270 290

Statistics
ProbabilityA news service conducted a survey of 1040 adults ages 18 years or older in a certain country August 31 September 2 2015 The respondents were asked Of every tax dollar that goes to the federal government how many cents of each dollar would you say are wasted The four possible responses are that the federal government wastes less than 10 cents between 11 cents and 25 cents between 26 cents and 50 cents or 51 cents more Of the 1040 individuals surveyed 35 indicated that 51 cents or more is wasted The news service reported that 35 of all adults in the country 18 years or older believe the federal government wastes at least 51 cents of each dollar spent with a margin of error of 6 and a 99 leve of confidence Complete parts a through e below a What is the research objective OA To determine the percent of adults in the country who believe the federal government wastes 51 cents or more of every dollar B To determine the number of adults in the country who believe the federal government wastes tax dollars C To determine the number of adults in the country OD To determine the number of adults in the country paying their taxes to the federal government

Statistics
StatisticsA student organization uses the proceeds from a soft drink vending machine to finance its activities The price per can was 0 75 for a long time and the mean daily revenue during that period was 75 00 The price was recently increased to 1 00 per can A random sample of n 25 days after the price increase yielded a sample mean daily revenue and sample standard deviation of 70 00 and 4 25 respectively Does this information suggest that the mean daily revenue has decreased from its value before the price increase Test the appropriate hypotheses using a 0 05 USE SALT State the appropriate null and alternative hypotheses Enter for as needed Ho H Find the test statistic Round your answer to two decimal places Use technology to find the P value Round your answer to four decimal places P value MY NOTES State the conclusion in the problem context We fail to reject Ho We do not have convincing evidence that the mean daily revenue from the soft drink vending machine has decreased from its value before the price increase We reject Ho We do not have convincing evidence that the mean daily revenue from the soft drink vending machine has decreased from its value before the price increase We reject Ho We have convincing evidence that the mean daily revenue from the soft drink vending machine has decreased from its value before the price increase We fail to reject Ho We have convincing evidence that the mean daily revenue from the soft drink vending machine has decreased from its value before the price increase

Statistics
StatisticsWhen the tissue around teeth becomes inflamed the tissue bleeds more easily and this is an indication of gum disease The severity of bleeding can be measured by a bleeding score that is determined by the percentage of teeth for which bleeding occurs when the tissue surrounding the tooth is probed In terms of dental health lower bleeding scores are better than higher bleeding scores The authors of a paper wondered if the nutrients found in kiwis might reduce bleeding To investigate 25 adult participants agreed to consume 2 kiwis a day for a period of 2 months A bleeding score was recorded for each participant at the beginning of the study period and again after 2 months of kiwi consumption Because this resulted in paired samples differences in bleeding scores before after were analyzed It was reported that the sample mean difference was X 6 68 and the standard deviation of the differences was s 11 80 Assume that the 25 study participants can be considered as representative of the population of adults LUSE SALT 2 011 S Need Help MY NOTES Use the information given above to construct a 90 confidence interval for the difference in bleeding score before and after 2 months of kiwi consumption Use Before After Enter your answer using interval notation Round your numerical values to four decimal places Interpret the interval We are 90 confident that the true difference in mean bleeding score before and after 2 months of kiwi consumption falls within this interval The bounds mean score was higher before kiwi consumption Read It PRACTICE ANOTHE the interval suggest the

Statistics
StatisticsIn a study of memory recall 8 students from a large psychology class were selected at random and given 10 minutes to memorize a list of 20 nonsense words Each was asked to list as many of the words as they could remember both 1 hour and 24 hours later The data are given in the accompanying table Subject 1 hr later 24 hr later 1 23 4 14 12 18 7 Interpret the interval 10 USE SALT 4 13 6 5 11 9 6 9 7 8 16 15 13 2 024 S 6 12 12 Construct a 90 confidence interval for the difference in mean number of words remembered after 1 hour and after 24 hours Use 1 Hour Later 24 Hours Later Enter your answer using interval notation Round your numerical values to four decimal places MY NOTES PRACTICE ANOTHER We are 90 confident that the true difference in mean number of words recalled between 1 hour later and 24 hours later falls within interval suggest the mean number of words is higher 1 hour later 0 this interval The bounds of the

Statistics
StatisticsMedical research has shown that repeated wrist extension beyond 20 degrees increases the risk of wrist and hand injuries Each of 24 students at a university used a proposed new computer mouse design and while using the mouse each student s wrist extension was recorded Data consistent with summary values given in a paper are shown Use these data to test the hypothesis that the mean wrist extension for people using this new mouse design is greater than 20 degrees Use 0 05 24 H 22 26 25 28 24 27 25 26 24 LUSE SALT 27 27 25 25 25 27 28 31 27 26 24 26 State the appropriate null and alternative hypotheses in degrees Enter for as needed Ho Find the test statistic Round your answer to two decimal places 24 27 Content Use technology to find the P value Round your answer to four decimal places P value W Exam 3 MATH1123 section 08 Fall 2023 WebAssign State your conclusion We fail to reject Ho We have convincing evidence that the mean wrist extension for all people using the new mouse design is greater than 20 degrees We fail to reject Ho We do not have convincing evidence that the mean wrist extension for all people using the new mouse design is greater than 20 degrees We reject Ho We have convincing evidence that the mean wrist extension for all people using the new mouse design is greater than 20 degrees We reject Ho We do not have convincing evidence that the mean wrist extension for all people using the new mouse design is greater than 20 degrees Are any assumptions required in order for it to be appropriate to generalize the results of your test to the population of students from this university We need to assume that the 24 students used in the study are representative of all students who own PCs We need to assume that the 24 students used in the study are representative of all students who use a wireless mouse Wo good to assume that the 24 students used in the study are representative of all students at the university all pudents with a history of wrist or hand injuries

Statistics
StatisticsThe figure below is similar to one that appeared in the report Digital Media Trends 15th Edition Courting the Consumer in a World of Choice The graph summarizes responses by generation to the question What is your favorite entertainment activity Generation Z may not be video first Respondents across generations ranked their favorite entertainment activity Percent 40 30 20 10 0 26 16 10 14 13 USE SALT 11 Play video Listen to games music 12 11 10 12 Browse the internet 11 Engage on social platforms 18 29 Watch TV shows or movies at home Suppose that the percentages given in the graph are baselt on independent representative samples of 900 people from each of the four generations Is there convincing evidence that the proportion of Boomers who say that their favorite entertainment activity is playing video games is less than this proportion for Generation X Test the relevant hypotheses using a 0 05 Let p be the population proportion of Boomers who say that their favorite entertainment activity is playing video games and p be the population proportion of Generation X who say that their favorite entertainment activity is playing video games Generation Z Millennials Generation X Boomers State the appropriate null and alternative hypotheses Enter for as needed