Statistics Questions
The best high school and college tutors are just a click away, 24×7! Pick a subject, ask a question, and get a detailed, handwritten solution personalized for you in minutes. We cover Math, Physics, Chemistry & Biology.

Statistics
StatisticsProfessor Cramer determines a final grade based on attendance two papers three major tests and a final exam Each of these activities has a total of 100 possible points However the activities carry different weights Attendance is worth 4 each paper is worth 6 each test is worth 16 and the final is worth 36 a What is the average for a student with 95 on attendance 89 on the first paper 78 on the second paper 99 on test 1 85 on test 2 84 on test 3 and 99 on the final exam Round your answer to one decimal place 92 4 b Compute the average for a student with the above scores on the papers tests and final exam but with a score of only 15 on attendance Round your answer to one decimal place 89 6 X

Statistics
StatisticsSubmit Answer 1 Points DETAILS Submit Answer 6 Points rower because p of 0 25 is farther from 0 5 than PECKSTAT3 9 4 501 XP MI S USE SALT You may need to use the appropriate table in the appendix to answer this question In spite of the potential safety hazards some people would like to have an Internet connection in their car A preliminary survey of adult Americans has estimated this proportion to be somewhere around 0 30 Use the given preliminary estimate to determine the sample size required to estimate this proportion with a margin of error of 0 01 Round your answer up to the nearest integer DETAILS p of 0 64 Another reason is that the confidence level in part b is smaller PECKSTAT3 9 4 067 S than in parall MY NOTES MY NOTES Data from a representative sample were used to estimate that 34 of all computer users in a recent year had tried to get on a Wi Fi network that was not their own in order to save money You decide to conduct a survey to estimate this proportion for the current year What is the required sample size if you want to estimate this proportion with a margin of error of 0 04
Statistics
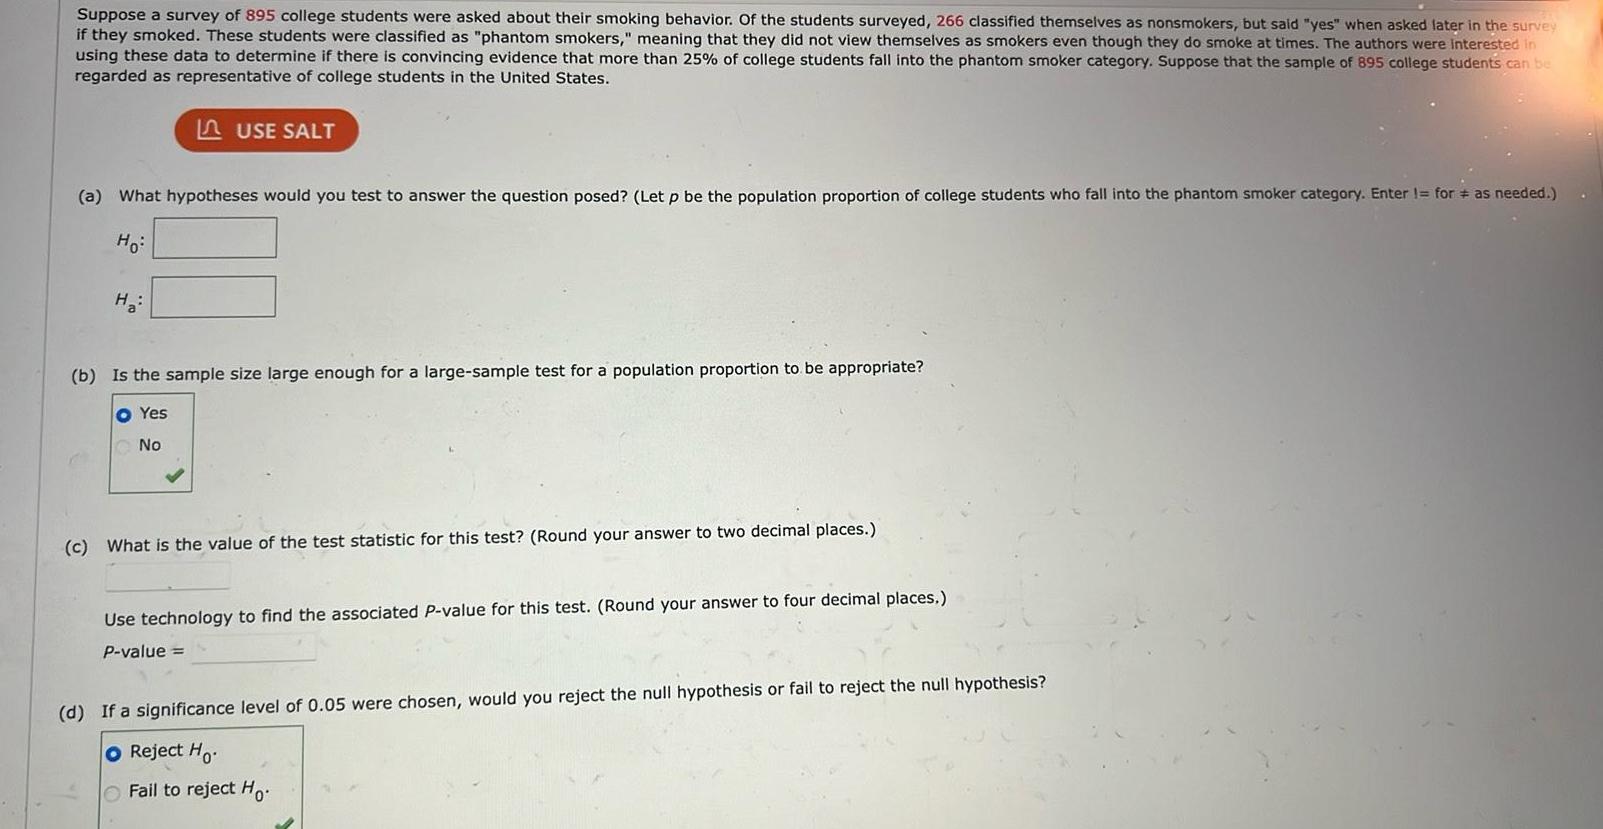
StatisticsSuppose a survey of 895 college students were asked about their smoking behavior Of the students surveyed 266 classified themselves as nonsmokers but said yes when asked later in the survey if they smoked These students were classified as phantom smokers meaning that they did not view themselves as smokers even though they do smoke at times The authors were interested in using these data to determine if there is convincing evidence that more than 25 of college students fall into the phantom smoker category Suppose that the sample of 895 college students can be regarded as representative of college students in the United States USE SALT a What hypotheses would you test to answer the question posed Let p be the population proportion of college students who fall into the phantom smoker category Enter for as needed Ho H b Is the sample size large enough for a large sample test for a population proportion to be appropriate o Yes No c What is the value of the test statistic for this test Round your answer to two decimal places Use technology to find the associated P value for this test Round your answer to four decimal places P value d If a significance level of 0 05 were chosen would you reject the null hypothesis or fail to reject the null hypothesis O Reject Ho Fail to reject Ho

Statistics
StatisticsPast experience is that when individuals are approached with a request to fill out and return a particular questionnaire in a provided stamped and addressed envelope the response rate is 41 An investigator believes that if the person distributing the questionnaire is stigmatized in some obvious way potential respondents would feel sorry for the distributor and thus tend to respond at a rate higher than 41 To test this theory a distributor wore an eye patch Of the 200 questionnaires distributed by this individual 101 were returned Does this provide evidence that the response rate in this situation is greater than the previous rate of 41 State and test the appropriate hypotheses at significance level 0 05 LUSE SALT State the appropriate null and alternative hypotheses Let p be the true proportion of questionnaires returned when the distributor wears an eye patch Enter for as needed Ho H Find the test statistic Round your answer to two decimal places MY NOTES Use technology to find the p value Round your answer to four decimal places p value State the conclusion in the problem context Do not reject Ho We have convincing evidence that more than 41 of all people who could be approached with a questionnaire will respond when the distributor wears an eye patch O Do not reject Ho We do not have convincing evidence that more than 41 of all people who could be approached with a questionnaire will respond when the distributor wears an eye patch O Reject Ho We have convincing evidence that more than 41 of all people who could be approached with a questionnaire will respond when the distributor wears an eye patch Reject Ho We do not have convincing evidence that more than 41 of all people who could be approached with a questionnaire will respond when the distributor wears an eye patch

Statistics
StatisticsConsider the variable x Time required for a college student to complete a standardized exam Suppose that for the population of students at a particular university the distribution approximated by a normal curve with mean 55 minutes and standard deviation 5 minutes Round your answers to four decimal places LUSE SALT a If 60 minutes is allowed for the exam what proportion of students at this university would be unable to finish in the allotted time b How much time in minutes should be allowed for the exam if you wanted 90 of the students taking the test to be able to finish in the allotted time min c How much time in minutes is required for the fastest 20 of all students to complete the exam min Submit Answer

Statistics
ProbabilityThe probability distribution of x the number of defective tires on a randomly selected automobile checked at a certain inspection station is given in the following table X p x 0 1 2 3 a Calculate the mean value of x Hx tires per car 4 0 55 0 18 0 05 0 05 0 17 b Interpret the mean value of x in the context of a long sequence of observations of number of defective tires tires per car In repeated inspections of cars at this station the mean number of defective tires is c What is the probability that x exceeds its mean value P x H d Calculate the standard deviation of x Round your answer to four decimal places tires per car Jy

Statistics
StatisticsSuppose in a representative sample of adult Americans ages 26 to 32 years 28 indicated that they owned a fitness band that kept track of the number of steps walked each day and their daily activity levels Suppose that the sample size was 400 Is there convincing evidence that more than one quarter of all adult Americans in this age group own a fitness band Test the relevant hypotheses using a significance level of 0 05 State the appropriate null and alternative hypotheses Let p the population proportion of adult Americans ages 26 to 32 years who own a fitness band Enter for as needed Ho H USE SALT Find the test statistic Round your answer to two decimal places Use technology to find the P value Round your answer to four decimal places P value MY NOTES State the conclusion in the problem context Reject Ho We have convincing evidence that more than one quarter of all adult Americans ages 26 to 32 years own a fitness band Reject Ho We do not have convincing evidence that more than one quarter of all adult Americans ages 26 to 32 years own a fitness band Fail to reject Ho We have convincing evidence that more than one quarter of all adult Americans ages 26 to 32 years own a fitness band Fail to reject Ho We do not have convincing evidence that more than one quarter of all adult Americans ages 26 to 32 years own a fitness band

Statistics
StatisticsIn a study to determine if using low intensity laser therapy reduces pain for orthodontic patients who are fitted with new braces patients were randomly assigned to either a control group who did n receive laser treatment or an experimental group who did receive laser treatment The researchers found that the mean pain rating was lower for those in the laser treatment group than for those the control group both two days and six days after receiving braces The researchers used these data to determine if there was evidence to support the claim that the mean pain rating is lower for patients who receive the laser treatment Answer the four key questions Q Question Type Estimation or hypothesis testing estimation O hypothesis testing S Study Type Sample data or experiment data Osample data O experiment data T Type of Data One variable or two Categorical or numerical one categorical variable one numerical variable Otwo categorical variables Otwo numerical variables MY NOTES N Number of Samples or Treatments How many samples or treatments one sample one treatment two samples two treatments

Statistics
ProbabilitySubmit Answer 2 4 Points The size of the left upper chamber of the heart is one measure of cardiovascular health When the upper left chamber is enlarged the risk of heart problems is increased A paper described a stu which the left atrial size was measured for a large number of children ages 5 to 15 years Based on this data the authors concluded that for healthy children left atrial diameter was approximat normally distributed with a mean of 26 1 mm and a standard deviation of 4 1 mm Round your answers to four decimal places DETAILS PECKSTAT3 6 R 109 S USE SALT a Approximately what proportion of healthy children have left atrial diameters less than 24 mm b Approximately what proportion of healthy children have left atrial diameters greater than 32 mm c Approximately what proportion of healthy children have left atrial diameters between 25 and 30 mm d For healthy children what is the value in mm for which only about 20 have a larger left atrial diameter mm MY NOT

Statistics
StatisticsAccording to a survey of a random sample of 2 255 adult Americans 1 157 of those surveyed said that they prefer name brands to store brands when purchasing frozen vegetables Suppose that you want to use this information to determine if there is convincing evidence that a majority of adult Americans prefer name brand frozen vegetables over store brand frozen vegetables a What hypotheses should be tested in order to answer this question Let p be the population proportion of adult Americans who prefer name brand frozen vegetables over store brand frozen vegetables Enter for as needed Ho H b The P value for this test is 0 1070 What conclusion would you reach if a 0 05 O Fail to reject Ho We have convincing evidence that a majority of adult Americans prefer name brand frozen vegetables over store brand frozen vegetables Reject Ho We have convincing evidence that a majority of adult Americans prefer name brand frozen vegetables over store brand frozen vegetables Reject Ho We do not have convincing evidence that a majority of adult Americans prefer name brand frozen vegetables over store brand frozen vegetables Fail to reject Ho We do not have convincing evidence that a majority of adult Americans prefer name brand frozen vegetables over store brand frozen vegetables Need Help Submit Answer Read It Watch It

Statistics
StatisticsThe article Public Acceptability in the UK and the USA of Nudging to Reduce Obesity The Example of Reducing Sugar Sweetened Beverages t describes a survey in which each person in a representative sample of 1 082 adult Americans was asked about whether they would find different types of interventions acceptable in an effort to reduce consumption of sugary beverages When asked about a tax on sugary beverages 459 of the people in the sample said they thought that this would be an acceptable intervention These data were used to test Ho p 0 5 versus H p 0 5 and the null hypothesis was rejected a Based on the hypothesis test what can you conclude about the proportion of adult Americans who think that taxing sugary beverages is an acceptable intervention in an effort to reduce consumption of sugary beverages MY NOTES There is not strong evidence that the proportion of adult Americans who think that taxing sugary beverages is an acceptable intervention in an effort to reduce consumption of sugary beverages is less than 0 5 There is not strong evidence that the proportion of adult Americans who think that taxing sugary beverages is an acceptable intervention in an effort to reduce consumption of sugary beverages is more than 0 5 There is strong evidence that the proportion of adult Americans who think that taxing sugary beverages is an acceptable intervention in an effort to reduce consumption of sugary beverages is less than 0 5 O There is strong evidence that the proportion of adult Americans who think that taxing sugary beverages is an acceptable intervention in an effort to reduce consumption of sugary beverages is more than 0 5 There is strong evidence that the proportion of adult Americans who think that taxing sugary beverages is an acceptable intervention in an effort to reduce consumption of sugary beverages is different from 0 5 ET b Is it reasonable to say that the data provide strong support for the alternative hypothesis O Yes No c Is it reasonable to say that the data provide strong evidence against the null hypothesis O Yes No

Statistics
Statistics2 Points Would you prefer having more money or more time An article in Social Psychological and Personality Science found that the majority of people in a sample of American adults chose n To determine if the data provide convincing evidence that the majority of people in the population would choose more money over more time what hypotheses should you test Let p population proportion of American adults who would choose more money over more time Ho DETAILS PECKSTAT3 10 1 008

Statistics
StatisticsThe article Euthanasia Still Acceptable to Solid Majority in U S summarized data from a survey of 1 025 adult Americans t When asked if doctors should be able to end a terminally ill patient s life by painless means if requested to do so by the patient 707 of those surveyed responded yes For purposes of this exercise assume that it is reasonable to regard this sample as a random sample of adult Americans Suppose that you want to use the data from this survey to decide if there is convincing evidence that more than two thirds of adult Americans believe that doctors should be able to end a terminally ill patient s life if requested to do so by the patient a What hypotheses should be tested in order to answer this question Let p be the population proportion of adult Americans who believe that doctors should be able to end a terminally ill patient s life if requested to do so by the patient Enter for as needed Ho H b The P value for this test is 0 0584 What conclusion would you reach if a 0 05 Oreject Ho fail to reject Ho c Would you have reached a different conclusion if a 0 10 Explain Yes now the P value is less than a Yes now the P value is greater than a O No the P value is still greater than a No the P value is still less than a

Statistics
StatisticsNo less than The U S Census Bureau reported that in 2019 the proportion of adult Americans ages 25 and older who have a bachelor s degree or higher is 0 36 t Consider the population of all adult Americans ages 25 and over in 2019 and define p to be the proportion of people in a random sample from this population who have a bachelor s degree or higher a Would p based on a random sample of only 10 people from this population have a sampling distribution that is approximately normal Explain why or why not approximately normally distributed because np is the sampling distribution of p based on a random sample of size 10 residents would not be 10 0 36 standard deviation 11 7575 b What are the mean and standard deviation of the sampling distribution of p if the sample size is 600 Round your standard deviation to four decimal places mean 2 022 mean MY NOTES x standard deviation PRACTICE ANOTHER c Suppose that the sample size is n 300 rather than n 600 What are the values for the mean and standard deviation when n 300 Round your standard deviation to four decimal places 0 36 0 0277 Does the change in sample size affect the mean and standard deviation of the sampling distribution of p If not explain why not Select all that apply When the sample size decreases the mean increases When the sample size decreases the mean decreases When the sample size decreases the mean stays the same The sampling distribution is always centered at the population mean regardless of sample size When the sample size decreases the standard deviation increases When the sample size decreases the standard deviation decreases When the sample size decreases the standard deviation stays the same The standard deviation of the sampling distribution is always the same as the standard deviation of the population distribution regardless of sample size X

Statistics
StatisticsThe birth of a baby is considered to be premature if the baby is born before 37 weeks of pregnancy have been completed According to a study 10 of babies born in the United States in a part year were premature Suppose that a random sample of 57 babies born in the U S in this year will be selected The proportion of the babies who were premature p will be calculated a What are the mean and standard deviation of the sampling distribution of p Round your standard deviation to four decimal places mean X standard deviation 0 10 0 0436 b Is the sampling distribution of p approximately normal Explain The sampling distribution of p is not approximately normal because n 1 p is at least 10 O The sampling distribution of p is not approximately normal because np is less than 10 O The sampling distribution of p is not approximately normal because n 1 p is less than 10 The sampling distribution of p is approximately normal because np and n 1 p are both less than 10 The sampling distribution of p is approximately normal because np and n 1 p are both at least 10 Submit Answer X c What is the smallest value of n for which the sampling distribution of p would be approximately normal n 10 x

Statistics
StatisticsAn article about the relative priorities of protecting the environment and the economy in America summarized a survey of 1 600 adult U S citizens When asked whether protecting the environment or protecting jobs should have a higher priority 832 of the survey participants chose protecting the environment The article states that participants were selected to be representative of all adult U S citizens a Estimate the proportion of adult U S citizens who think that protecting the environment should be a higher priority than protecting jobs What statistic did you use 0 52 What statistic did you use O sample proportion Opopulation proportion MY NOTES b Use the sample data to estimate the standard error of p c Calculate the margin of error associated with the estimate in Part a Round your answer to three decimal places PRACTICE ANOTHER Interpret the margin of error in the context of this problem It is impossible that the estimated proportion of adult U S citizens who think that protecting the environment should be a higher priority than protecting jobs differs from the true population proportion by less than the calculated value O It is unlikely that the estimated proportion of adult U S citizens who think that protecting the environment should be a higher priority than protecting jobs differs from the true population proportion by more than the calculated value It is impossible that the estimated proportion of adult U S citizens who think that protecting the environment should be a higher priority than protecting jobs differs from the true population proportion by more than the calculated value It is likely that the estimated proportion of adult U S citizens who think that protecting the environment should be a higher priority than protecting jobs differs from the true population proportion by the calculated value It is unlikely that the estimated proportion of adult U S citizens who think that protecting the environment should be a higher priority than protecting jobs differs from the true population proportion by less than the calculated value

Statistics
StatisticsWhen a website asks you to agree to a privacy policy do you actually read the policy before agreeing Researchers asked people in a representative sample of 4 272 adults in the United States if they read privacy policies and found that 940 said that they always or often read them The paper also says that of the 2 600 people who said they at least look at privacy policies before agreeing to them 32 said that they understood very little or none of the privacy policies they read USE SALT a Use the given information to estimate the proportion of people who at look at privacy policies before agreeing to them who understand very little or none of the policies Use a 95 confidence interval You can assume that the sample of 2 600 people is representative of the population of interest Enter your answer using interval notation Round your numerical values to three decimal places Give an interpretation of the interval in context There is a 95 chance that the actual proportion of people who at least look at privacy policies before agreeing to them who understand very little or none of the policies falls within this interval There is a 99 chance that the true proportion of people who at least look at privacy policies before agreeing to them who understand very little or none of the policies falls directly in the middle of this interval We are 95 confident that the actual proportion of people who at least look at privacy policies before agreeing to them who understand very little or none of the policies is within this interval We are 95 confident that the actual proportion of people who at least look at privacy policies before agreeing to them who understand very little or none of the policies falls directly in the middle of this interval We are 95 confident that the mean number of people who at least look at privacy policies before agreeing to them who understand very little or none of the policies falls within this interval b Would a 90 confidence interval be wider or narrower than the 95 confidence interval from part a the 05 confidence interval from part a because the z critical value is smaller

Statistics
StatisticsA certain article indicates that in a sample of 1 000 dog owners 660 said that they take more pictures of their dog than of their significant others or friends and 420 said that they are more likely to complain to their dog than to a friend Suppose that it is reasonable to consider this sample as representative of the population of dog owners USE SALT X The interval should have only two values MY NOTES a Construct a 90 confidence interval for the proportion of dog owners who take more pictures of their dog than of their significant others or friends Enter your answer using interval notation Round your numerical values to three decimal places PRACTICE ANOTHE Interpret the interval There is a 90 chance that the true proportion of dog owners who take more pictures of their dog than of their significant others or friends falls within this interval We are 90 confident that the true proportion of dog owners who take more pictures of their dog than of their significant others or friends falls within this interval We are 90 confident that the true proportion of dog owners who take more pictures of their dog than of their significant others or friends falls directly in the middle of this interval We are 90 confident that the mean number of dog owners who take more pictures of their dog than of their significant others or friends falls within this interval There is a 90 chance that the true proportion of dog owners who take more pictures of their dog than of their significant others or friends falls directly in the middle of this interval X The interval should have only two values b Construct a 95 confidence interval for the proportion of dog owners who are more likely to complain to their dog than to a friend Enter your answer using interval notation Round your numerical values to three decimal places Interpret the interval O We are 95 confident that the true proportion of dog owners who are more likely to complain to their dog than to a friend falls directly in the middle of this interval O There is a 95 chance that the true proportion of dog owners who are more likely to complain to their dog than to a friend falls within this interval There is a 95 chance that the true proportion of dog owners who are more likely to complain to their dog than to a friend falls directly in the middle of this interval O We are 95 confident that the mean number of dog owners who are more likely to complain to their dog than to a friend falls within this interval We are 95 confident that the true proportion of dog owners who are more likely to complain to their dog than to a friend falls within this interval

Statistics
StatisticsChapter 9 Quiz MATH1123 section OB C Solved The formula used to compute a la Usand randomly selected adult Americans participated in a survey When asked Do you think it is sometimes justified to lie or do you think lying is never justified 55 responded that lying was never justified When asked about lying to avoid hurting someone s feelings 670 responded that this was often or sometimes OK USE SALT a Construct a 90 confidence interval for the proportion of adult Americans who think lying is never justified Enter your answer using interval notation Round your numerical values to three decimal places Interpret the interval We are 90 confident that the true proportion of adult Americans who think lying is never justified falls directly in the middle of this interval There is a 90 chance that the true proportion of adult Americans who think lying is never justified falls within this interval We are 90 confident that the mean number of adult Americans who think lying is never justified falls within this interval O There is a 90 chance that the true proportion of adult Americans who think lying is never justified falls directly in the middle of this interval O We are 90 confident that the true proportion of adult Americans who think lying is never justified falls within this interval b Construct a 90 confidence interval for the proportion of adult Americans who think that it is often or sometimes OK to lie to avoid hurting someone s feelings Enter your answer using interval notation Round your numerical values to three decimal places Interpret the interval We are 90 confident that the true proportion of adult Americans who think that it is often or sometimes OK to lie to avoid hurting someone s feelings falls directly in the middle of this interval There is a 90 chance that the true proportion of adult Americans who think that it is often or sometimes OK to lie to avoid hurting someone s feelings falls within this interval We are 90 confident that the true proportion of adult Americans who think that it is often or sometimes OK to lie to avoid hurting someone s feelings falls within this interval There is a 90 chance that the true proportion of adult Americans who think that it is often or sometimes OK to lie to avoid hurting someone s feelings falls directly in the middle of this interval o We are 90 confident that the mean number of adult Americans who think that it is often or sometimes OK to lie to avoid hurting someone s feelings falls within this interval c Using the confidence intervals from parts a and b comment on the apparent inconsistency in the responses dicator that it is Aplausible that at least 50 of adult Americans would say that lying is never justified The confidence interval in part b D

Statistics
StatisticsMY NOTES USE SALT PRACTICE ANOTHER An article included data from a survey of a random sample of adults living in the United States Of the 1 300 people who participated in the survey 700 responded they believe that global climate change is a major threat to the well being of the United States Use the five step process for estimation problems EMC3 to construct a 95 confidence interval for the proportion of adults in the United States who believe that global climate change is a major threat to the well being of the United States Hint See Example 9 4 Enter your answer using interval notation Round your numerical values to three decimal places Interpret the interval We are 95 confident that the true proportion of all adults in the United States who believe that global climate change is a major threat to the well being of the United States is directly in the middle of this confidence interval We are 95 confident that the mean number of all adults in the United States who believe that global climate change is a major threat to the well being of the United States is within this confidence interval There is a 95 chance that the mean number of all adults in the United States who believe that global climate change is a major threat to the well being of the United States is directly in the middle of this confidence interval We are 95 confident that the true proportion of all adults in the United States who believe that global climate change is a major threat to the well being of the United States is within this confidence interval There is a 95 chance that the true proportion of all adults in the United States who believe that global climate change is a major threat to the well being of the United States is directly in the middle of this confidence interval

Statistics
StatisticsSample proportion for samples of size 70 Histogram A was constructed by selecting 100 different random samples of size 40 from a population consisting of 20 part time students and 80 full time students For each sample the sample proportion of part time students p was calculated The 100 p values were used to construct the histogram Histogram B was constructed in a similar way but using samples of size 70 a Which of the two histograms indicates that the value of p has smaller sample to sample variability How can you tell Histogram A indicates that the value of p has smaller sample to sample variability than Histogram B because Histogram A has values that tend to deviate more from the center than Histogram B indicating a larger standard deviation of the values of p O Histogram A indicates that the value of p has smaller sample to sample variability than Histogram B because Histogram A has values that tend to deviate less from the center than Histogram B indicating a larger standard deviation of the values of p Histogram B indicates that the value of p has smaller sample to sample variability than Histogram A because Histogram B has values that tend to deviate more from the center than Histogram A indicating a larger standard deviation of the values of p Histogram B indicates that the value of p has smaller sample to sample variability than Histogram A because Histogram B has values that tend to deviate less from the center than Histogram A indicating a smaller standard deviation of the values of p Histogram A indicates that the value of p has smaller sample to sample variability than Histogram B because Histogram A has values that tend to deviate less from the center than Histogram B indicating a smaller standard deviation of the values of p b For which of the two sample sizes n 40 or n 70 do you think the value of p would be less likely to be close to 0 20 What about the given histograms supports your choice Samples of size n 70 would yield a value of p that is less likely to be close to 0 20 because the histogram for n 70 seems to have less sample to sample variability Samples of size n 40 would yield a value of p that is less likely to be close to 0 20 because the histogram for n 40 seems to have more sample to sample variability Samples of size n 40 would yield a value of p that is less likely to be close to 0 20 because the histogram for n 40 seems to have less sample to sample variability O Samples of size n 70 would yield a value of p that is less likely to be close to 0 20 because the histogram for n 70 seems to have more sample to sample variability O Samples of size n 40 would yield a value of p that is less likely to be close to 0 20 because the histogram for n 40 is not centered at 0 20

Statistics
ProbabilityThe Average American Is in Credit Card Debt No Matter the Economy reported that only 35 of credit card users pay off their bill every month Suppose that the reported perce was based on a random sample of 2 000 credit card users You are interested in learning about the value of p the proportion of all credit card users who pay off their bill every month The following table is similar to the table that appears in Examples 8 4 and 8 5 and is meant to summarize what you know about the sampling distribution of p in the situation just described What You Know information has been provided Complete the table by filling in the How You Know It column What You Know The sampling distribution of p is centered at the actual but unknown value of the population proportion An estimate of the standard deviation of p which describes how much the p values spread out around the population proportion p is 0 011 p p p P 0x P H p 0 5 H p X 0 35 1 0 35 2 000 0 35 1 0 35 2 000 0 35 1 0 35 2 000 0 35 1 0 35 2 000 10 3561035 How You Know It MY NOTES PRACTICE ANC

Statistics
StatisticsA random sample is to be selected from a population For which of the following sample sizes would the sampling distribution of p be approximately normal if p 0 60 Select all that apply 00 n 50 UU n 10 n 100 n 200 15 n 20 For which of the following sample sizes would the sampling distribution of p be approximately normal if p 0 3 Select all that apply r n 30 r n 10 n 20 n 30 n 50 n 100 n 200 X

Statistics
StatisticsSuppose that 925 smokers each received a nicotine patch which delivers nicotine to the bloodstream at a much slower rate than cigarettes do Dosage was decreased to 0 over a 12 week period Of these 925 people 245 were still not smoking 6 months after treatment Assume this sample is representative of all smokers a Use the given information to estimate the proportion of all smokers who when given this treatment would refrain from smoking for at least 6 months Round your answer to three decimal places 0 265 b Verify that the conditions needed in order for the margin of error formula to be appropriate are met The condition that the sample is a random sample from the population of interest or the sample is selected in a way that should result in a representative sample is met condition that the sample size is large is met c Calculate the margin of error Round your answer to three decimal places 0 028 8 The d Interpret the margin of error in the context of this problem It is impossible that the estimated proportion of smokers who when given this treatment would refrain from smoking for at least six months differs from the true population proportion by less than the value calculated in part c It is unlikely the estimated proportion of smokers who when given this treatment would refrain from smoking for at least six months differs from the true population proportion by more than the value calculated in part c It is unlikely that the estimated proportion of smokers who when given this treatment would refrain from smoking for at least six months differs from the true population proportion by less than the value calculated in part c It is impossible that the estimated proportion of smokers who when given this treatment would refrain from smoking for at least six months differs from the true population proportion by more than the value calculated in part c O It is likely that the estimated proportion of smokers who when given this treatment would refrain from smoking for at least six months differs from the true population proportion by the value calculated in part c X

Statistics
StatisticsForensic evidence such as DNA analysis and fingerprints is often introduced as part of the evidence presented in criminal trials A paper describes a study to learn about how potential jurors forensic evidence Each person in a sample of 153 adult Americans was asked if they agreed with the following statement If forensic evidence suggests a defendant is guilty this should be en convict even if other evidence e g eyewitness testimony alibi suggest otherwise Fifty nine responded that they agreed either strongly agreed or somewhat agreed with this statement S that it is reasonable to regard this sample as a random sample from the population of potential jurors and that you are interested in learning about the proportion of all potential jurors who ac the given statement The following table is similar to the table that appears in Examples 8 4 and 8 5 and is meant to summarize what you know about the sampling distribution of p in the situation just described What You Know information has been provided Complete the table by filling in the How You Know It column What You Know The sampling distribution of p is centered at the actual but unknown value of the population proportion An estimate of the standard deviation of p which describes how much the p values spread out around the population is 0 0394 H p P p H p 0 p p Hp X 59 153 59 153 59 0 153 P 1 59 153 1 153 59 1 5 153 59 153 1 59 153 59 1ER How You Know It

Statistics
StatisticsFor which of the following sample sizes would the sampling distribution of p be approximately normal when p 0 3 Select all that apply n 10 n 25 n 50 n 100 For which of the following sample sizes would the sampling distribution of p be approximately normal when p 0 7 Select all that apply n 10 n 25 n 50 n 100 For which of the following sample sizes would the sampling distribution of p be approximately normal when p 0 58 Select all that apply n 10 n 25 n 50 n 100 x

Statistics
StatisticsResearchers at a drug company are testing the duration of a new pain reliever The drug is normally distributed with a mean duration of 240 minutes 4 hours and a standard deviation of 40 minutes The drug is administered to a random sample of 10 people Round means standard deviations and z scores to the nearest hundredth if necessary 1 What is the population mean 240 in minutes 2 What is the population standard deviation 40 in minutes 3 What is the sample size 10 4 Can normal approximation be use for this problem Yes it is given that the population distribution is normally distributed 5 What is the mean of the sample means 240 in minutes 6 What is the standard deviation of the sample means 12 65 What is the probability that the drug will wear off in less than 200 minutes 1 What is the z score 0 2 x 2 What is the requested probability P x 200 0 91 2 What is the requested probability P x What is the probability that the drug will wear off after 220 minutes 1 What is the z score 2 x 220 0 866 x What is the probability that the drug will wear off between 200 and 220 minutes 1 P 200x220 0 418 x 4

Statistics
Statisticshappen to the lever or commencer vvnyr g Suppose that the firm decided that it needed to be at least 96 percent confident of the population mean length of time to within one hour How would the number of people the firm surveys change Why 98 A sample of 16 small bags of the same brand of candies was selected Assume that the population distribution of bag weights is normal The weight of each bag was then recorded The mean weight was two ounces with a standard deviation of 0 12 ounces The population standard deviation is known to be 0 1 ounce a i x ii 0 iii Sx b In words define the random variable X c In words define the random variable X d Which distribution should you use for this problem Explain your choice e Construct a 90 percent confidence interval for the population mean weight of the candies i State the confidence interval ii Sketch the graph iii Calculate the error bound f Construct a 98 percent confidence interval for the population mean weight of the candies i State the confidence interval ii Sketch the graph iii Calculate the error bound q In complete sentences explain why the confidence interval in Part f is larger than the confidence interval

Statistics
Statistics6 Suppose Z is a standard normal random variable with probability density function f z Which probability statement below is numerically equivalent to the shaded area below f z 3 2 1 O P Z 1 O P Z 1 P 0 Z 1 P Z 1 9 0 1 T 2 3 Z

Statistics
Statistics2 X is a normal random variable with probability density function f x given below x 8 f x 4 What is the variance of x Answer Continue Reset answer

Statistics
Statistics5 Suppose X is a normal random variable with probability density function f x Which probability statement below is numerically equivalent to the shaded area below f x 42 48 54 P 48 X 72 P 54 X 72 P 54 X 66 O P 48 X 66 60 66 72 78 X

Statistics
StatisticsQuestion 4 of 6 4 Suppose Z is a standard normal random variable Which probability statement below is numerically equal to the probability statement P Z 1 5 QP Z 1 5 O 1 P Z 1 5 O P Z 2 O P Z 1 5 Continue Reset answer

Statistics
Statistics132 Apolling group recently conducted a survey asking adults across the United States about music preferences When asked 80 of the 571 participants download music weekly a Create a 99 percent confidence interval for the true proportion of American adults who download music weekly b This survey was conducted through automated telephone interviews on May 6 and 7 2013 The error bound of the survey compensates for sampling error or natural variability among samples List some factors that could affect the survey s outcome that are not covered by the margin of error c Without performing any calculations describe how the confidence interval would change if the confidence level decreased from 99 percent to 90 percent ampus to learn about the political awareness of students

Statistics
Statistics100 What is meant by the term 90 percent confident when constructing a confidence interval for a mean a If we took repeated samples approximately 90 percent of the samples would produce the same confidence interval b If we took repeated samples approximately 90 percent of the confidence intervals calculated from those samples would contain the sample mean c If we took repeated samples approximately 90 percent of the confidence intervals calculated from those samples would contain the true value of the population mean d If we took repeated samples the sample mean would equal the population mean in approximately 90 percent of the samples d disbursements

Statistics
Statistics98 A sample of 16 small bags of the same brand of candies was selected Assume that the population distribution of bag weights is normal The weight of each bag was then recorded The mean weight was two ounces with a standard deviation of 0 12 ounces The population standard deviation is known to be 0 1 ounce a i x ii G iii S b In words define the random variable X c In words define the random variable X d Which distribution should you use for this problem Explain your choice e Construct a 90 percent confidence interval for the population mean weight of the candies i State the confidence interval ii Sketch the graph iii Calculate the error bound f Construct a 98 percent confidence interval for the population mean weight of the candies i State the confidence interval ii Sketch the graph iii Calculate the error bound g In complete sentences explain why the confidence interval in Part f is larger than the confidence interval in Part e h In complete sentences give an interpretation of what the interval in Part f means 99 A camp director is interested in the mean number of letters ech child sends during his or her camp session The population standard deviation is known to be 2 5 A survey of 20 campers is taken The mean from the sample is 7 9 with a sample standard deviation of 2 8 a i x ii 0

Statistics
Statistics5 Suppose X is a continuous random variable with probability density function f x Determine whether the following statement is true or false P 0 50 X 1 is numerically equal to P X 0 50 2 0 1 O True O False Previous Answer b X Change answer Cancel and return K

Statistics
StatisticsIntervais constructed should contain the population mean worth of Coupons LAPIain wity Use the following information to answer the next two exercises A quality control specialist for a restaurant chain takes a random sample of size 12 to check the amount of soda served in the 16 oz serving size The sample mean is 13 30 with a sample standard deviation of 1 55 Assume the underlying population is normally distributed 115 Find the 95 percent confidence interval for the true population mean for the amount of soda served a 12 42 14 18 b 12 32 14 29 c 12 50 14 10 d Impossible to determine 116 Which of the following is the error bound a 0 87 b 1 98 c 0 99 171

Statistics
Probability4 Suppose X is a continuous random variable with probability density function f x Express the shaded region as a probability statement 2 0 1 OP 0 X 1 OP 0 50 X 1 O P X 1 OP 0 x 0 50 Previous Answer d X

Statistics
Statistics111 Unoccupied seats on flights cause airlines to lose revenue Suppose a large airline wants to estimate its mean number of unoccupied seats per flight over the past year To accomplish this the records of 225 flights are randomly selected and the number of unoccupied seats is noted for each of the sampled flights The sample mean is 11 6 seats and the sample standard deviation is 4 1 seats a 1 x ii Sx iii n iv n 1 b Define the random variables X and X in words c Which distribution should you use for this problem Explain your choice d Construct a 92 percent confidence interval for the population mean number of unoccupied seats per flight i State the confidence interval ii Sketch the graph iii Calculate the error bound 112 In a recent sample of 84 used car sales costs the sample mean was 6 425 with a standard deviation of dintribution is approximately normal
Statistics
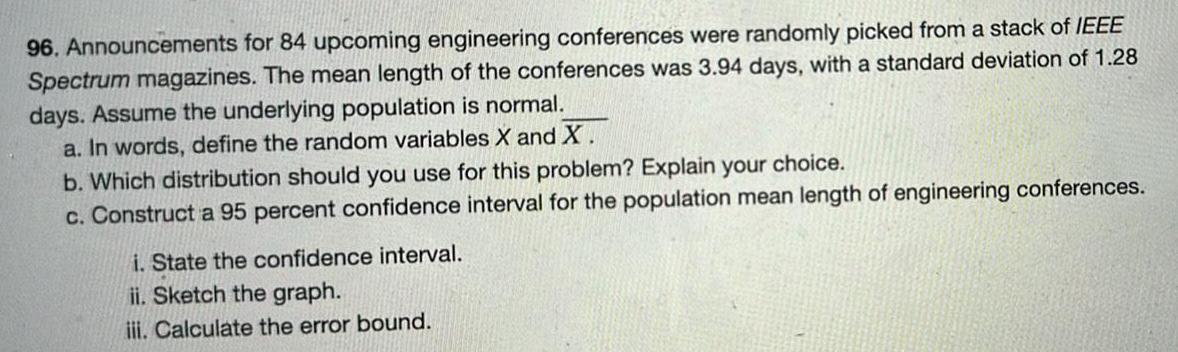
Statistics96 Announcements for 84 upcoming engineering conferences were randomly picked from a stack of IEEE Spectrum magazines The mean length of the conferences was 3 94 days with a standard deviation of 1 28 days Assume the underlying population is normal a In words define the random variables X and X b Which distribution should you use for this problem Explain your choice c Construct a 95 percent confidence interval for the population mean length of engineering conferences i State the confidence interval ii Sketch the graph iii Calculate the error bound

Statistics
Statistics118 Suppose that the insurance companies did conduct a survey They randomly surveyed 400 drivers and found that 320 claimed they always buckle up We are interested in the population proportion of drivers who claim they always buckle up a i x ii n iii p b Define the random variables X and P in words c Which distribution should you use for this problem Explain your choice d Construct a 95 percent confidence interval for the population proportion who claim they always buckle up i State the confidence interval ii Sketch the graph iii Calculate the error bound e If this survey were done by telephone list three difficulties the companies might have in obtaining dem rosults
Statistics
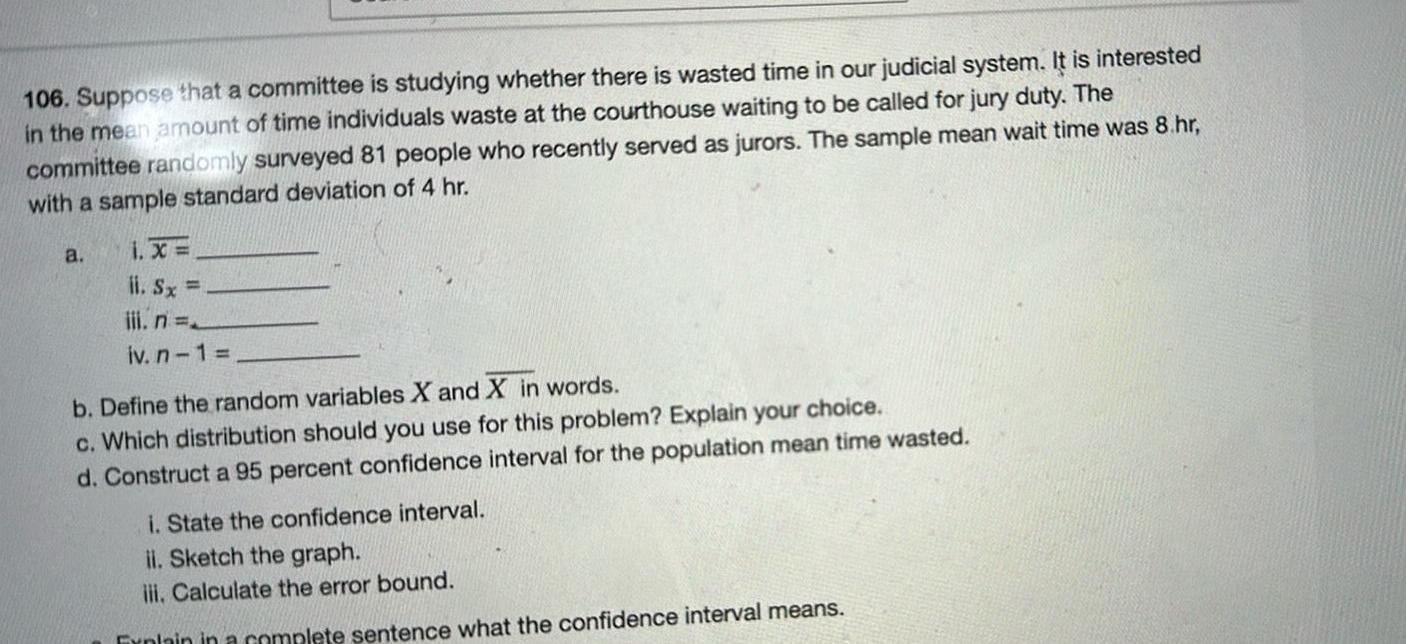
Statistics106 Suppose that a committee is studying whether there is wasted time in our judicial system It is interested in the mean amount of time individuals waste at the courthouse waiting to be called for jury duty The committee randomly surveyed 81 people who recently served as jurors The sample mean wait time was 8 hr with a sample standard deviation of 4 hr a 1 x ii Sx iii n iv n 1 b Define the random variables X and X in words c Which distribution should you use for this problem Explain your choice d Construct a 95 percent confidence interval for the population mean time wasted i State the confidence interval ii Sketch the graph iii Calculate the error bound Explain in a complete sentence what the confidence interval means

Statistics
Statistics2 Define f x 0 50 for x in 0 1 for x in 1 1 5 f x 1 5 x f x 0 for x outside of 0 1 5 Find the area between f x and the x axis over the entire real line Answer Continue Reset answer

Statistics
ProbabilityA newspaper story claims that more houses are purchased by singles now than singles 5 years ago To test this claim two studies were conducted on the buying habits of singles over the past 5 years In the first study 200 house purchases in the current year were randomly selected and 80 of those were made by singles In the second study again 200 house purchases were randomly selected from 5 years ago and 65 of those were made by single people Test the newspaper s claim using a 0 01 level of significance Is there sufficient evidence to support the newspaper s claim Let singles now be Population 1 and let singles 5 years ago be Population 2 Step 1 of 3 State the null and alternative hypotheses for the test Fill in the blank below Ho P1 P2 Ha P1

Statistics
StatisticsThe answer above is NOT correct Find the least squares regression line y bo bi through the points 3 1 0 7 6 13 8 18 11 26 For what value of x is 0 2 0

Statistics
ProbabilityIsle Royale an Island in Lake Superior has provided an important study site of wolves and their prey Of special interest is the study of the number of moose killed by wolves In the period from 1958 to 1974 there were 296 moose deaths identified as wolf kills The age distribution of the kills is as follows Age of Moose in Years Calf 0 5 yr 1 5 6 10 11 15 16 20 USE SALT Number Killed by Wolves 105 50 77 58 6 a For each age group compute the probability that a moose in that age group is killed by a wolf Round your answers to four decimal places 0 5 1 5 6 10 11 15 16 20 b Consider all ages in a class equal to the class midpoint Find the expected age of a moose killed by a wolf and the standard deviation of the ages Round your answers to two decimal places U

Statistics
StatisticsA stationary store has decided to accept a large shipment of ball point pens if an inspection of 15 randomly selected pens yields no more than two defective pens a Find the probability that this shipment is accepted if 10 of the total shipment is defective Round your answer to three decimal places b Find the probability that this shipment is not accepted if 15 of the total shipment is defective Round your answer to three decimal places

Statistics
StatisticsAllergic reactions to poison ivy can be miserable Plant oils cause the reaction Researchers at Allergy Institute did a study to determine the effects of washing the oil off within 5 minutes of exposure A random sample of 1000 people with known allergies to poison ivy participated in the study Oil from the poison ivy plant was rubbed on a patch of skin For 500 of the subjects it was washed off within 5 minutes For the other 500 subjects the oil was washed off after 5 minutes The results are summarized in the following table Within 5 Minutes After 5 Minutes 409 66 25 500 Let s use the following notation for the various events W washing oil off within 5 minutes A washing oil off after 5 minutes N no reaction M mild reaction S strong reaction Find the following probabilities for a person selected at random from this sample of 1000 subjects Use 3 decimal places a P N P M P S Reaction None Mild Strong Column Total b P NW P SW c P NA P SA d P N and W P M and W e PIN or M 70 330 100 500 Row Total 479 396 125 1000

Statistics
StatisticsProblem 07 122 Final equilibrium temperature and entropy change in insulated and sealed room One ton of liquid water at 80 C is brought into a well insulated and well sealed 4 mx 5 mx 7 m room initially at 22 C and 100 kPa Use data from tables 4mx5m x 7m Room 22 C 100 kPa Water 80 C Heat Problem 07 122 b Entropy generated during the process Determine the total entropy change during this process in kJ K The total entropy change during this process is ILUV

Statistics
StatisticsAccording the April 12 2017 Pew Research survey 58 of Americans approve of US missile strikes in Syria in response to reports of the use of chemical weapons by Bashar al Assad s government the Syrian government A sample of 50 Americans are surveyed Let p be the sample proportion of Americans who approve the U S missile strikes 1 What is the population proportion decimal form 2 What is the sample size 3 Can the normal approximation be used with this distribution 4 What is the mean of the sampling proportion 5 What is the standard deviation sampling proportion Round to 4 decimal places 6 What is the probability that no more than 25 Americans of the 50 in the survey approve of the missile strikes What is p What is the z score What is the requested probability P p Round to the nearest hundredth 0 5 7 What is the probability that more than 30 of the 50 Americans in the survey approved of the missile strikes What is p What is the z score Round to the nearest hundredth 0 6 What is the requested probability P p