Statistics Questions
The best high school and college tutors are just a click away, 24×7! Pick a subject, ask a question, and get a detailed, handwritten solution personalized for you in minutes. We cover Math, Physics, Chemistry & Biology.

Statistics
ProbabilityFor families with 5 children let X be the number of children with Genetic Condition B Can the following table be a probability distribution for the random variable X x P x 1 0 2332 2 0 0311 3 0 114 4 0 5199 0 1018 LO 5 O no Q yes

Statistics
ProbabilityComplete the following probability distribution table X 27 12 49 67 86 P X 0 24 0 14 0 26 0 2

Statistics
ProbabilityCan the following table be a probability distribution X P x 1 0 2077 2 0 0943 3 0 3281 4 0 1105 5 0 3232 O yes O no

Statistics
StatisticsSuppose that the random variable z shown below represents the number of speeding tickets a person received in a three year period P z represents the probability of a randomly selected person having received that number of speeding tickets during that period Use the probability distribution table shown below to answer the following questions P x 3 P x 2 x a What is the probability that a randomly selected person has received one tickets in a three year period P x 1 b What is the probability that a randomly selected person has received two tickets in a three year period P x 2 c What is the probability that that a randomly selected person has received more than three tickets in a three year period 0 1 2 3 4 5 6 P x 0 29 0 2307 0 2201 0 1803 0 0451 0 0338 0 0000 d What is the probability that that a randomly selected person has received two or less tickets in a three year period

Statistics
StatisticsTranslate the following verbal statement into an algebraic equation and then solve Use for your variable The difference of four times a number and seven is ten Equation x


Statistics
StatisticsType the standard notation value for 2 593E 4 Recall the E represents 10 in scientific notation For example 3 2 E 5 is the same as 3 2 105 X

Statistics
ProbabilityTranslate the following verbal statement into an algebraic equation and then solve Use for your variable The sum of three times a number and six is nine Equation x


Statistics
StatisticsRachelle is malling out pool party Invites to celebrate the start of summer She has orange O yellow Y and pink P cards and orange O yellow Y and pink P envelopes to send them in She chooses a card and an envelope at random for each person What is the sample space for possible combinations Enter each outcome as a two letter word with the first letter for the card and the second letter for the envelope For example PW would be a pink card in a white envelope Separate each element by a comma Submit Question

Statistics
Statistics11 18 19 26 27 34 35 42 43 50 1 4 5 4 2 Answer The frequency distribution above summarizes a simple random sample from a population Using the frequency distribution approximate the sample mean using the formula from section 3 3 Round the final answer to the nearest hundredths 4 Continue

Statistics
StatisticsLet R be the region bounded by the following curves Use the shell method to find the volume of the solid generated when R is revolved about the x axis y 2x y 2 y 256 and x 0 CA S 2 2xy OB dx dy vact answer GRIECHE

Statistics
StatisticsAge 11 18 19 26 27 34 35 42 Frequency 2 4 6 4 The frequency distribution above summarizes a simple random sample from a population Using the frequency distribution approximate the sample variance using the formula from section 3 3

Statistics
StatisticsWeight IBS 101 120 121 140 141 160 161 180 4 5 5 7 The frequency distribution above summarizes a small population The population variance is approximated to be 500 68 using the frequency distribution above and the formula from section 3 3 What is the approximate population standard deviation Round your answer to the nearest hundredths Answer

Statistics
StatisticsWeight lbs 101 120 121 140 141 160 161 180 Frequency 3 5 Answer 8 5 The frequency distribution above summarizes a small population Using the frequency distribution approximate the population mean using the formula from section 3 3 Round the final answer to the nearest hundredths

Statistics
StatisticsHeight inches 48 49 99 50 51 99 52 53 99 54 55 99 56 57 99 58 59 99 Frequency 3 8 6 3 2 1 The frequency distribution above summarizes a simple random sample from a population Using the frequency distribution approximate the sample mean using the formula from section 3 3 Round the final answer to the nearest hundredths Answer

Statistics
StatisticsUnit 1 Please answer all parts of the question Please provide graphical and numerical justification Hint normal distribution curve IQ scores are normally distributed with a mean of 100 and a standard deviation of 15 Using the empirical rule what percentage of people have an IQ score between 55 and 145

Statistics
ProbabilityYou want to obtain a sample to estimate a population proportion Based on previous evidence you believe the population proportion is approximately p 0 29 You would like to be 98 confident that your esimate is within 1 5 of the true population proportion How large of a sample size is required n

Statistics
StatisticsYou must answer in words and show you work mathematically I Unit 3 Please answer all parts of the question Math 3 7 1 Key Features of Radical Functions Consider the function f x 2 x 3 4 1 Record all of the transformations of f x from the parent function g x 2 Determine the domain and range 3 Determine the end behavior

Statistics
Statistics2 Please explain in words how to solve by completing the square Please identify the error Completing The Square Method and Solving Quadratic Equations Algebra 2 x 6x 15 x 6x 9 x 3 24 www 15 9

Statistics
StatisticsUnit 2 Please answer all parts of the question 1 Heather dropped a water balloon over the side of her school building from a height of 80 feet The approximate height of the balloon at any point during its fall can be represented by the following quadratic equation h 16t 80 Please explain in words the time it takes for the balloon to hit the ground Please include when the balloon hits the ground

Statistics
StatisticsCoffee and blood pressure A scientist suspects that coffee increases blood pressure So he measures the systolic blood pressure of six random patients and then measures it again 30 minutes after they drink a single cup of caffeinated coffee The results are tabulated below Test the claim that coffee causes an increase in blood pressure Before Coffee After Coffee a Why are these paired data O Most of the After Coffee values are smaller than the corresponding Before Coffee values O This table does not have paired data there is no clear relationship between the data in each column O Each column contains data from the same patient O The after and before rows are the same size b Write the hypotheses in symbols Note that this problem uses Hdiff before after instead of diff after before so be careful O Ho Hdiff before after 0 Ha Hdiff before after 0 100 120 112 114 115 121 102 121 112 119 118 123 O Ho Hdiff before after 0 Ha Hdiff before after 0 O Ho Hdiff before after 0 Ha Hdiff before after 0 c Put the list of differences in your calculator and use T Test to find the p value P please round to four decimal places d What is the conclusion of the hypothesis test Since p 0 05 we do not have enough evidence to reject the null hypothesis Since p 0 05 we reject the null hypothesis and accept the alternative

Statistics
Statistics4 Find the mean of the data set 6 11 7 15 6 10 4 Round your answer to the nearest hundredths Answer

Statistics
StatisticsResearch has shown that losing even one night of sleep can have a significant effect on performance of complex tasks such as problem solving Linde Bergstroem 1992 To demonstrate this phenomenon a researcher conducted the following simulated experiment A sample of n 32 college students was given a problem solving task at noon on one day and again at noon on the following day The students were not permitted any sleep between the two tests For each student the difference between the first and second score was recorded For this sample the students averaged Mp 5 7 points better on the first test with a standard deviation of SD 9 6 for the difference scores Conduct an analysis with this data using a 0 01 Put in 1 alpha for the C Level in your calculator Give the 99 confidence interval for the average difference score Round to 3 decimal places

Statistics
StatisticsTa Nehisi takes a sample of 12 different gender married couples In his sample he found that the husband was 125 69 millimeters taller on average and differences in the husband s and wife s heights had a standard deviation of 81 03 millimeters Calculate a 95 confidence interval for the mean difference between husband height and wife height Write your answers to two decimal places Confidence interval Hd

Statistics
StatisticsDiet and Blood Sugar A doctor wants to evaluate a new diet for diabetic patients He measures the blood sugar levels measured 2 3 hours after a meal of 7 patients before and one month after using the new diet Test the claim that the diet changes the average blood sugar level A B C D E Patient Before Diet F G 210 230 230 230 180 210 180 210 190 210 180 200 170 180 After Diet a Why are these paired data O All of the after diet blood sugar values are lower than the before diet blood sugar values Patient are paired up This table does not have paired data there is no clear relationship between the top and bottom values in any column Some patients are on diet and some are not on diet Most of the after diet blood sugar values are lower than the before diet blood sugar values The before and after values in each column are from the same patient b Write the hypotheses in symbols O Ho Hdiff before after 0 Ha Hdiff before after 0 O Ho Hdiff before after 0 Ha Hdiff before after O Ho Hdiff before after 0 Ha Hdiff before after 0 c Put the list of differences in your calculator and use T Test to find the p value P please round to four decimal places d What is the conclusion of the hypothesis test O Since p 0 05 we fail to reject the null hypothesis Since p 0 05 we reject the null hypothesis and support the alternative

Statistics
StatisticsPaired or not In each of the following scenarios determine if the data are paired a Compare the state test math scores of ten random students with their state test english scores O not paired O paired b Compare weights of five pre 1950 pennies with weights of five random after 2000 pennies O not paired O paired c Compare before and after weights of people undergoing surgery O not paired O paired d Comparing the state test math scores of ten random students from two middle schools O paired O not paired

Statistics
StatisticsRunning Shoes A shoe designer tests a new material for the soles of their most popular line of running shoes She has 4 athletes run 100 miles with one of last years shoes and one of these new shoes randomly assigning the new shoe to the left or right foot Afterward she measures the amount of wear on each of the shoes in millimeters Test the claim that the amount of wear with the new material is different from the amount of wear with the old material a Why are these paired data O There are an equal number of shoes of each type Runner 1 2 3 4 New Material Wear 1 05 1 1 1 09 1 03 Old Material Wear 1 05 0 99 0 93 1 05 O The top and bottom values in each column are from the same runner O Runners typically run in groups of two Each runner has a pair of shoes This table does not have paired data there is no clear relationship between the top and bottom values in any column b Write the hypotheses in symbols O Ho Hdiff new old 0 Ha Hdiff new old 0 O Ho Hdiff new old 0 Ha Hdiff new old 0 O Ho Hdiff new old 0 Ha Hdiff new old 0 c Put the list of differences in your calculator and use T Test to find the p value P please round to four decimal places

Statistics
StatisticsFor each scenario listed on the left determine whether the scenario represents an Indepenent Samples or Matched pairs situation by placing the appropriate letter in the box provided Comparing pain levels before and after treatment with magnetic therapy Comparing pain levels of a group receiving a placebo to a group receiving a medicine Comparing pre test scores before training to post test scores Comparing the number of speeding tickets received by men to the number received by women a Independent Samples b Matched Pairs

Statistics
StatisticsThe reading speed of second grade students in a large city is approximately normal with a mean of 92 words per minute wpm and a standard deviation of 10 wpm Complete parts a through f a What is the probability a randomly selected student in the city will read more than 97 words per minute The probability is 0 0071 Round to four decimal places as needed Interpret this probability Select the correct choice below and fill in the answer box within your choice OA If 100 different students were chosen from this population we would expect per minute OB If 100 different students were chosen from this population we would expect per minute OC If 100 different students were chosen from this population we would expect minute to read less than 97 words to read more than 97 words to read exactly 97 words per b What is the probability that a random sample of 12 second grade students from the city results in a mean reading rate of more than 97 words per minute The probability is Round to four decimal places as needed Interpret this probability Select the correct choice below and fill in the answer box within your choice OA If 100 independent samples of n 12 students were chosen from this population we would expect sample s to have a sample mean reading rate of less than 97 words per minute OB If 100 independent samples of n 12 students were chosen from this population we would expect sample s to have a sample mean reading rate of more than 97 words per minute OC If 100 independent samples of n 12 students were chosen from this population we would expect sample s to have a sample mean reading rate of exactly 97 words per minute c What is the probability that a random sample of 24 second grade students from the city results in a mean reading rate of more than 97 words per minute The probability is Round to four decimal places as needed Interpret this probability Select the correct choice below and fill in the answer box within your choice A If 100 independent samples of n 24 students were chosen from this population we would expect sample s to have a sample mean reading rate of less than 97 words per minute OB If 100 independent samples of n 24 students were chosen from this population we would expect sample s to have a sample mean reading rate of exactly 97 words per minute OC If 100 independent samples of n 24 students were chosen from this population we would expect sample s to have a sample mean reading rate of more than 97 words per minute d What effect does increasing the sample size have on the probability Provide an explanation for this result

Statistics
Probabilitydy dt y 6t y 0 5 In this question we will use a spreadsheet to approximate the value y 1 The picture below shows a spreadsheet being used to implement a linear approximation scheme ie Euler s method with initial value y0 y 0 5 and a step size of 0 1 to make such an approximation in 10 steps A downwards arrow indicates that the contents from the cell above will be dragged down Column B holds values of t Column A holds approximations of y t and Column C holds approximations of y t a Which entry should go in cell C1 A B1 0 1 B B1 1 C A1 5 B1 D A1 0 1 6 B1 E A1 B1 F A1 6 B1 c Which entry should go in cell B2 A 0 B 1 C B1 0 1 D A1 6 C1 E A1 6 B1 F C1 0 1 b Which entry should go in cell A2 A A1 0 1 B A1 0 1 B1 C 0 1 D B1 0 1 C1 E A1 0 1 C1 F A1 6 B1 1 2 3 4 5 67892 10 A 5 B 0 C

Statistics
StatisticsComplete parts a through d for the sampling distribution of the sample mean shown in the accompanying Click the icon to view the graph a What is the value of The value of H is b What is the value of ox The value of o is c If the sample size is n 9 what is likely true about the shape of the population OA The shape of the population is skewed left o TI Sampling Distribution E X 260 300 340 The distribution is normal The locations of the peak and inflection points are shown X pulation from which the sample was drawn drawn is

Statistics
StatisticsThe table contains price demand and total cost data for the production of extreme cold sleeping bags where p is the wholesale price in dollars of a sleeping bag for an annual demand of x sleeping bags and C is the total cost in dollars of producing x sleeping bags Complete parts A through C below 950 1 150 1 900 2 050 P 240 220 165 120 C 135 000 150 000 180 000 200 000 A Find a quadratic regression equation for the price demand data using x as the independent variable x x O Round the constant to four decimal places as needed Round all other values to six decimal places as needed
Statistics
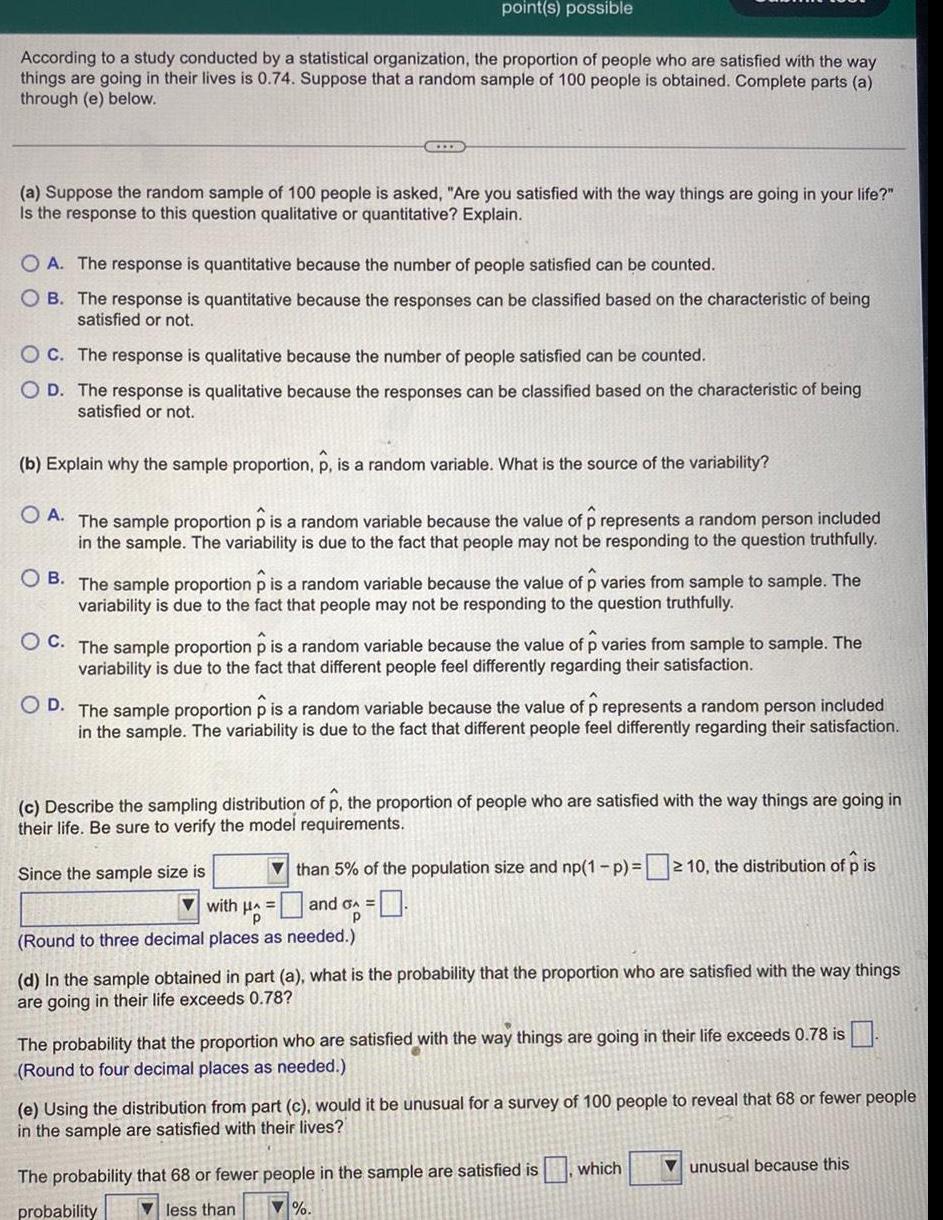
Statisticspoint s possible According to a study conducted by a statistical organization the proportion of people who are satisfied with the way things are going in their lives is 0 74 Suppose that a random sample of 100 people is obtained Complete parts a through e below EXER a Suppose the random sample of 100 people is asked Are you satisfied with the way things are going in your life Is the response to this question qualitative or quantitative Explain O A The response is quantitative because the number of people satisfied can be counted OB The response is quantitative because the responses can be classified based on the characteristic of being satisfied or not OC The response is qualitative because the number of people satisfied can be counted O D The response is qualitative because the responses can be classified based on the characteristic of being satisfied or not b Explain why the sample proportion p is a random variable What is the source of the variability O A The sample proportion p is a random variable because the value of p represents a random person included in the sample The variability is due to the fact that people may not be responding to the question truthfully OB The sample proportion p is a random variable because the value of p varies from sample to sample The variability is due to the fact that people may not be responding to the question truthfully OC The sample proportion p is a random variable because the value of p varies from sample to sample The variability is due to the fact that different people feel differently regarding their satisfaction OD The sample proportion p is a random variable because the value of p represents a random person included in the sample The variability is due to the fact that different people feel differently regarding their satisfaction c Describe the sampling distribution of p the proportion of people who are satisfied with the way things are going in their life Be sure to verify the model requirements Since the sample size is with Ho Round to three decimal places as needed than 5 of the population size and np 1 P 210 the distribution of p is and A P d In the sample obtained in part a what is the probability that the proportion who are satisfied with the way things are going in their life exceeds 0 78 The probability that the proportion who are satisfied with the way things are going in their life exceeds 0 78 is Round to four decimal places as needed e Using the distribution from part c would it be unusual for a survey of 100 people to reveal that 68 or fewer people in the sample are satisfied with their lives The probability that 68 or fewer people in the sample are satisfied is which probability less than unusual because this

Statistics
StatisticsThe reading speed of second grade students in a large city is approximately normal with a mean of 92 words per minute wpm and a standard deviation of 10 wpm Complete parts a through f GILB c What is the probability that a random sample of 24 second grade students from the city results in a mean reading rate of more than 97 words per minute The probability is Round to four decimal places as needed Interpret this probability Select the correct choice below and fill in the answer box within your choice OA If 100 independent samples of n 24 students were chosen from this population we would expect sample s to have a sample mean reading rate of less than 97 words per minute OB If 100 independent samples of n 24 students were chosen from this population we would expect sample s to have a sample mean reading rate of exactly words per minute OC If 100 independent samples of n 24 students were chosen from this population we would expect sample s to have hean reading rate of more than 97 words per minute d What effect does increasing the sample size have on the probability Provide an explanation for this result O A Increasing the sample size increases the probability because o OB Increasing the sample size decreases the probability because o OC Increasing the sample size increases the probability because o OD Increasing the sample size decreases the probability because o decreases as n increases decreases as n increases increases as n increases increases as n increases e A teacher instituted a new reading program at school After 10 weeks in the program it was found that the mean reading speed of a random sample of 22 second grade students was 94 6 wpm What might you conclude based on this result Select the correct choice below and fill in the answer boxes within your choice Type integers or decimals rounded to four decimal places as needed OA A mean reading rate of 94 6 wpm is unusual since the probability of obtaining a result of 94 6 wpm or more is This means that we would expect a mean reading rate of 94 6 or higher from a population whose mean reading rate is 92 in of every 100 random samples of size n 22 students The new program is abundantly more effective than the old program OB A mean reading rate of 94 6 wpm is not unusual since the probability of obtaining a result of 94 6 wpm or more is This means that we would expect a mean reading rate of 94 6 or higher from a population whose mean reading rate is 92 in of every 100 random samples of size n 22 students The new program is not abundantly more effective than the old program f There is a 5 chance that the mean reading speed of a random sample of 21 second grade students will exceed what value There is a 5 chance that the mean reading speed of a random sample of 21 second grade students will exceed wpm Round to two decimal places as needed

Statistics
ProbabilityQuestion Draw Graph Reset O Watch Video The function f x log x 3 4 is graphed below Plot all lattice points of the inverse Use the labeled points as your guide Click on the graph to plot a point Click a point to delete it Show Examples

Statistics
ProbabilityQuestion What are the features of the function f x 3 1 graphed below Answer Attempt 1 out of 2 The function f x is and it is Submit Answer 12 11 10 9 8 7 a logarithmic an exponential n 11 10 8 9 10 11 12 function with a its domain of and the end behavior on the RIGHT side is as VIOLO asymptote of The end behavior on the LEFT side is as www examp The range of the function is

Statistics
StatisticsGraph the function f x 2 log x 4 on the axes below You must plot the asymptote and any two points with integer coordinates Asymptote 12 11 10 9 00 7 60 5 4 32 10 12 11 10 9 8 7 6 5 4 3 2 1 1 y 2 co 74959 9 4 7 8 10 1 2 3 4 5 6 7 8 9 10 11 12 X

Statistics
StatisticsQuestion Watch Video Express the given expression without logs in simplest form Assume all variables represent positive values glog 3x

Statistics
StatisticsQuestion Express the given expression without logs in simplest form Assume all variables represent positive values 410g 82 Answer Attempt out of Watch Video log 82 log 4w

Statistics
ProbabilityThe Venn diagram here shows the cardinality of each set Use this to find the probability of observing the given set A 13 C 11 B

Statistics
StatisticsGraph the function f x 4 5 6 on the axes below You must plot the asymptote and any two points with integer coordinates Asymptote 12 11 10 9 8 7 6 5 4 3 2 1 6 5 4 3 2 10 T 8 4 1 2 3 4 5 Vertical Horizontal C 1 2 3 4 5 6 7 8 9 10 11 12

Statistics
Probabilitymissing cumulative value identified by asterisk Bin Frequenc Cumulative y 1 5 6 6 2 12 8 41 6 70 4 99 2 More A 60 00 B 5 00 C 100 5 00 30 00 60 00 100 00 4
Statistics
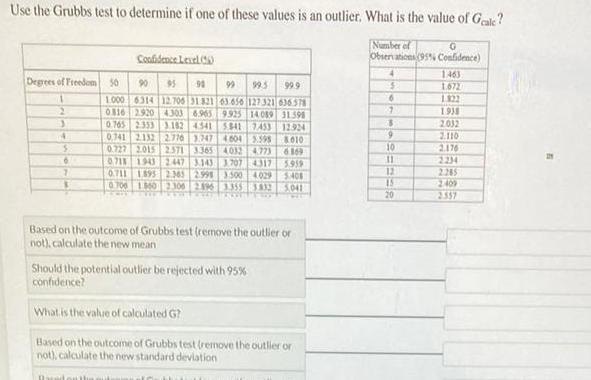
StatisticsUse the Grubbs test to determine if one of these values is an outlier What is the value of Gale Degrees of Freedom 50 1 2 3 4 5 6 7 3 Confidence Level C 90 95 90 99 99 5 99 9 1 000 6314 12 706 31 821 63 656 127 321 636578 9 925 14089 0816 2920 4303 6 965 31398 0 765 2353 3 182 4541 5541 7 453 12924 4604 5595 010 6869 0 741 2132 2776 3 747 0727 2015 2 571 3 365 4032 4773 0711 1943 2447 3 143 3 707 4317 0 711 1895 2 365 2998 3 500 4029 0700 1860 2300 2196 3 355 3 832 5041 5959 5 408 Bucion a Based on the outcome of Grubbs test remove the outlier or not calculate the new mean Should the potential outlier be rejected with 95 confidence What is the value of calculated G Based on the outcome of Grubbs test remove the outlier or not calculate the new standard deviation Number of G Observations 95 Confidence 4 6 9 10 11 12 15 20 1463 1 672 1 822 1938 2032 2 110 2 176 2234 2 265 2409 2557

Statistics
StatisticsDistinguishing accuracy and precision Four research teams measured the half life of a radioactive isotope and what each team wrote in its team notebook is shown in the table below Suppose a later and more reliable measurement gives 0 780 s for the half life of the same isotope Decide which of the earlier measurements was the mo accurate and which was the most precise team A B C D what was written in the notebook 0 800s 0 005s 0 79s between 0 776s and 0 780s 0 760 0 10 most accurate measurement 3 5 most precise measurement

Statistics
StatisticsConsider the set of replicate measurements 51 5 g 52 0 g 50 7 g 52 6 g 51 1 g 51 7 g For this data set calculate the mean range standard deviation and percent relative standard deviation Variance Range Standard deviation Mean Percent relative standard deviation 1 5 16 1 0 1 0 7 0 49 7 0 1 9

Statistics
StatisticsIt has been reported in a national newspaper that 78 of American households own a washing machine A random sample of 143 San Diego households revealed that 100 owned a washing machine At a 0 05 significance test the claim that San Diego households have a different percentage compared to the nation a What are the null and alternative hypotheses Ho p 0 78 OH p 0 78 O Ho p 0 78 H p 0 78 Ho p 0 78 O H P 0 78 Ho p 0 78 H P 0 78 b What is the test statistic Round to 2 decimal places I c What is the p value Round to 4 decimal places

Statistics
Statisticsbly gloves to stress Affung 265 vinyl gloves 65 leaked viruses Among 283 latex gloves 8 leaked viruses Using the accompanying display of the technology results and using a 0 01 significance level test the claim that vinyl gloves have a greater virus leak rate than latex gloves Let vinyl gloves be population 1 What are the null and alternat OA Ho P P2 H P P2 D Ho P P2 H P1 P2 Identify the test statistic 14 15 Round to two decimal places Identify the P value 7 Technology Results Pooled proportion 0 36 Test statistic z 14 1527 Critical z 2 3264 P value 0 0000 98 Confidence interval 0 4968036 P P2 0 6480727 Print Done

Statistics
ProbabilityExponential Functions 1 A baker records the internal temperature of a pie that has been left to cool on a counter The room temperature is 14 C An equation that models this situation is T t 68 0 5 1 14 where T is the temperature in degrees Celsius and is the time in minutes a Sketch the graph of the function 9 14 H A y 14 y in 82 b Determine the i Domain TEIR ii Range yeir y 14 c Determine the temperature to the nearest degree of the pie after 15 minutes 15 r 68 0 5 110 k T 38004 682 14 d How much time did it take for the pie to reach an internal temperature of 31 C

Statistics
Statistics1 point Given the least squares regression line y 2 48 1 63x and a coefficient of determination of 0 81 the coefficient of correlation is A 0 90 B 0 85 C 0 85 O D 0 90 A regression analysis between sales in thousands of dollars and advertising in hundreds of dollars resulted in the following least squares line y 75 6x This implies that if advertising is 800 dollars then the predicted amount of sales in dollars is A 4 875 dollars B 487 500 dollars C 12 300 dollars O D 123 000 dollars Note In order to get credit for this problem all answers must be correct Preview My Answers Submit Answers