Statistics Questions
The best high school and college tutors are just a click away, 24×7! Pick a subject, ask a question, and get a detailed, handwritten solution personalized for you in minutes. We cover Math, Physics, Chemistry & Biology.
Statistics
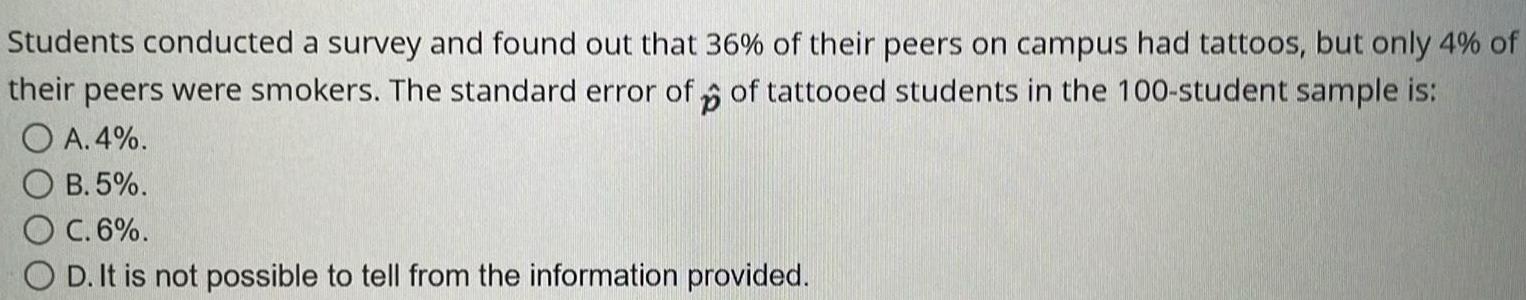
StatisticsStudents conducted a survey and found out that 36 of their peers on campus had tattoos but only 4 of their peers were smokers The standard error of of tattooed students in the 100 student sample is p O A 4 OB 5 O C 6 OD It is not possible to tell from the information provided
Statistics
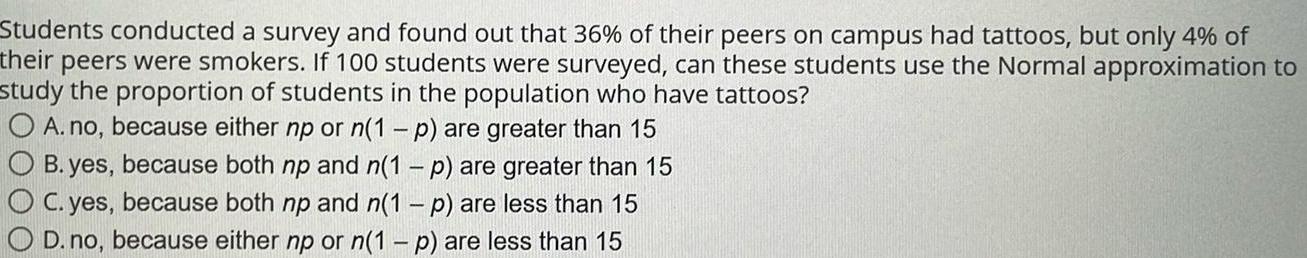
StatisticsStudents conducted a survey and found out that 36 of their peers on campus had tattoos but only 4 of their peers were smokers If 100 students were surveyed can these students use the Normal approximation to study the proportion of students in the population who have tattoos O A no because either np or n 1 p are greater than 15 O B yes because both np and n 1 p are greater than 15 O C yes because both np and n 1 p are less than 15 O D no because either np or n 1 p are less than 15
Statistics
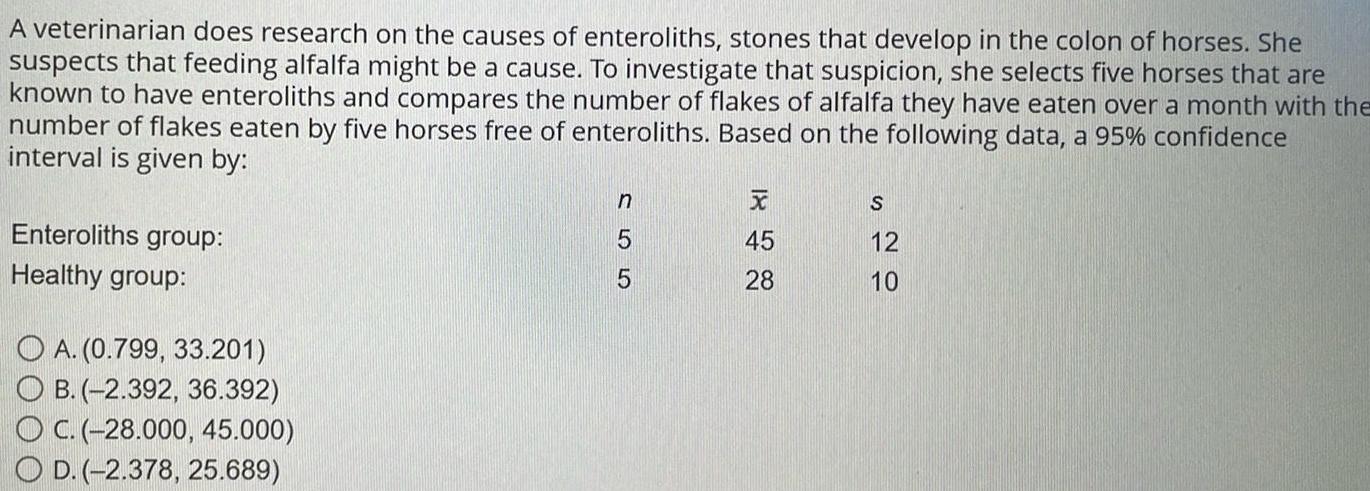
StatisticsA veterinarian does research on the causes of enteroliths stones that develop in the colon of horses She suspects that feeding alfalfa might be a cause To investigate that suspicion she selects five horses that are known to have enteroliths and compares the number of flakes of alfalfa they have eaten over a month with the number of flakes eaten by five horses free of enteroliths Based on the following data a 95 confidence interval is given by Enteroliths group Healthy group OA 0 799 33 201 OB 2 392 36 392 OC 28 000 45 000 OD 2 378 25 689 n 5 5 x 45 28 S 12 10
Statistics
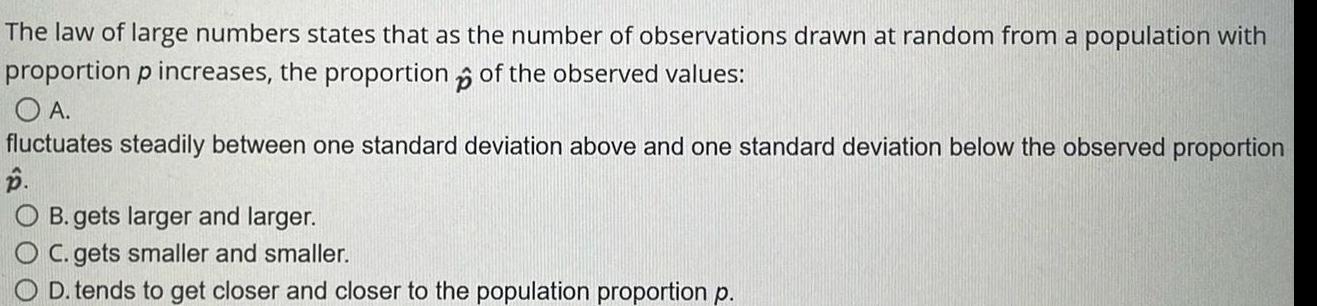
StatisticsThe law of large numbers states that as the number of observations drawn at random from a population with proportion p increases the proportion of the observed values p O A fluctuates steadily between one standard deviation above and one standard deviation below the observed proportion B O B gets larger and larger OC gets smaller and smaller O D tends to get closer and closer to the population proportion p
Statistics
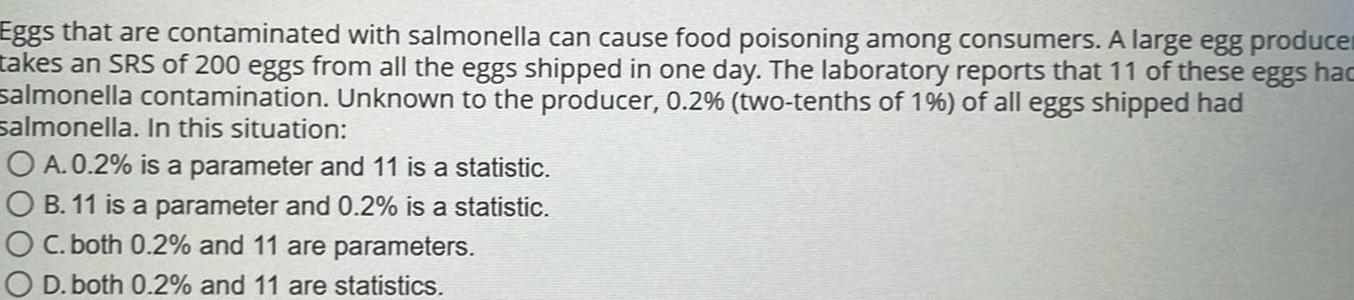
StatisticsEggs that are contaminated with salmonella can cause food poisoning among consumers A large egg produce takes an SRS of 200 eggs from all the eggs shipped in one day The laboratory reports that 11 of these eggs hac salmonella contamination Unknown to the producer 0 2 two tenths of 1 of all eggs shipped had salmonella In this situation O A 0 2 is a parameter and 11 is a statistic OB 11 is a parameter and 0 2 is a statistic OC both 0 2 and 11 are parameters O D both 0 2 and 11 are statistics
Statistics
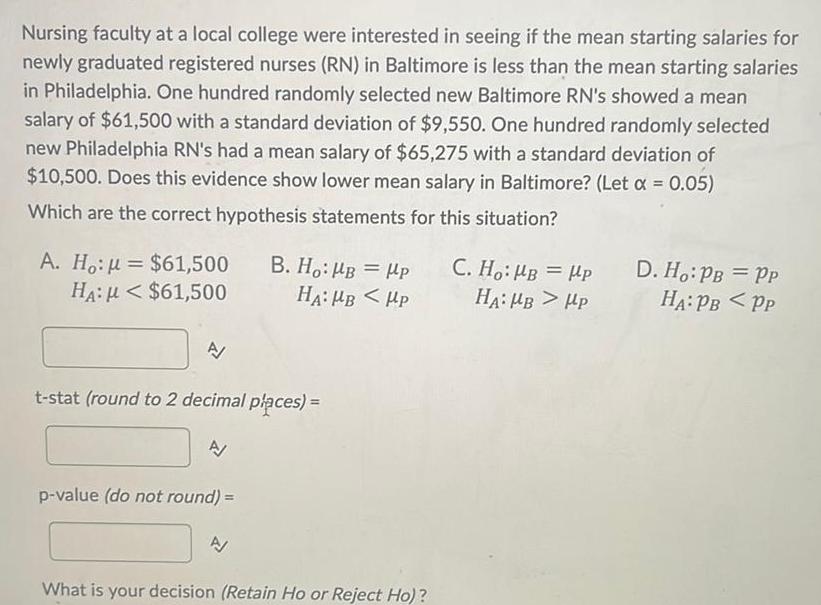
StatisticsNursing faculty at a local college were interested in seeing if the mean starting salaries for newly graduated registered nurses RN in Baltimore is less than the mean starting salaries in Philadelphia One hundred randomly selected new Baltimore RN s showed a mean salary of 61 500 with a standard deviation of 9 550 One hundred randomly selected new Philadelphia RN s had a mean salary of 65 275 with a standard deviation of 10 500 Does this evidence show lower mean salary in Baltimore Let 0 05 Which are the correct hypothesis statements for this situation A Ho k 61 500 B Ho B P HA 61 500 HA MB Hp A t stat round to 2 decimal places p value do not round A What is your decision Retain Ho or Reject Ho C Ho HB HP HA MB HP D Ho PB PP HA PB PP
Statistics
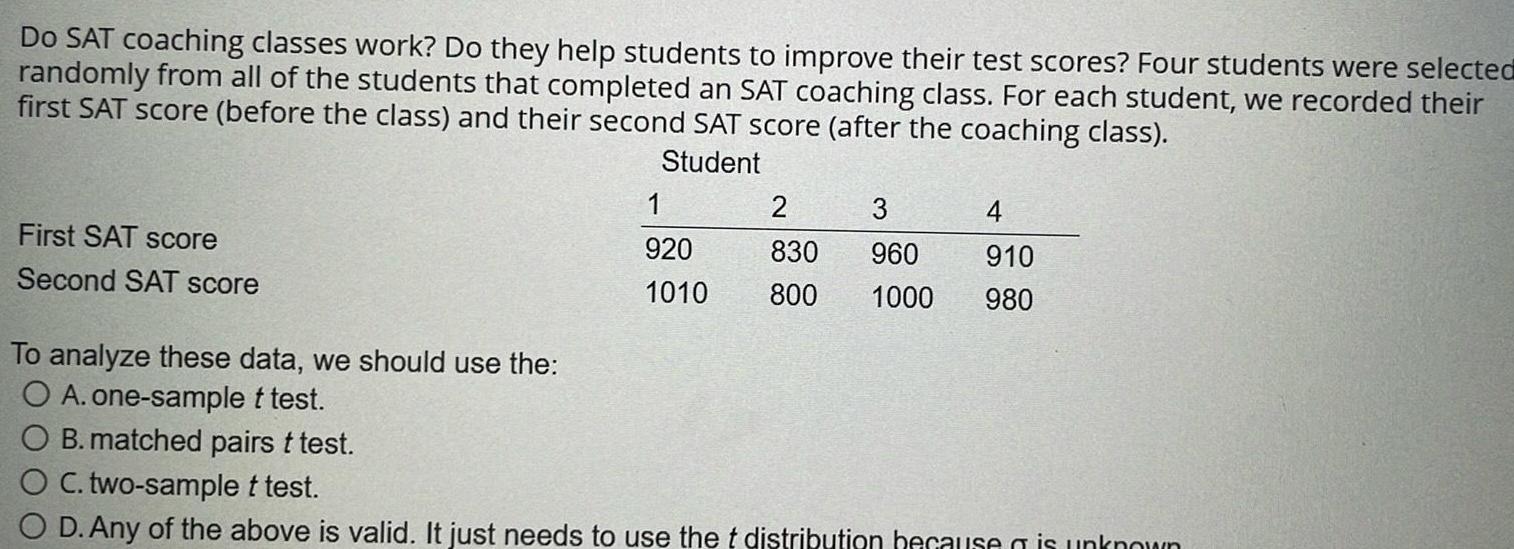
ProbabilityDo SAT coaching classes work Do they help students to improve their test scores Four students were selected randomly from all of the students that completed an SAT coaching class For each student we recorded their first SAT score before the class and their second SAT score after the coaching class Student First SAT score Second SAT score 1 920 1010 2 3 4 830 960 910 800 1000 980 To analyze these data we should use the O A one sample t test O B matched pairs t test O C two sample t test O D Any of the above is valid It just needs to use the t distribution because is unknown
Statistics
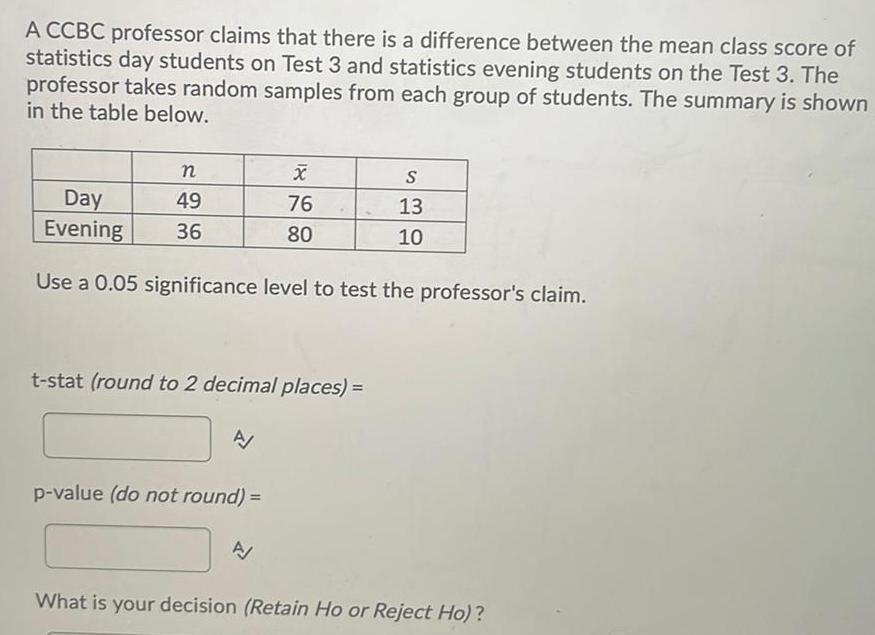
ProbabilityA CCBC professor claims that there is a difference between the mean class score of statistics day students on Test 3 and statistics evening students on the Test 3 The professor takes random samples from each group of students The summary is shown in the table below n 49 36 Day Evening Use a 0 05 significance level to test the professor s claim t stat round to 2 decimal places A X 76 80 p value do not round A S 13 10 What is your decision Retain Ho or Reject Ho
Statistics
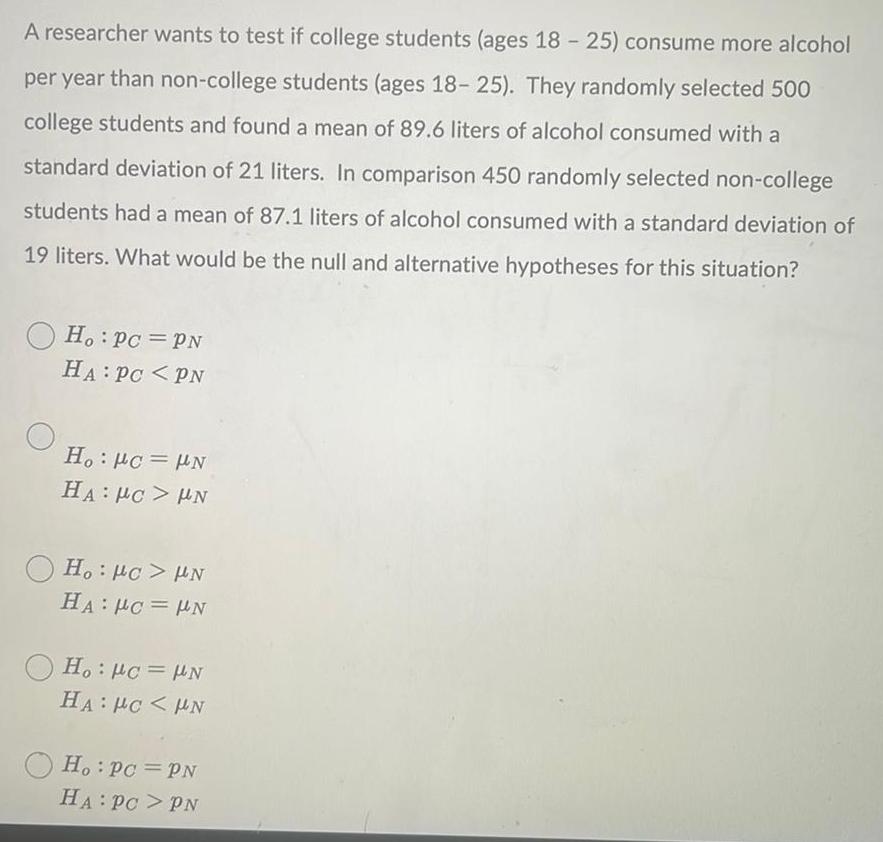
StatisticsA researcher wants to test if college students ages 18 25 consume more alcohol per year than non college students ages 18 25 They randomly selected 500 college students and found a mean of 89 6 liters of alcohol consumed with a standard deviation of 21 liters In comparison 450 randomly selected non college students had a mean of 87 1 liters of alcohol consumed with a standard deviation of 19 liters What would be the null and alternative hypotheses for this situation Ho Pc PN HA PC PN Ho Pc N HA PC UN Ho PC UN HA PC N Ho Pc N HA PCHN Ho Pc PN HA PC PN
Statistics
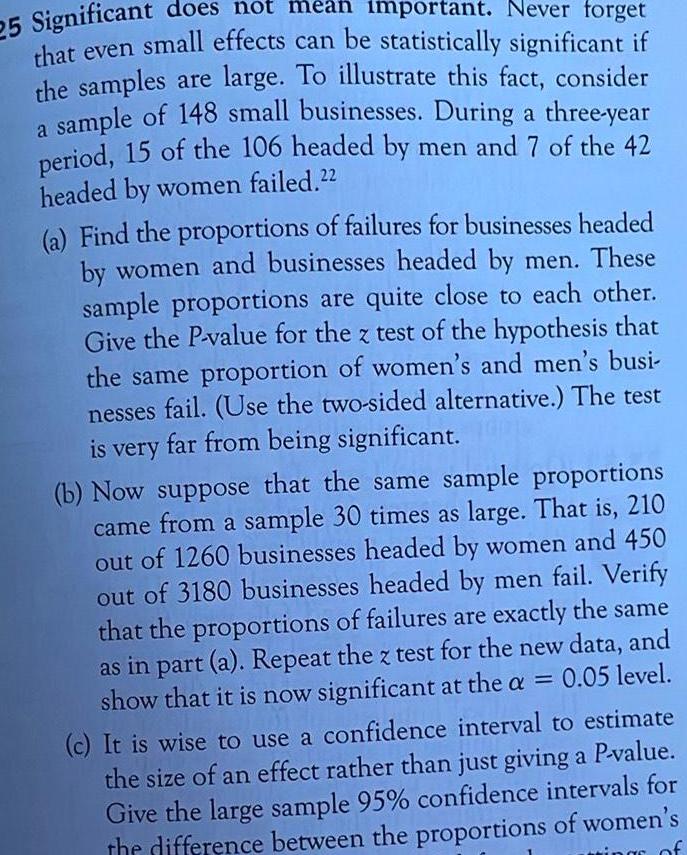
Statistics25 Significant does not mean important Never forget that even small effects can be statistically significant if the samples are large To illustrate this fact consider a sample of 148 small businesses During a three year period 15 of the 106 headed by men and 7 of the 42 headed by women failed 22 a Find the proportions of failures for businesses headed by women and businesses headed by men These sample proportions are quite close to each other Give the P value for the z test of the hypothesis that the same proportion of women s and men s busi nesses fail Use the two sided alternative The test is very far from being significant b Now suppose that the same sample proportions came from a sample 30 times as large That is 210 out of 1260 businesses headed by women and 450 out of 3180 businesses headed by men fail Verify that the proportions of failures are exactly the same as in part a Repeat the z test for the new data and show that it is now significant at the a 0 05 level c It is wise to use a confidence interval to estimate the size of an effect rather than just giving a P value Give the large sample 95 confidence intervals for the difference between the proportions of women s of
Statistics
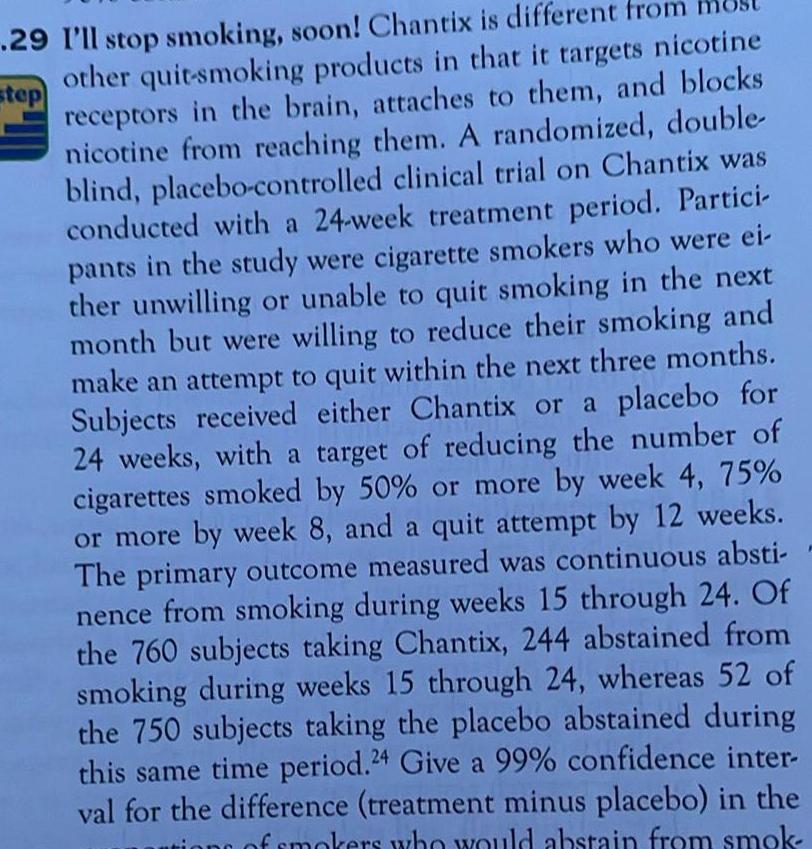
Probabilitystep 29 I ll stop smoking soon Chantix is different from other quit smoking products in that it targets nicotine receptors in the brain attaches to them and blocks nicotine from reaching them A randomized double blind placebo controlled clinical trial on Chantix was conducted with a 24 week treatment period Partici pants in the study were cigarette smokers who were ei ther unwilling or unable to quit smoking in the next month but were willing to reduce their smoking and make an attempt to quit within the next three months Subjects received either Chantix or a placebo for 24 weeks with a target of reducing the number of cigarettes smoked by 50 or more by week 4 75 or more by week 8 and a quit attempt by 12 weeks The primary outcome measured was continuous absti nence from smoking during weeks 15 through 24 Of the 760 subjects taking Chantix 244 abstained from smoking during weeks 15 through 24 whereas 52 of the 750 subjects taking the placebo abstained during this same time period 24 Give a 99 confidence inter val for the difference treatment minus placebo in the of smokers who would abstain from smok
Statistics
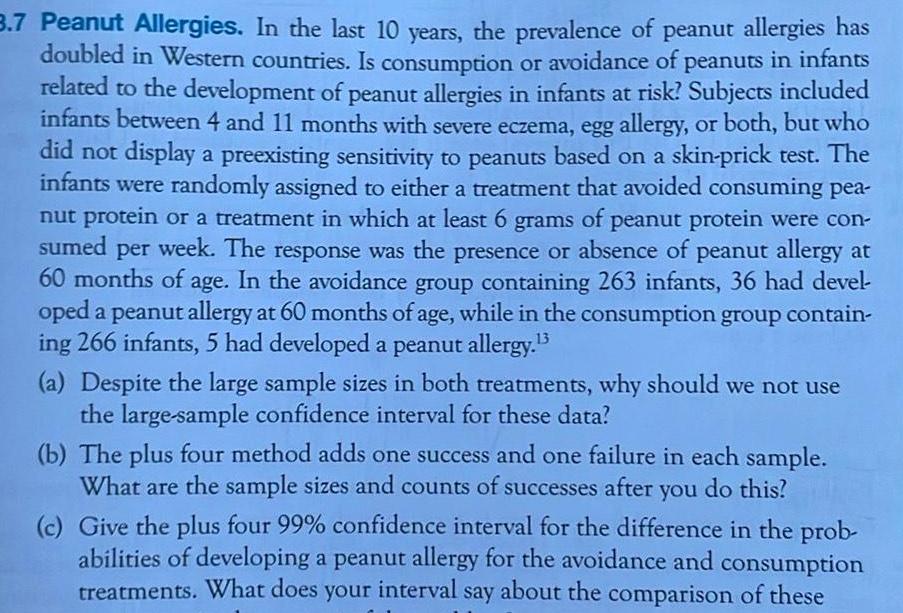
Statistics3 7 Peanut Allergies In the last 10 years the prevalence of peanut allergies has doubled in Western countries Is consumption or avoidance of peanuts in infants related to the development of peanut allergies in infants at risk Subjects included infants between 4 and 11 months with severe eczema egg allergy or both but who did not display a preexisting sensitivity to peanuts based on a skin prick test The infants were randomly assigned to either a treatment that avoided consuming pea nut protein or a treatment in which at least 6 grams of peanut protein were con sumed per week The response was the presence or absence of peanut allergy at 60 months of age In the avoidance group containing 263 infants 36 had devel oped a peanut allergy at 60 months of age while in the consumption group contain ing 266 infants 5 had developed a peanut allergy 3 a Despite the large sample sizes in both treatments why should we not use the large sample confidence interval for these data b The plus four method adds one success and one failure in each sample What are the sample sizes and counts of successes after you do this c Give the plus four 99 confidence interval for the difference in the prob abilities of developing a peanut allergy for the avoidance and consumption treatments What does your interval say about the comparison of these
Statistics
Probability17 Truthfulness in online profiles Many teens have posted profiles on a social networking website A sample survey in 2007 asked a random sample of teens with online profiles if they included false information in their pro files Of 170 younger teens aged 12 to 14 117 said yes Of 317 older teens aged 15 to 17 152 said yes 6 a Do these samples satisfy the guidelines for the large sample confidence interval b Give a 95 confidence interval for the difference between the proportions of younger and older teens in in gludo folce information in their online profiles
Statistics
Statistics23 How big a difference Give a 95 confidence interval for the difference between the proportions of students passing the HSA who have received or not received for mal musical instruction in middle school
Statistics
StatisticsDetermine the COP of a refrigerator that removes heat from the food compartment at a rate of 5180 kJ h for each kW of power it consumes Also determine the rate of heat rejection to the outside air The COP of the refrigerator is The rate of heat rejection to the outside air is kJ h
Statistics
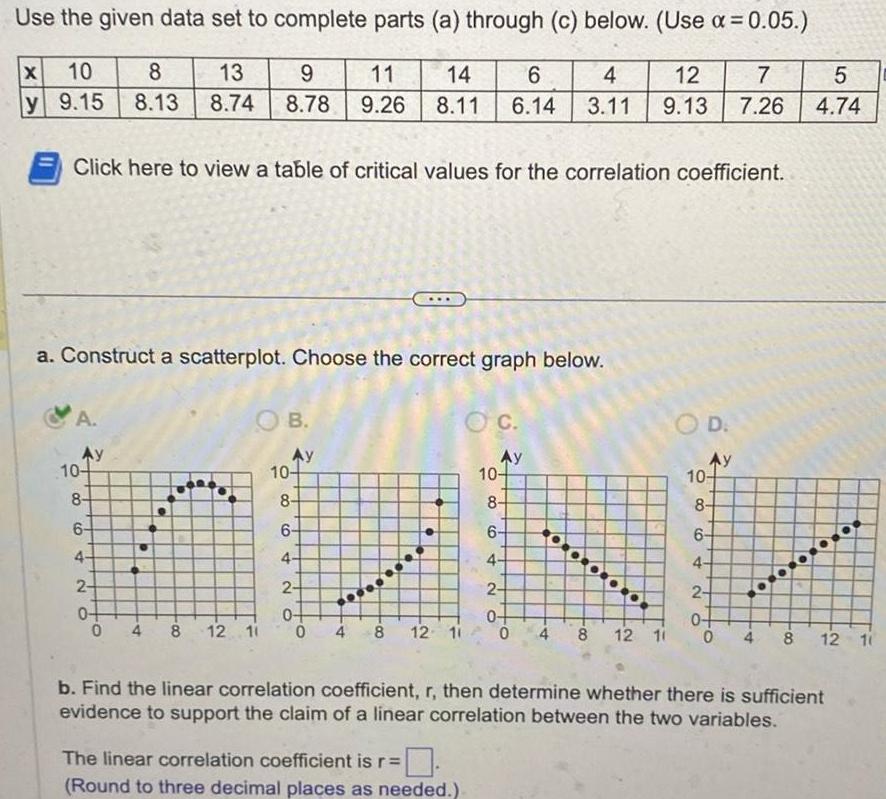
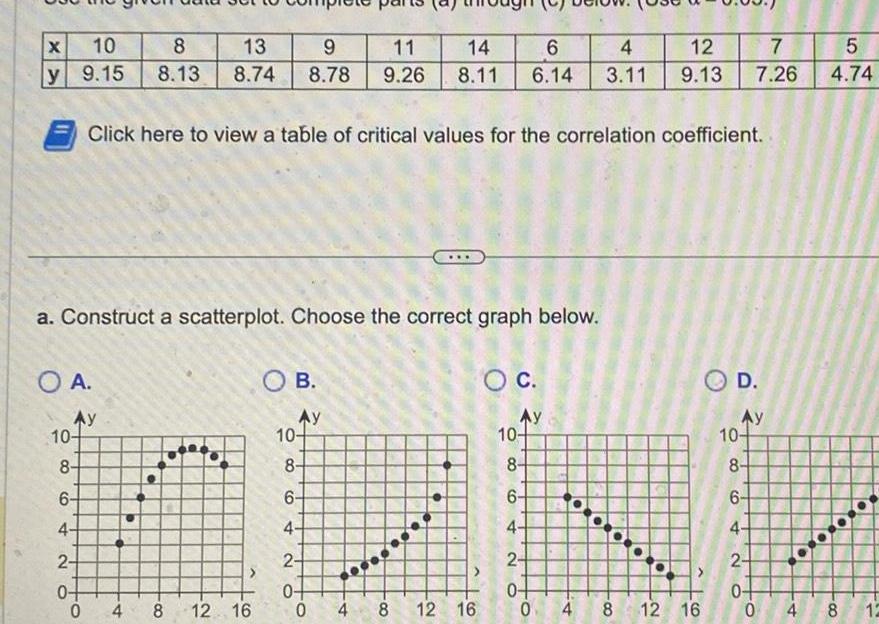
StatisticsUse the given data set to complete parts a through c below Use 0 05 X 10 y 9 15 Click here to view a table of critical values for the correlation coefficient A a Construct a scatterplot Choose the correct graph below Ay 10 84 6 4 13 9 11 8 8 13 8 74 8 78 9 26 2 0 0 OB Ay 4 8 12 11 10 8 6 4 2 0 0 4 14 6 4 12 7 8 11 6 14 3 11 9 13 7 26 8 12 11 C The linear correlation coefficient is r Round to three decimal places as needed Ay 10 8 6 4 2 0 600 0 4 8 n 12 10 O D Ay 10 8 6 4 2 O O 5 4 74 b Find the linear correlation coefficient r then determine whether there is sufficient evidence to support the claim of a linear correlation between the two variables 0 4 8 12 10
Statistics
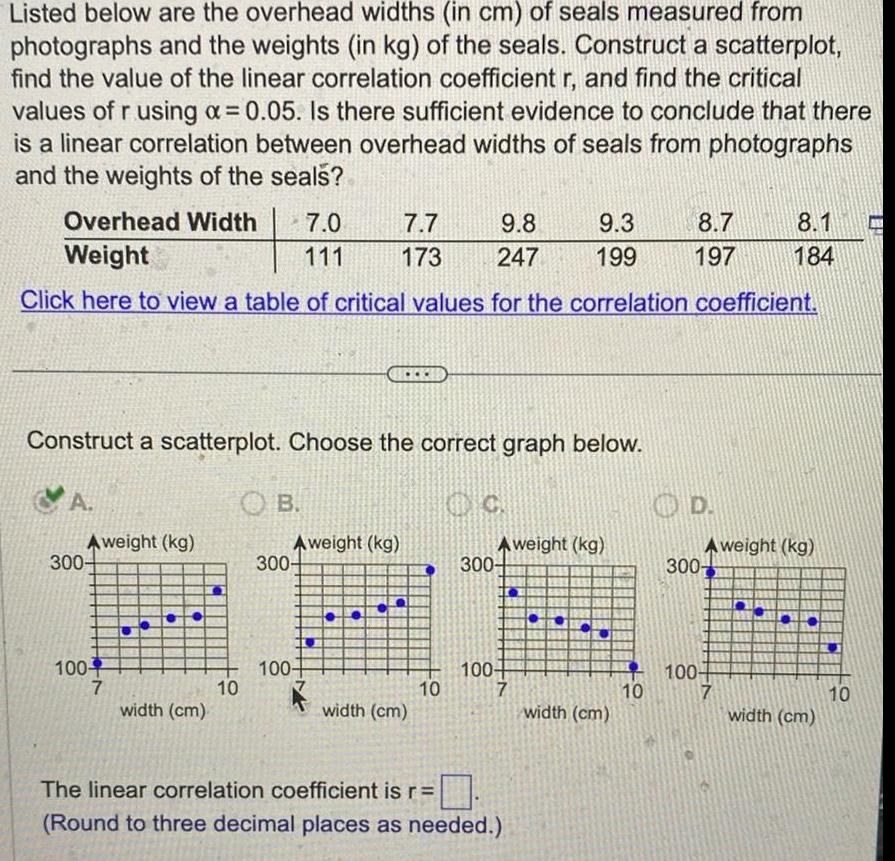
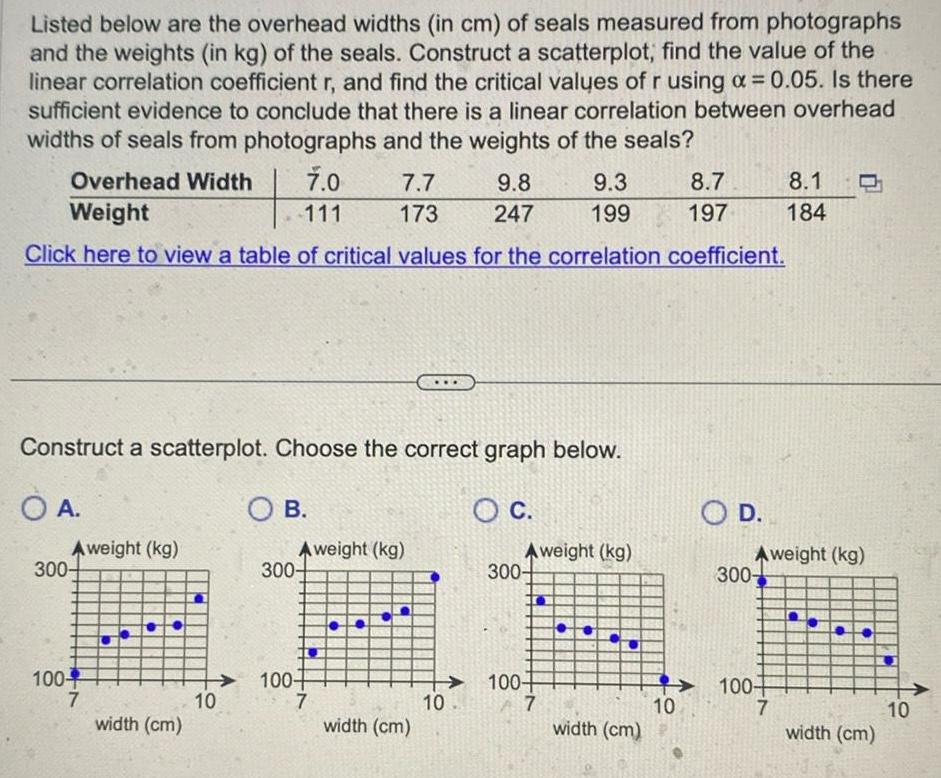
StatisticsListed below are the overhead widths in cm of seals measured from photographs and the weights in kg of the seals Construct a scatterplot find the value of the linear correlation coefficient r and find the critical values of r using a 0 05 Is there sufficient evidence to conclude that there is a linear correlation between overhead widths of seals from photographs and the weights of the seals Overhead Width 7 0 Weight 111 Click here to view a table of critical values for the correlation coefficient Construct a scatterplot Choose the correct graph below A Aweight kg 300 100 7 width cm 10 OB Aweight kg 300 7 7 9 8 9 3 173 247 199 100 width cm 10 Aweight kg 300 100 7 The linear correlation coefficient is r Round to three decimal places as needed width cm 10 8 7 197 300 100 Aweight kg 8 1 184 7 width cm 10
Statistics
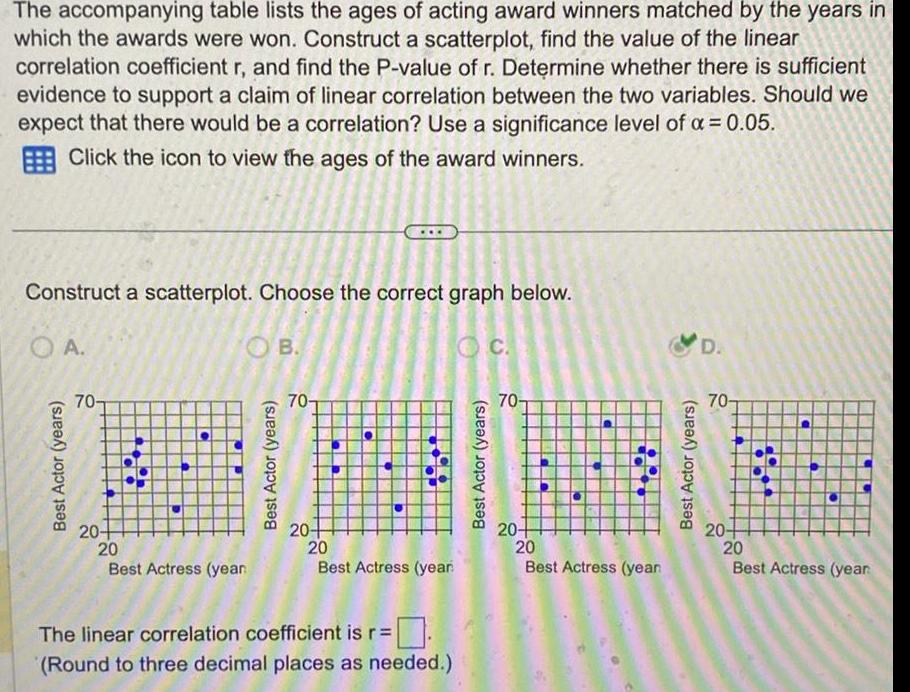
StatisticsThe accompanying table lists the ages of acting award winners matched by the years in which the awards were won Construct a scatterplot find the value of the linear correlation coefficient r and find the P value of r Determine whether there is sufficient evidence to support a claim of linear correlation between the two variables Should we expect that there would be a correlation Use a significance level of 0 05 Click the icon to view the ages of the award winners Construct a scatterplot Choose the correct graph below O A Best Actor years 70 20 OB 20 Best Actress year Best Actor years 70 20 20 C CO Best Actress year The linear correlation coefficient is r Round to three decimal places as needed Best Actor years C 70 20 20 Best Actress year Best Actor years D 70 20 P h 20 Best Actress year
Statistics
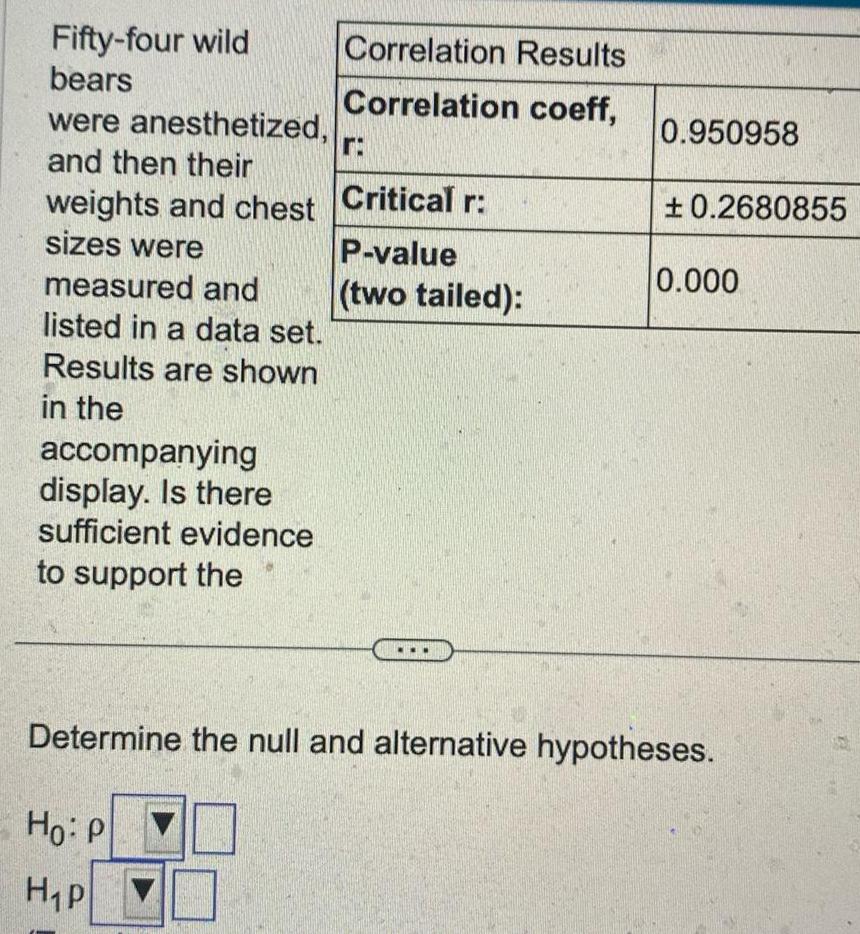
StatisticsFifty four wild bears were anesthetized and then their weights and chest sizes were measured and listed in a data set Results are shown in the accompanying display Is there sufficient evidence to support the Correlation Results Correlation coeff r Critical r P value two tailed 0 950958 0 2680855 0 000 Determine the null and alternative hypotheses Ho P H P
Statistics
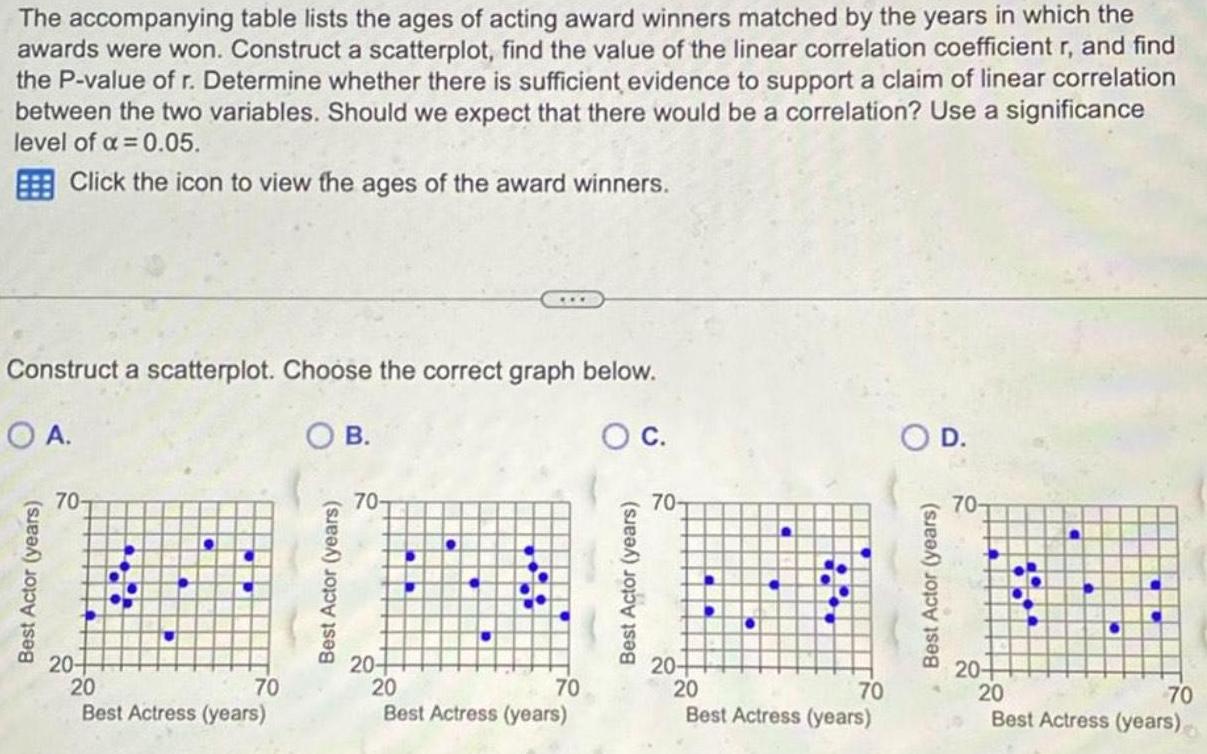
StatisticsThe accompanying table lists the ages of acting award winners matched by the years in which the awards were won Construct a scatterplot find the value of the linear correlation coefficient r and find the P value of r Determine whether there is sufficient evidence to support a claim of linear correlation between the two variables Should we expect that there would be a correlation Use a significance level of 0 05 Click the icon to view the ages of the award winners Construct a scatterplot Choose the correct graph below OA OB O C 70 20 20 70 Best Actress years 70 20 20 70 Best Actress years 70 20 20 70 Best Actress years O D 70 20 8 20 70 Best Actress years
Statistics
StatisticsListed below are the overhead widths in cm of seals measured from photographs and the weights in kg of the seals Construct a scatterplot find the value of the linear correlation coefficient r and find the critical values of r using 0 05 Is there sufficient evidence to conclude that there is a linear correlation between overhead widths of seals from photographs and the weights of the seals 7 0 111 Overhead Width Weight Click here to view a table of critical values for the correlation coefficient Aweight kg 300 Construct a scatterplot Choose the correct graph below O A O C 100 7 width cm 10 OB Aweight kg 300 7 7 173 100 7 width cm 9 8 247 10 9 3 199 Aweight kg 300 100 7 width cm 8 7 197 10 O D Aweight kg 300 100 8 1 184 7 width cm 10
Statistics
StatisticsWhich of the following is NOT a property of the linear correlation coefficient r Choose the correct answer below O A The value of r is not affected by the choice of x or y OB The value of r measures the strength of a linear relationship OC The value of r is always between 1 and 1 inclusive OD The linear correlation coefficient r is robust That is a single outlier will not affect the value of r
Statistics
StatisticsWhen determining whether there is a correlation between two variables one should use a to explore the data visually When determining whether there is a correlation between two variables one should use a to explore the data visually protractor scatterplot correlation coefficient probability distribution
Statistics
StatisticsWhich of the following is NOT true for a hypothesis test for correlation Choose the correct answer below OA If the P value is greater than the significance level we should fail to reject the null hypothesis and conclude that there is not sufficient evidence to support the claim of a linear correlation OB If Ir critical value we should fail to reject the null hypothesis and conclude that there is not sufficient evidence to support the claim of a linear correlation OC If Ir critical value we should fail to reject the null hypothesis and conclude that there is not sufficient evidence to support the claim of a linear correlation O D If the P value is less than or equal to the significance level we should reject the null hypothesis and conclude that there is sufficient evidence to support the claim of a linear correlation
Statistics
StatisticsFill in the blank The measures the strength of the linear correlation between the paired quantitative x and y values in a sample The measures the strength of the linear correlation between the paired quantitative x and y values in a sample
Statistics
StatisticsWhich of the following is NOT one of the three common errors involving correlation Choose the correct answer below O A Correlation does not imply causality B Mistaking no linear correlation with no correlation OC The conclusion that correlation implies causality D The use of data based on averages
Statistics
StatisticsFill in the blank A exists between two variables when the values of one variable are somehow associated with the values of the other variable A exists between two variables when the values of one
Statistics
ProbabilityWhich of the following is NOT a requirement in determining whether there is a linear correlation between two variables Choose the correct answer below OA Any outliers must be removed if they are known to be errors OB The sample of paired data is a simple random sample of quantitative data OC A scatterplot should visually show a straight line pattern D If r 1 then there is a positive linear correlation
Statistics
ProbabilityX 10 8 13 9 y 9 15 8 13 8 74 8 78 a Construct a scatterplot Choose the correct graph below O A Click here to view a table of critical values for the correlation coefficient Ay 10 8 6 4 2 0 0 4 8 12 16 OB Ay 10 8 11 14 6 4 12 7 9 26 8 11 6 14 3 11 9 13 7 26 6 4 2 0 0 4 8 12 16 O C Ay 10 8 6 4 OD 2 0 0 4 8 12 16 Ay 5 4 74 10 8 6 4 2 0 0 4 8 12 0 000
Statistics
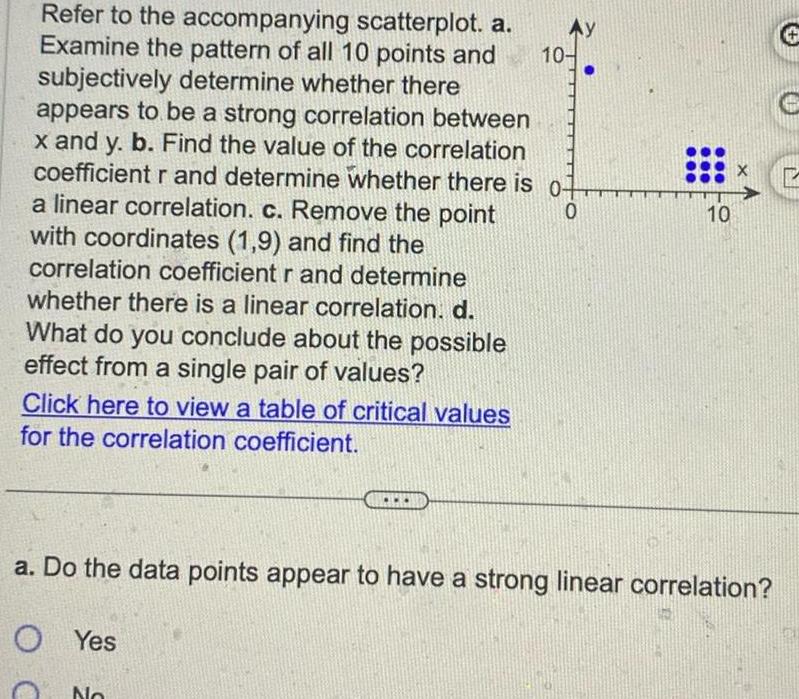
StatisticsRefer to the accompanying scatterplot a Examine the pattern of all 10 points and subjectively determine whether there appears to be a strong correlation between x and y b Find the value of the correlation coefficient r and determine whether there is o a linear correlation c Remove the point with coordinates 1 9 and find the correlation coefficient r and determine whether there is a linear correlation d What do you conclude about the possible effect from a single pair of values 0 Click here to view a table of critical values for the correlation coefficient O Ay No 10 10 a Do the data points appear to have a strong linear correlation OYes X P
Statistics
ProbabilityIf we find that there is a linear correlation between the concentration of carbon dioxide in our atmosphere and the global temperature does that indicate that changes in the concentration of carbon dioxide cause changes in the global temperature Choose the correct answer below O A Yes The presence of a linear correlation between two variables implies that one of the variables is the cause of the other variable OB No The presence of a linear correlation between two variables does not imply that one of the variables is the cause of the other variable
Statistics
ProbabilityTwenty different statistics students are randomly selected For each of them their body temperature C is measured and their head circumference cm is measured If it is found that r 0 does that indicate that there is no association betwen these two variables Choose the correct answer below O A No because r does not measure the strength of the relationship only its direction OB Yes because if r 0 the variables are completely unrelated OC No because if r 0 the variables are in a perfect linear relationship OD No because while there is no linear correlation there may be a relationship that is not linear
Statistics
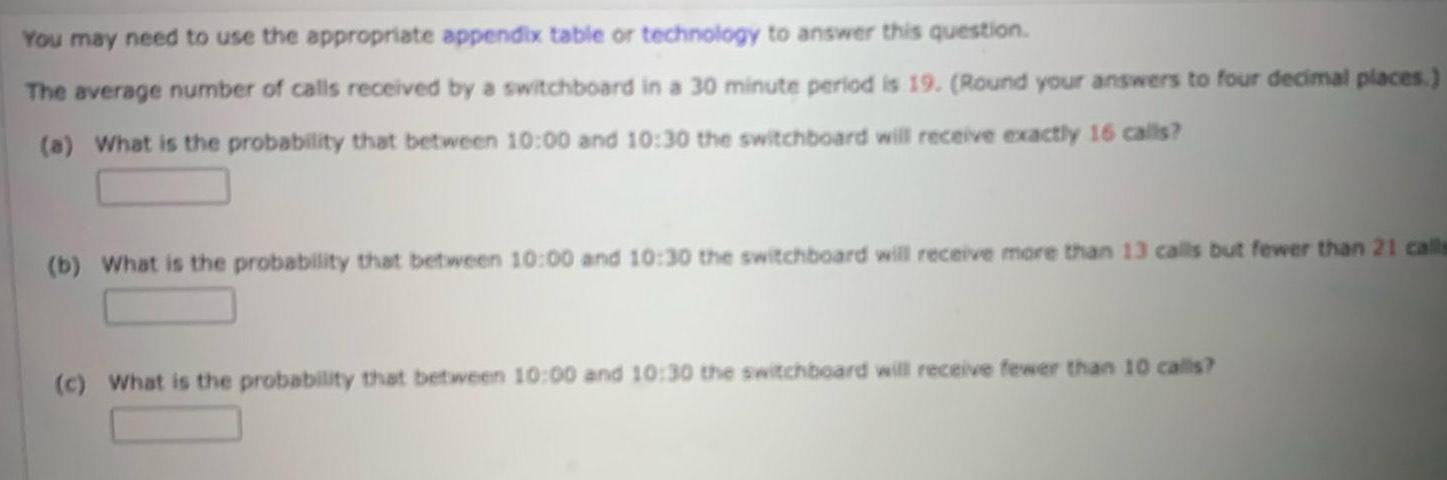
ProbabilityYou may need to use the appropriate appendix table or technology to answer this question The average number of calls received by a switchboard in a 30 minute period is 19 Round your answers to four decimal places a What is the probability that between 10 00 and 10 30 the switchboard will receive exactly 16 calls b What is the probability that between 10 00 and 10 30 the switchboard will receive more than 13 calls but fewer than 21 calls c What is the probability that between 10 00 and 10 30 the switchboard will receive fewer than 10 calls
Statistics
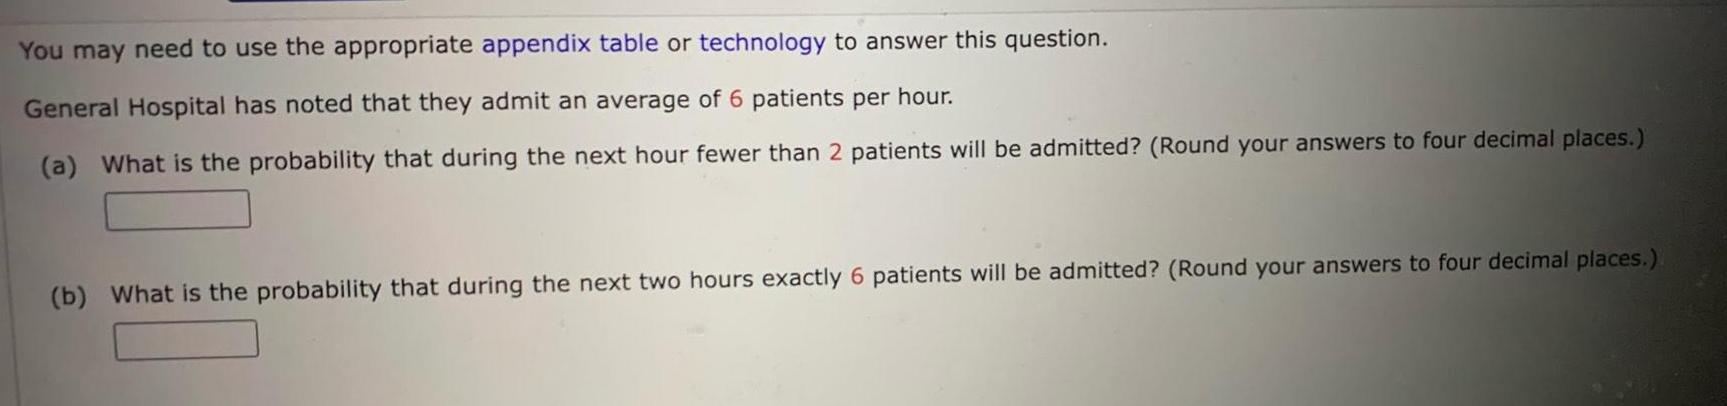
ProbabilityYou may need to use the appropriate appendix table or technology to answer this question General Hospital has noted that they admit an average of 6 patients per hour a What is the probability that during the next hour fewer than 2 patients will be admitted Round your answers to four decimal places b What is the probability that during the next two hours exactly 6 patients will be admitted Round your answers to four decimal places
Statistics
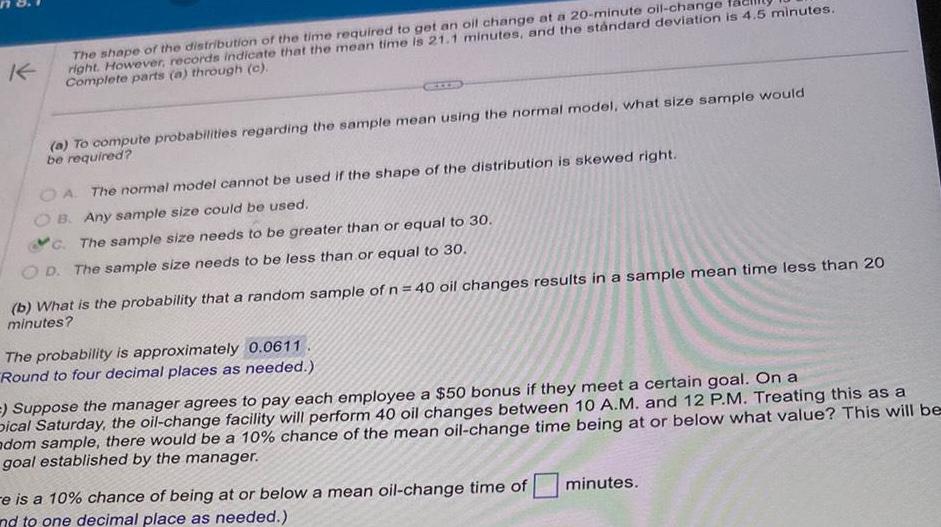
ProbabilityK The shape of the distribution of the time required to get an oil change at a 20 minute oil change right However records indicate that the mean time is 21 1 minutes and the standard deviation is 4 5 minutes Complete parts a through c a To compute probabilities regarding the sample mean using the normal model what size sample would be required OA The normal model cannot be used if the shape of the distribution is skewed right B Any sample size could be used C The sample size needs to be greater than or equal to 30 OD The sample size needs to be less than or equal to 30 b What is the probability that a random sample of n 40 oil changes results in a sample mean time less than 20 minutes The probability is approximately 0 0611 Round to four decimal places as needed Suppose the manager agrees to pay each employee a 50 bonus if they meet a certain goal On a Dical Saturday the oil change facility will perform 40 oil changes between 10 A M and 12 P M Treating this as a adom sample there would be a 10 chance of the mean oil change time being at or below what value This will be goal established by the manager e is a 10 chance of being at or below a mean oil change time of nd to one decimal place as needed minutes
Statistics
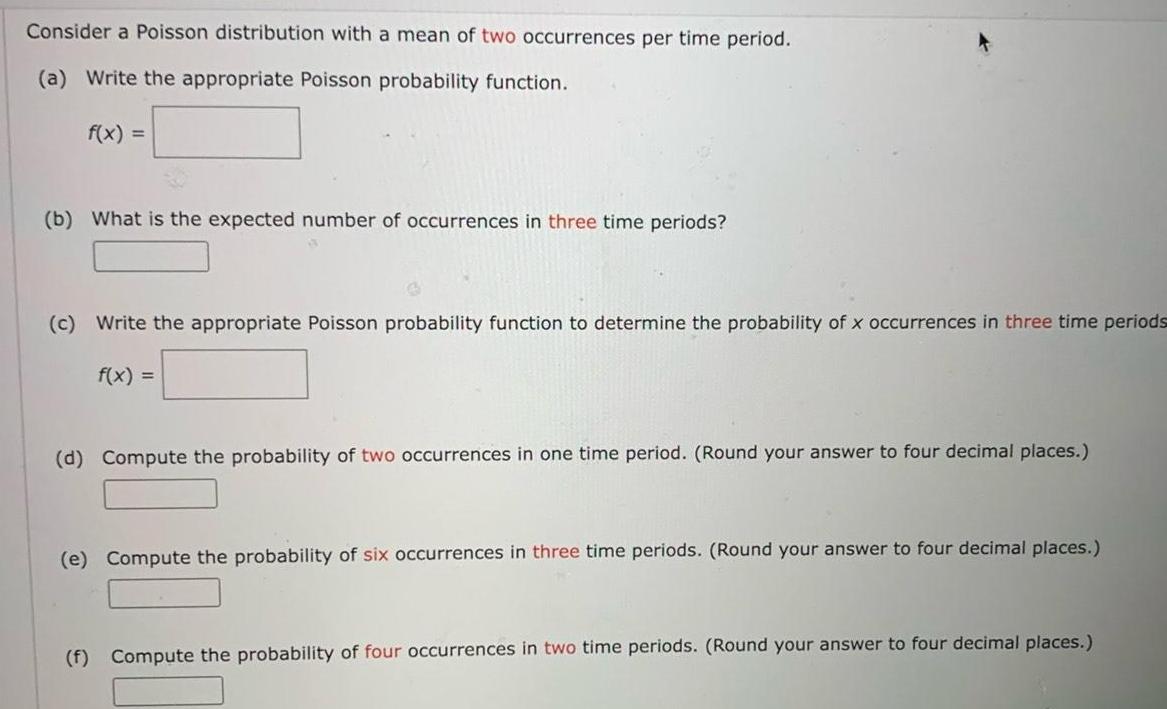
ProbabilityConsider a Poisson distribution with a mean of two occurrences per time period a Write the appropriate Poisson probability function f x b What is the expected number of occurrences in three time periods c Write the appropriate Poisson probability function to determine the probability of x occurrences in three time periods f x d Compute the probability of two occurrences in one time period Round your answer to four decimal places e Compute the probability of six occurrences in three time periods Round your answer to four decimal places f Compute the probability of four occurrences in two time periods Round your answer to four decimal places
Statistics
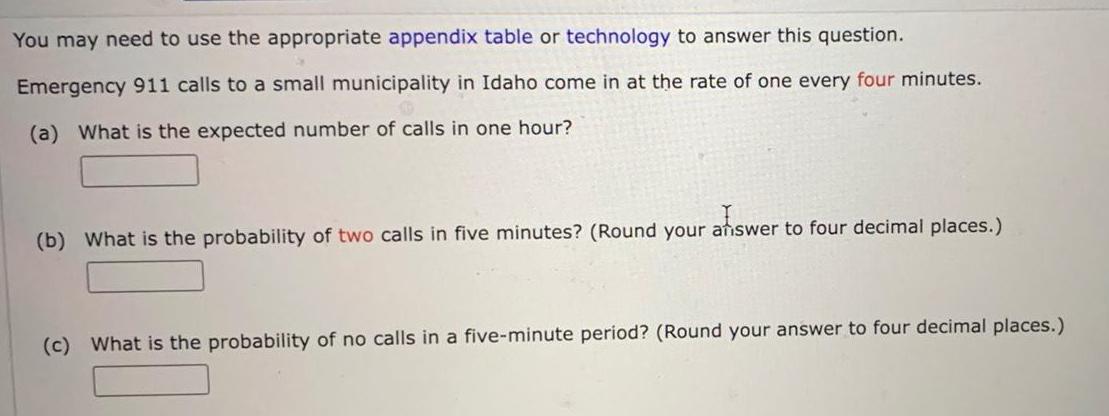
StatisticsYou may need to use the appropriate appendix table or technology to answer this question Emergency 911 calls to a small municipality in Idaho come in at the rate of one every four minutes a What is the expected number of calls in one hour afiswer b What is the probability of two calls in five minutes Round your answer to four decimal places c What is the probability of no calls in a five minute period Round your answer to four decimal places
Statistics
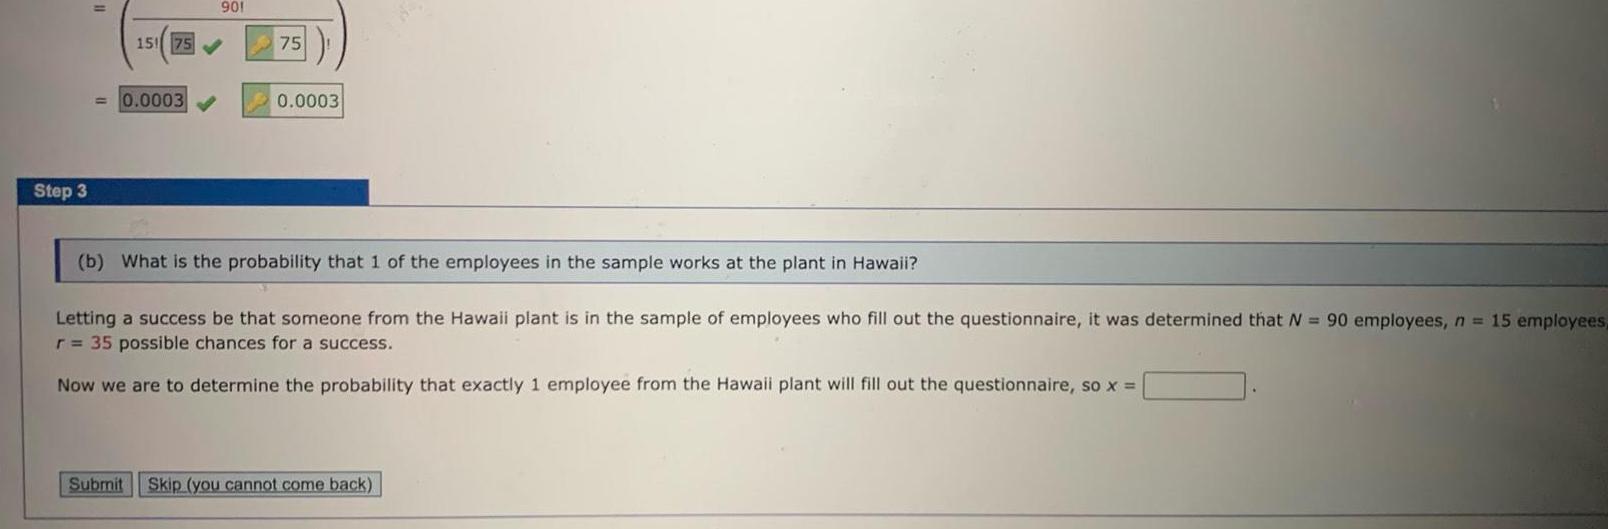
ProbabilityStep 3 901 15 75 0 0003 75 0 0003 b What is the probability that 1 of the employees in the sample works at the plant in Hawaii Letting a success be that someone from the Hawaii plant is in the sample of employees who fill out the questionnaire it was determined that N 90 employees n 15 employees r 35 possible chances for a success Now we are to determine the probability that exactly 1 employee from the Hawaii plant will fill out the questionnaire so x Submit Skip you cannot come back
Statistics
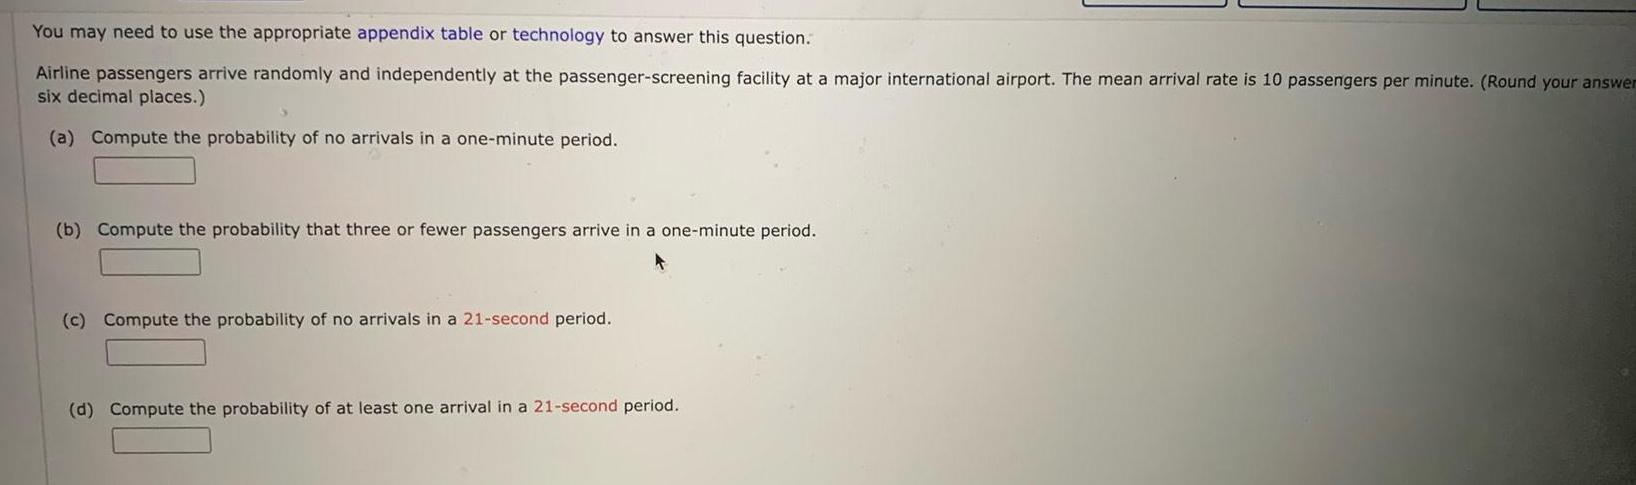
ProbabilityYou may need to use the appropriate appendix table or technology to answer this question Airline passengers arrive randomly and independently at the passenger screening facility at a major international airport The mean arrival rate is 10 passengers per minute Round your answer six decimal places a Compute the probability of no arrivals in a one minute period b Compute the probability that three or fewer passengers arrive in a one minute period c Compute the probability of no arrivals in a 21 second period d Compute the probability of at least one arrival in a 21 second period
Statistics
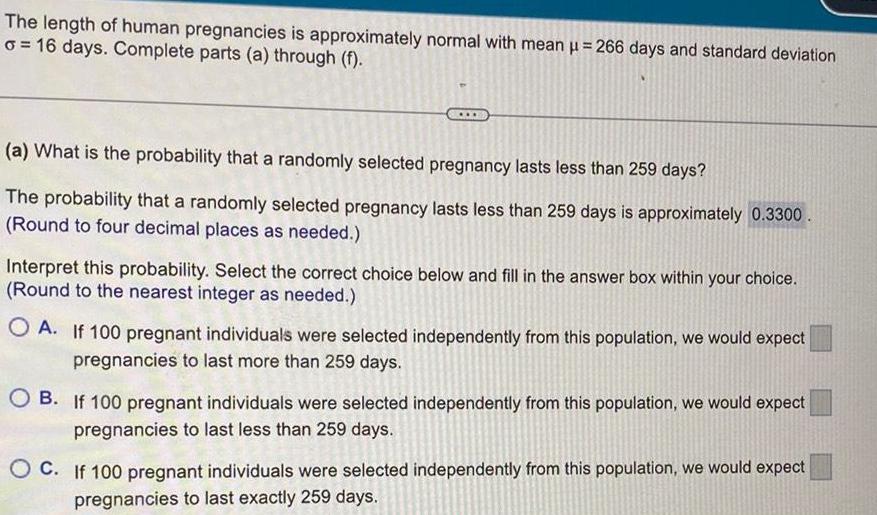
ProbabilityThe length of human pregnancies is approximately normal with mean 266 days and standard deviation o 16 days Complete parts a through f a What is the probability that a randomly selected pregnancy lasts less than 259 days The probability that a randomly selected pregnancy lasts less than 259 days is approximately 0 3300 Round to four decimal places as needed Interpret this probability Select the correct choice below and fill in the answer box within your choice Round to the nearest integer as needed OA If 100 pregnant individuals were selected independently from this population we would expect pregnancies to last more than 259 days OB If 100 pregnant individuals were selected independently from this population we would expect pregnancies to last less than 259 days OC If 100 pregnant individuals were selected independently from this population we would expect pregnancies to last exactly 259 days
Statistics
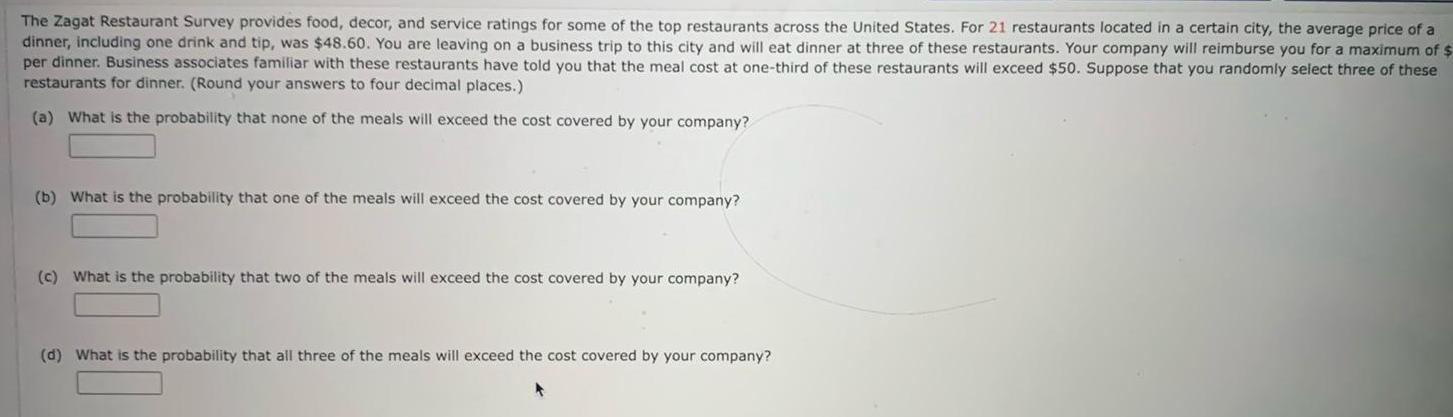
ProbabilityThe Zagat Restaurant Survey provides food decor and service ratings for some of the top restaurants across the United States For 21 restaurants located in a certain city the average price of a dinner including one drink and tip was 48 60 You are leaving on a business trip to this city and will eat dinner at three of these restaurants Your company will reimburse you for a maximum of per dinner Business associates familiar with these restaurants have told you that the meal cost at one third of these restaurants will exceed 50 Suppose that you randomly select three of these restaurants for dinner Round your answers to four decimal places a What is the probability that none of the meals will exceed the cost covered by your company b What is the probability that one of the meals will exceed the cost covered by your company c What is the probability that two of the meals will exceed the cost covered by your company d What is the probability that all three of the meals will exceed the cost covered by your company
Statistics
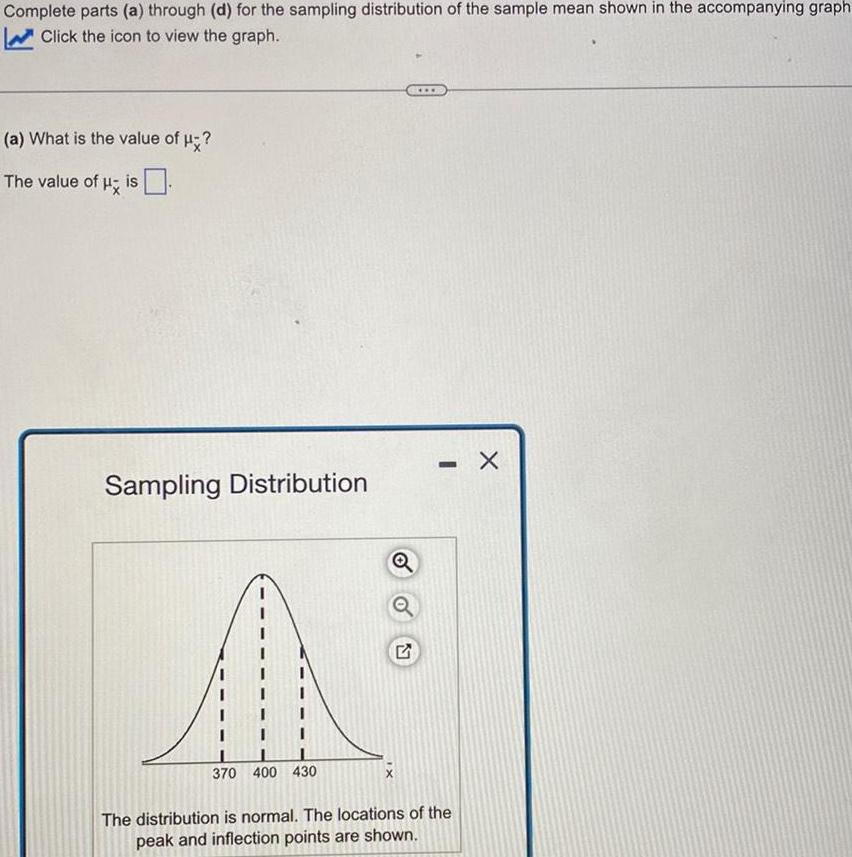
StatisticsComplete parts a through d for the sampling distribution of the sample mean shown in the accompanying graph Click the icon to view the graph a What is the value of The value of His Sampling Distribution 370 400 430 Q 2 www The distribution is normal The locations of the peak and inflection points are shown X
Statistics
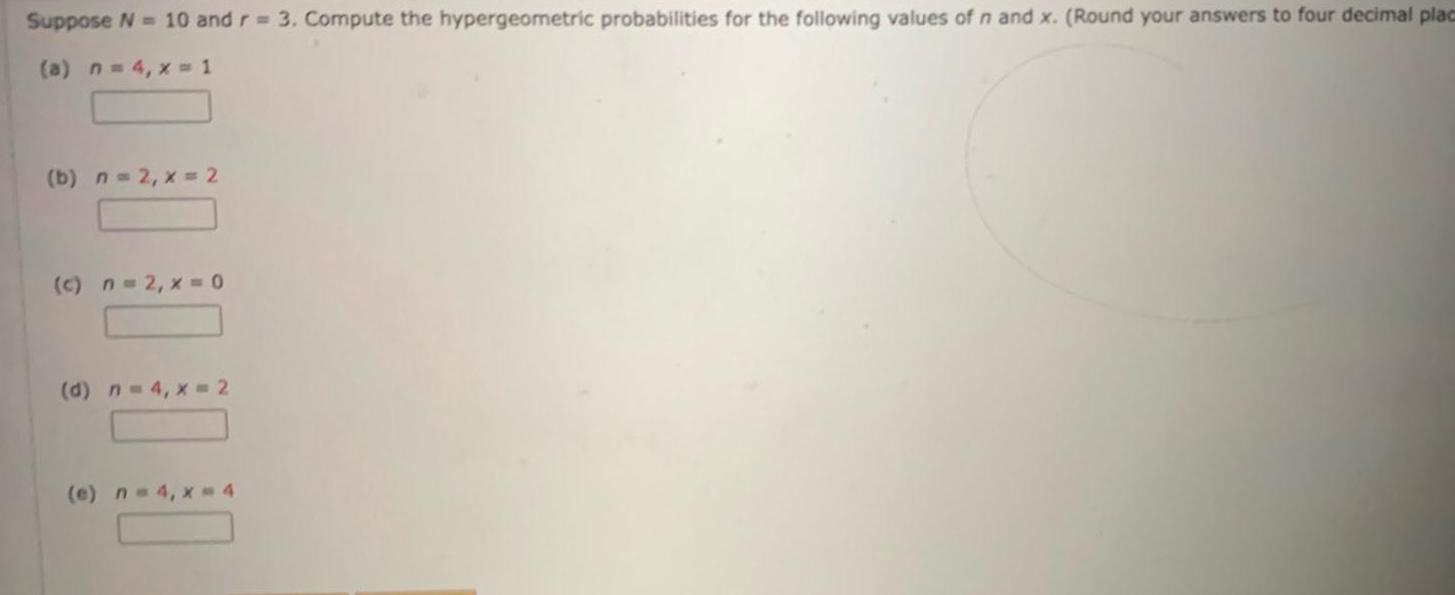
ProbabilitySuppose N 10 and r 3 Compute the hypergeometric probabilities for the following values of n and x Round your answers to four decimal plac a n 4 x 1 b n 2 x 2 c n 2 x 0 d n 4 x 2 e n 4 x 4
Statistics
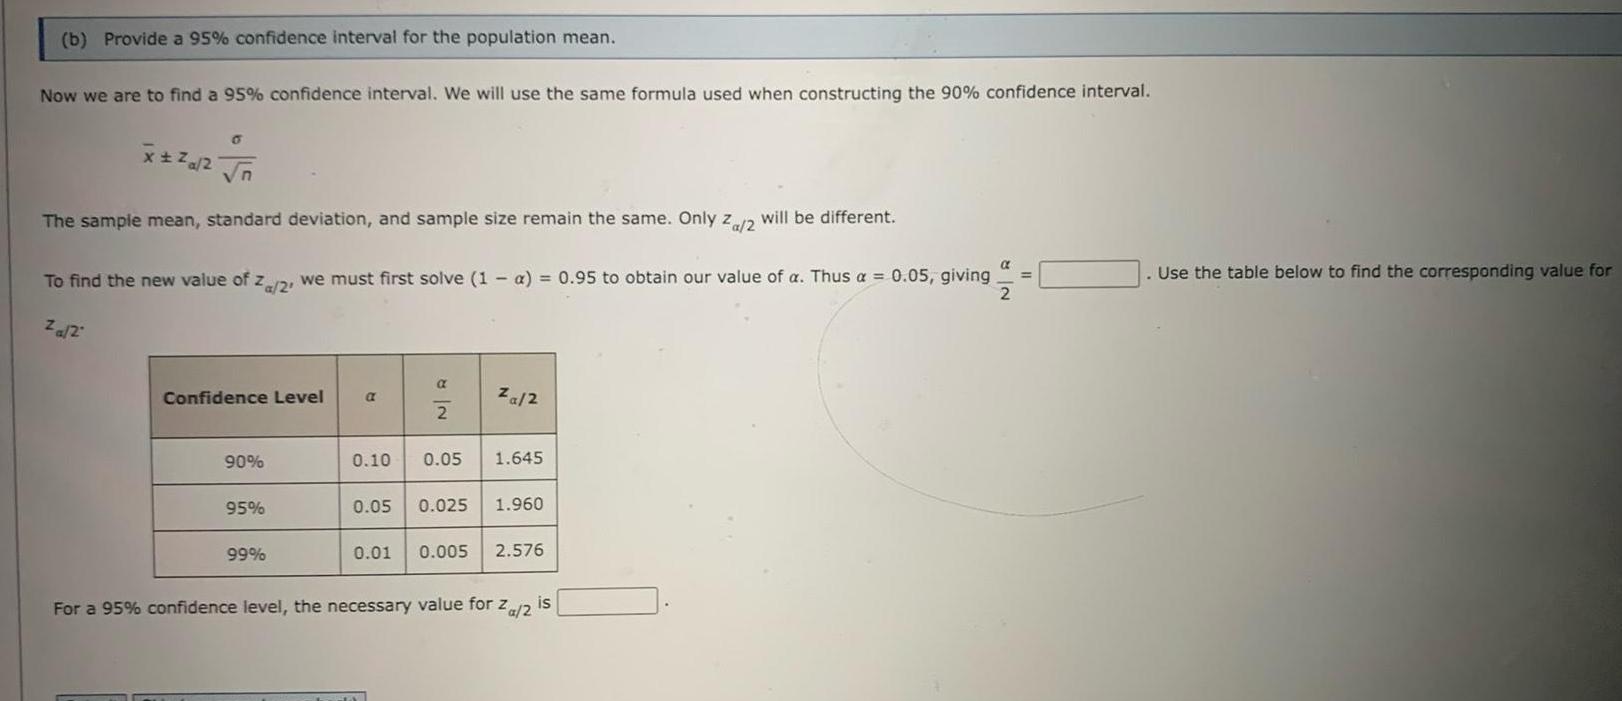
Statisticsb Provide a 95 confidence interval for the population mean Now we are to find a 95 confidence interval We will use the same formula used when constructing the 90 confidence interval x n The sample mean standard deviation and sample size remain the same Only Za 2 will be different To find the new value of z 2 we must first solve 1 a 0 95 to obtain our value of a Thus a 0 05 giving 2 za 2 Confidence Level 90 95 99 a NR 2 za 2 0 10 0 05 1 645 0 05 0 025 1 960 0 01 0 005 2 576 For a 95 confidence level the necessary value for Za 2 is Use the table below to find the corresponding value for
Statistics
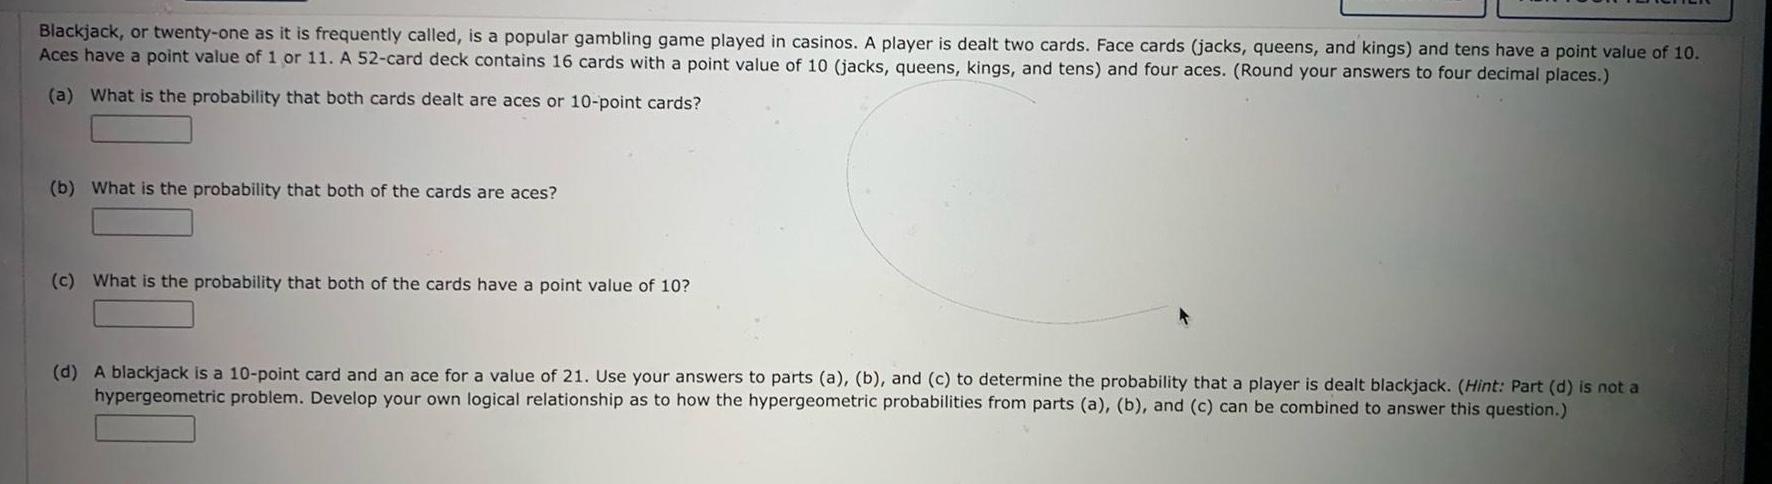
ProbabilityBlackjack or twenty one as it is frequently called is a popular gambling game played in casinos A player is dealt two cards Face cards jacks queens and kings and tens have a point value of 10 Aces have a point value of 1 or 11 A 52 card deck contains 16 cards with a point value of 10 jacks queens kings and tens and four aces Round your answers to four decimal places a What is the probability that both cards dealt are aces or 10 point cards b What is the probability that both of the cards are aces c What is the probability that both of the cards have a point value of 10 d A blackjack is a 10 point card and an ace for a value of 21 Use your answers to parts a b and c to determine the probability that a player is dealt blackjack Hint Part d is not a hypergeometric problem Develop your own logical relationship as to how the hypergeometric probabilities from parts a b and c can be combined to answer this question
Statistics
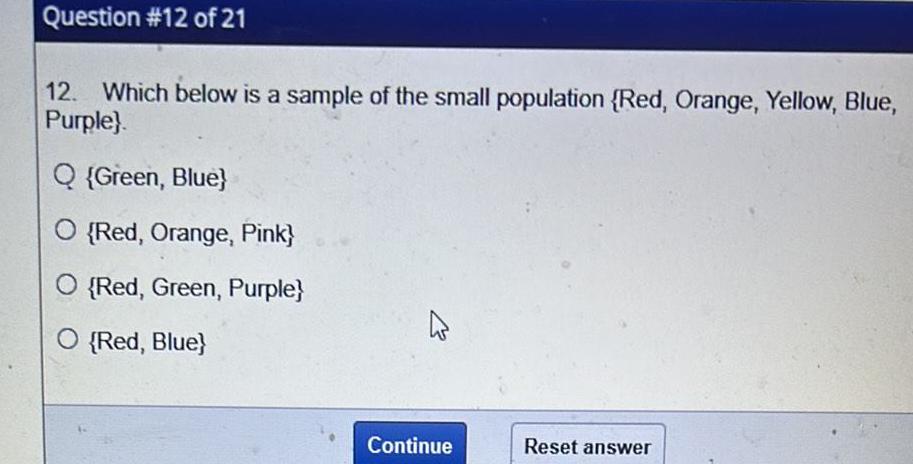
StatisticsQuestion 12 of 21 12 Which below is a sample of the small population Red Orange Yellow Blue Purple Q Green Blue O Red Orange Pink O Red Green Purple O Red Blue Continue Reset answer
Statistics
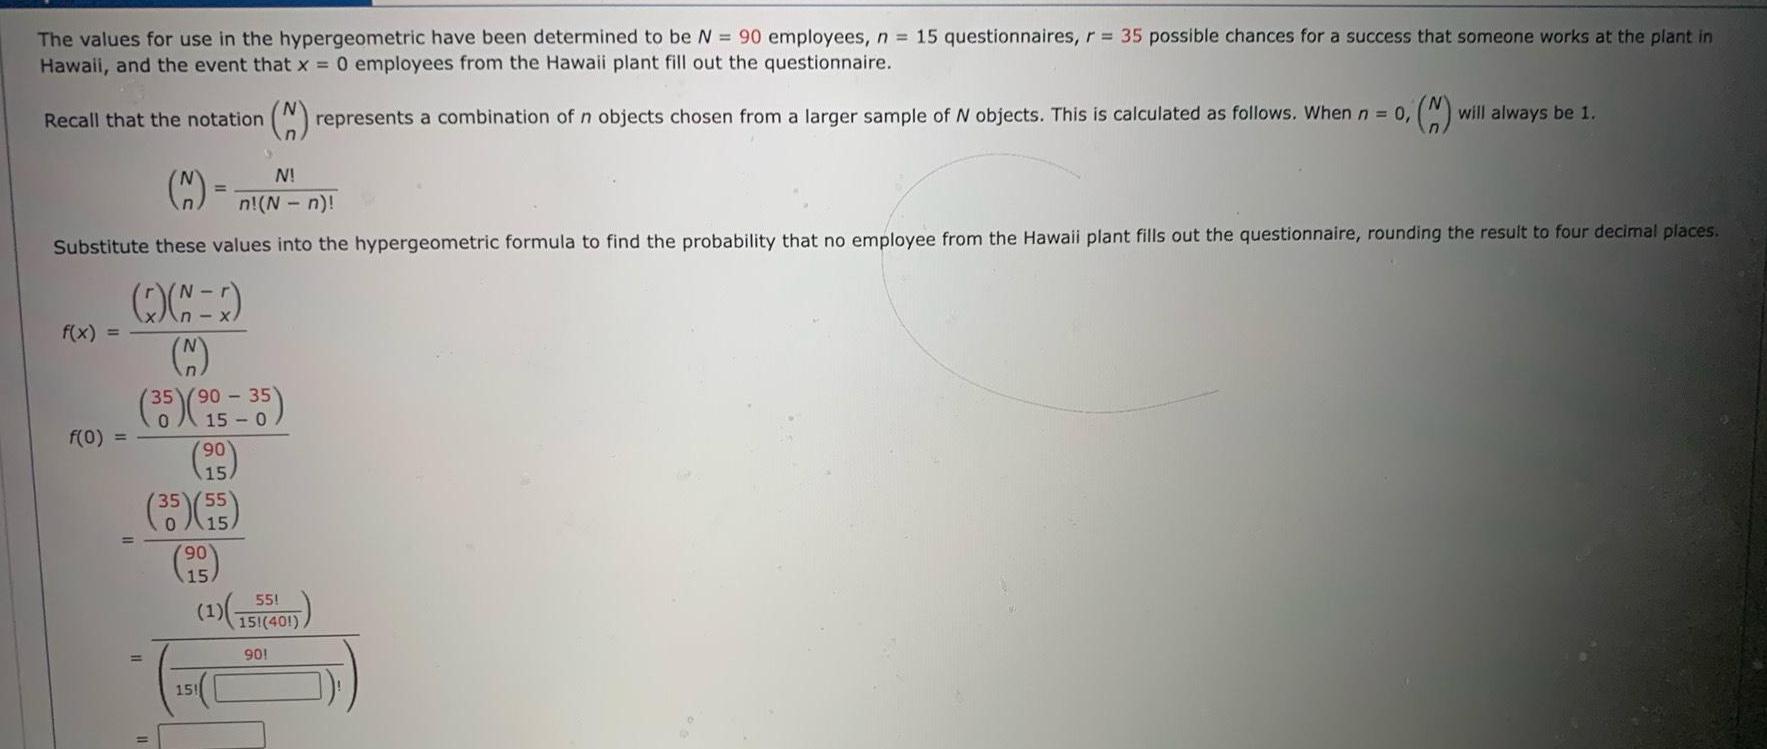
StatisticsThe values for use in the hypergeometric have been determined to be N 90 employees n 15 questionnaires r 35 possible chances for a success that someone works at the plant in Hawaii and the event that x 0 employees from the Hawaii plant fill out the questionnaire 2 represents a combination of n objects chosen from a larger sample of N objects This is calculated as follows When n 0 will always be 1 M N n N n Substitute these values into the hypergeometric formula to find the probability that no employee from the Hawaii plant fills out the questionnaire rounding the result to four decimal places Recall that the notation f x f 0 1 35 90 35 90 15 35 55 15 90 15 55 1 151 401 901 151
Statistics
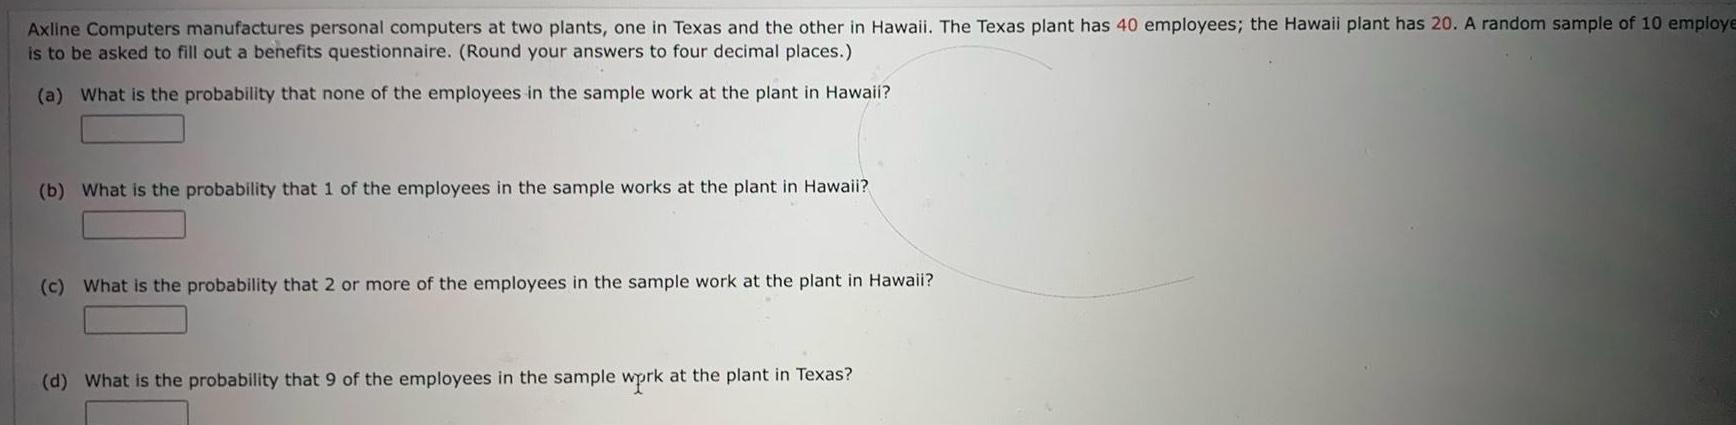
ProbabilityAxline Computers manufactures personal computers at two plants one in Texas and the other in Hawaii The Texas plant has 40 employees the Hawaii plant has 20 A random sample of 10 employe is to be asked to fill out a benefits questionnaire Round your answers to four decimal places a What is the probability that none of the employees in the sample work at the plant in Hawaii b What is the probability that 1 of the employees in the sample works at the plant in Hawaii c What is the probability that 2 or more of the employees in the sample work at the plant in Hawaii d What is the probability that 9 of the employees in the sample wprk at the plant in Texas
Statistics
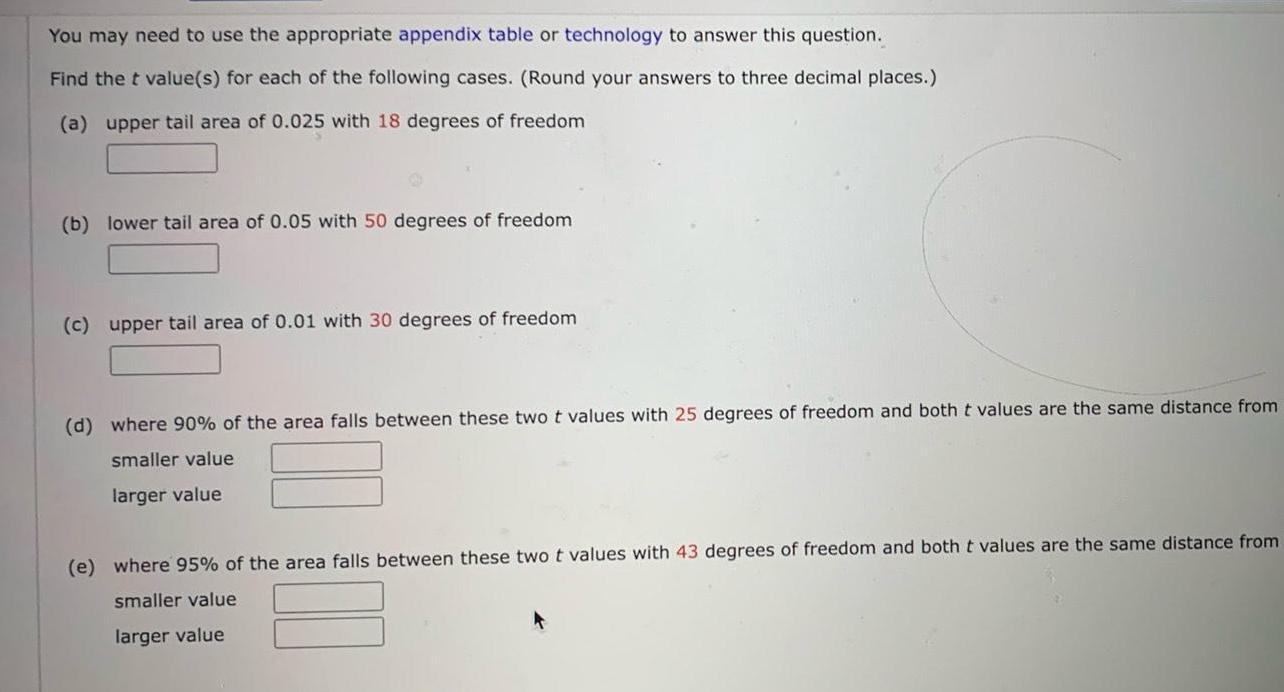
StatisticsYou may need to use the appropriate appendix table or technology to answer this question Find the t value s for each of the following cases Round your answers to three decimal places a upper tail area of 0 025 with 18 degrees of freedom b lower tail area of 0 05 with 50 degrees of freedom c upper tail area of 0 01 with 30 degrees of freedom d where 90 of the area falls between these two t values with 25 degrees of freedom and both t values are the same distance from smaller value larger value e where 95 of the area falls between these two t values with 43 degrees of freedom and both t values are the same distance from smaller value larger value

Statistics
StatisticsYou may need to use the appropriate appendix table or technology to answer this question A random sample of 85 airline pilots recruited by an airline service had an average yearly income of 99 100 with a standard deviation of 11 000 a If we want to determine a 95 confidence interval for the average yearly income of the population what is the value of t Round your answer to three decimal places t b Develop a 95 confidence interval for the average yearly income of all pilots in dollars Round your answers to the nearest dollar to