Statistics Questions
The best high school and college tutors are just a click away, 24×7! Pick a subject, ask a question, and get a detailed, handwritten solution personalized for you in minutes. We cover Math, Physics, Chemistry & Biology.

Statistics
StatisticsChronic pain is often defined as pain that occurs constantly and flares up frequently is not caused by cancer and is experienced at least once a month for a 1 year period of time Many articles have been written about the relationship between chronic pain and the age of the patient In a survey conducted on behalf of the American Chronic Pain Association in 2004 a random cross section of 800 adults who suffer from chronic pain found that 424 of the 800 participants in the survey were above the age of 50 Place a 95 confidence interval on the proportion of persons suffering from chronic pain that are over 50 years of age 0 405 0 601 O 0 495 0 565 O 0 361 0 631 O 0 452 0 542

Statistics
Probabilityparts a through d a Find the probability of choosing all first shift workers Round to four decimal places as needed b Find the probability of choosing all second shift workers Round to four decimal places as needed c Find the probability of choosing exactly six first shift workers Round to four decimal places as needed d Find the probability of choosing exactly four second shift workers Round to four decimal places as needed

Statistics
StatisticsA company that has 150 employees chooses a committee of 17 to represent employee retirement issues When the committee is formed none of the 56 minority employees ar selected a Use technology to find the number of ways 17 employees can be chosen from 150 b Use technology to find the number of ways 17 employees can be chosen from 94 nonminorities c What is the probability that the committee contains no minorities when the committee is chosen randomly without bias d Does your answer to c indicate that the committee selection is biased Explain your reasoning a There are Use scientific ways to choose 17 employees from 150 employees notation Round to two decimal places as needed Use the multiplication symbol in the math palette as needed b There are ways to choose 17 employees from 94 nonminorities Use scientific notation Round to two decimal places as needed Use the multiplication symbol in the math palette as needed c The probability is Do not round until the final answer Then round to three decimal places as needed d the committee selection is most likely because the probability that was found in part c is

Statistics
StatisticsYou may need to use the appropriate appendix table or technology to answer this question A random sample of 121 checking accounts at a bank showed an average daily balance of 290 The standard deviation of the population is known to be 88 a Is it necessary to know anything about the shape of the distribution of the account balances in order to make an interval estimate of the mean of all the account balances Explain O Yes the sample is large and the standard deviation of the population is known so we also need to know that the shape of the distribution is at least approximately bell shaped O No the standard deviation is larger than the mean so we do not need to know anything about the shape of the distribution O No the sample is large and the standard deviation of the population is known so we do not need to know anything about the shape of the distribution O No the mean is larger than the standard deviation so we do not need to know anything about the shape of the distribution O Yes the mean is larger than the standard deviation so we so need to know that the shape of the distribution is at least approximately bell shaped b Find the standard error of the mean in dollars c Give a point estimate of the population mean in dollars d Construct an 80 confidence interval for the population mean in dollars Round your answers to the nearest cent to e Construct a 95 confidence interval for the population mean in dollars Round your answers to the nearest cent to

Statistics
ProbabilityYou may need to use the appropriate appendix table or technology to answer this question A random sample of 81 credit sales in a department store showed an average sale of 65 00 From past data it is known that the standard deviation of the population is 26 a Determine the standard error of the mean in dollars Round your answer to the nearest cent X 3 b With a 0 95 probability what can be said about the size of the margin of error O There is a 0 95 probability that the distance between the sample mean and the population mean will equal the margin of error O There is a 0 95 probability that the distance between the sample mean and the population mean will be greater than or equal to the margin of error There is a 0 95 probability that the margin of error and the population mean are equal O There is a 0 95 probability that the sample mean and the population mean are equal O There is a 0 95 probability that the distance between the sample mean and the population mean will be less than or equal to the margin of error c What is the 95 confidence interval of the population mean in dollars Round your answers to the nearest cent X 58 9023 X to 71 0977 X

Statistics
Probability2 33 The IRS plans an SRS The Internal Revenue Service plans to examine an SRS of individual federal income tax returns from each state One variable of interest is the proportion of returns claiming itemized deduc tions The total number of tax returns in a state varies from almost 30 million in California to approximately 500 000 in Wyoming a Will the margin of error for estimating the popula tion proportion change from state to state if an SRS of 2000 tax returns is selected in each state Explain your answer b Will the margin of error change from state to state if an SRS of 1 of all tax returns is selected in each ver
Statistics
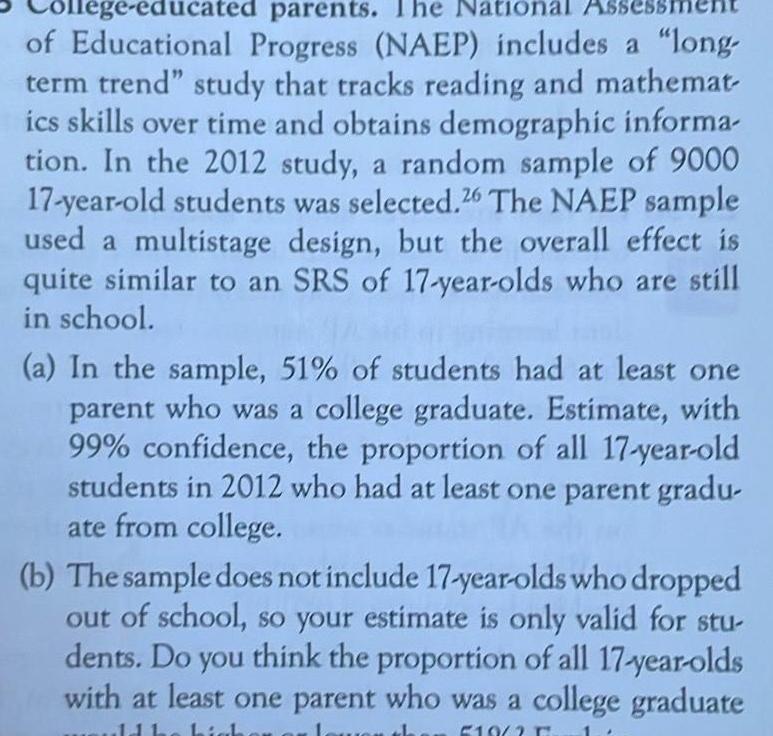
Statisticsge educated parents The National Asses of Educational Progress NAEP includes a long term trend study that tracks reading and mathemat ics skills over time and obtains demographic informa tion In the 2012 study a random sample of 9000 17 year old students was selected 26 The NAEP sample used a multistage design but the overall effect is quite similar to an SRS of 17 year olds who are still in school a In the sample 51 of students had at least one parent who was a college graduate Estimate with 99 confidence the proportion of all 17 year old students in 2012 who had at least one parent gradu ate from college b The sample does not include 17 year olds who dropped out of school so your estimate is only valid for stu dents Do you think the proportion of all 17 year olds with at least one parent who was a college graduate 111 higher or lower the F19 2 F

Statistics
Probabilitytep 2 39 Order in choice Does the order in which wine is pre sented make a difference Several choices of wine are pre sented one at a time and in sequence and the subject is then asked to choose the preferred wine at the end of the sequence In this study subjects were asked to taste two wine samples in sequence Both samples given to a subject were the same wine although subjects were expecting to taste two different samples of a particular variety Of the 32 subjects in the study 22 selected the wine presented first when presented with two identical wine samples 29 a Do the data give good reason to conclude that the subjects are not equally likely to choose either of the two positions when presented with two identi cal wine samples in sequence b The subjects were recruited in Ontario Canada via advertisements to participate in a study of at titudes and values toward wine Can we generalize

Statistics
Probability1 Running red survey of 880 drivers asked Recalling the last 10 traf fic lights you drove through how many of them were red when you entered the intersections Of the 880 respondents 171 admitted that at least one light had been red 24 a Give a 95 confidence interval for the proportion of all drivers who ran one or more of the last 10 red lights they met b Nonresponse is a practical problem for this survey only 21 6 of calls that reached a live person were completed Another practical problem is that people may not give truthful answers What is the likely direction of the bias do you think more or fewer than 171 of the 880 respondents really ran a red

Statistics
StatisticsYou may need to use the appropriate appendix table or technology to answer this question A simple random sample of 50 items resulted in a sample mean of 25 The population standard deviation is a 6 Round your answers to two decimal places a What is the standard error of the mean o b At 95 confidence what is the margin of error
Statistics
Probability25 Do smokers know that smoking is bad for them The Harris Poll asked a sample of smokers Do you believe that smoking will probably shorten your life or not Of the 1010 people in the sample 848 said Yes a Harris called residential telephone numbers at ran dom in an attempt to contact an SRS of smokers Based on what you know about national sample surveys what is likely to be the biggest weakness in the survey b We will nonetheless act as if the people interviewed are an SRS of smokers Give a 95 confidence interval for the percent of smokers who agree tha smoking will probably shorten their lives alessandro0770 Getty Images

Statistics
StatisticsStep 10 The probability that a student takes longer than 130 minutes and is thus unable to complete the exam was determined to be 0 0668 Thus in a sample of students it is expected that the portion of students unable to complete the exam will be 0 0668 Multiply this probability by the number of students taking the exam 80 to determine how many students will not complete the exam rounding the result up to the nearest integer students unable to complete exam 0 0668 sample size of students taking exam 0 0668 80 students

Statistics
Statistics13 Gaming and Gamers Although there have been major debates about the impact of video games on society gaming continues to gain exposure to a wider audience and has become part of the cultural mainstream with about half of all adults having played a video game on a computer TV game console or portable device like a cell phone A survey in 2015 of a random sample of 925 adults who play video games asked Some people use the term gamer to describe themselves as a fan of gaming or a frequent game player Do you think the term gamer describes you well or not Of the 925 adults in the sample 185 described themselves as gamers 1 a Give the 95 large sample confidence interval for the proportion p of all adults that play video games who would describe themselves as gamers Be sure to verify that the sample size is large enough to use the large sample confidence interval b Give the plus four 95 confidence interval for p If you express the two intervals in percents rounded to the nearest 10th of a percent how do they differ The plus four interval always pulls the results away from 0 1000 whichever is closer
Statistics
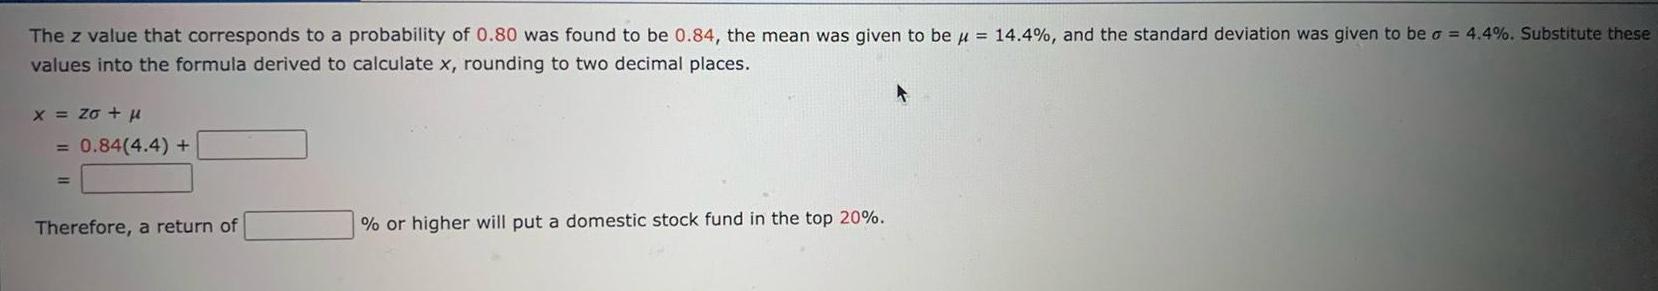
StatisticsThe z value that corresponds to a probability of 0 80 was found to be 0 84 the mean was given to be 14 4 and the standard deviation was given to be o 4 4 Substitute these values into the formula derived to calculate x rounding to two decimal places x Zo 0 84 4 4 Therefore a return of or higher will put a domestic stock fund in the top 20

Statistics
StatisticsStep 2 The lower bound of the confidence interval is calculated using the expression x Za 2 V rounding the final value to two decimal places 7 33 O x a n x za 2 O n The upper bound is found in a similar fashion but now we will add the margin of error instead of subtracting it Again round the final value to two decimal places 7 50 33 50 Substitute the values x 33 Za 2 1 645 o 7 and n 50 into this formula and simplify Submit Skip you cannot come back Thus a 90 confidence interval for the population mean in a sample of 50 items with a sample mean of 33 and a population standard deviation of 7 is to

Statistics
ProbabilityThe pie chart to the right shows how adults rate their financial shape Suppose 18 people are chosen at random from a group of 200 What is the probability that none of the 18 people would rate their financial shape as fair Make the assumption that the 200 people are represented by the pie chart The probability that none of the 18 people would rate their financial shape as fair is Round to six decimal places as needed Excellent 5 Good 44 Fair 36 Poor 13 Other 2

Statistics
Statistics2 29 Internet searches and cell phones Pew Research Cen ter s Internet and American Life Project asked a ran dom sample of 2485 cell phone users whether they had used their cell phone to look up health or medical in formation Of these 422 said Yes 22 a Pew dialed cell phone telephone numbers at ran dom in the continental United States in an attempt to contact a random sample of adults Based on what you know about national sample surveys what is likely to be the biggest weakness in the survey b Act as if the sample is an SRS Give a large sample 90 confidence interval for the proportion p of all cell phone users who have used their cell phone to look up health or medical information c Three out of the five most popular health related searches on cell phones have to do with sex preg nancy herpes and STD sexually transmitted diseases Sex related queries don t even show up on Google and Yahoo s list of top five health searches on computers What do you think explains the dif ference in the topics for health related searches on cell phones versus computers When drawing con

Statistics
StatisticsThe height was recorded for each high school basketball player in a sample of 30 A 95 confidence interval for u is 70 74 inches a The individual object in the study was a randomly selected This is computer graded so use exact wording from the problem above b What was the variable information recorded for each object in the study This is computer graded so use exact wording from the problem above c State the statistical interpretation of the confidence interval in the context of this problem Select an answer players is are between the d What is the symbol and value of the point estimate for u v inches e What is the margin of error for the given interval inches height of high school basketball and f Fill in the boxes below to show the relation on the number line between the numeric values of the point estimate and the interval estimate for C

Statistics
ProbabilityYou look over the songs in a jukebox and determine that you like 17 of the 55 songs a What is the probability that you like the next four songs that are played Assume a song cannot be repeated b What is the probability that you do not like the any of the next four songs that are played Assume a song cannot be repeated a The probability that you like the next four songs that are played is Round to three decimal places as needed b The probability that you do not like any of the next four songs that are played is Round to three decimal places as needed IDEERI

Statistics
Statistics7 Did You Use a Mobile Device The Monterey Bay Aquarium founded in 1984 is situated on the beautiful coast of Monterey Bay in the historic Cannery Row district In 1985 the aquarium began a survey program that involved ran domly sampling visitors as they exit for the day The survey includes visitor de mographic information use of social media and opinions on their aquarium visit In 2015 the survey included 356 visitors over age 65 of which 52 used a mobile device such as an Android phone or iPad during their visit a What is the margin of error of the large sample 95 confidence interval for the proportion of visitors over 65 who used a mobile device during their visit b How large a sample is needed to get the common 3 percentage point margin of error Use the 2015 sample as a pilot study to get p

Statistics
Statistics11 No Test Explain whether we can use the z test for a proportion in these situations a You toss a coin 10 times in order to test the hypothesis Ho p 0 5 that the coin is balanced b A local candidate contacts an SRS of 900 of the registered voters in his district to see if there is evidence that more than half support the bill he is sponsoring c A college president says 99 of the alumni support my firing of Coach Boggs You contact an SRS of 200 of the college s 15 000 living alumni to test the hypothesis Ho p 0 99

Statistics
Statistics3 Do You Eat Breakfast Although more than 50 of American adults believe the maxim that breakfast is the most important meal of the day only about 30 eat breakfast daily A cereal manufacturer contacts an SRS of 1500 American adults and calculates the proportion in this sample who eat breakfast daily a What is the approximate distribution of p b If the sample size were 6000 rather than 1500 what would be the approximate distribution of p

Statistics
ProbabilityA certain lottery has 25 numbers In how many different ways can 5 of the numbers be selected Assume that order of selection is not important There are different ways the numbers can be selected Simplify your answer

Statistics
Statistics5 Canadian Attitudes toward Guns Canada has much stronger gun control laws than the United States and Canadians support gun control more strongly than do Americans A sample survey asked a random sample of 1505 adult Canadians Do you agree or disagree that all firearms should be registered Of the 1505 people in the sample 1288 answered either Agree strongly or Agree somewhat a The survey dialed residential telephone numbers at random in all 10 Canadian provinces omitting the sparsely populated northern territo ries Based on what you know about sample surveys what is likely to be the biggest weakness in this survey b Nonetheless act as if we have an SRS from adults in the Canadian pro vinces Give a 95 confidence interval for the proportion who support registration of all firearms
Statistics
Statistics1 Staph Infections A study investigated ways to prevent staph infections in surgery patients In a first step the researchers examined the nasal secretions of a random sample of 6771 patients admitted to various hospitals for surgery They found that 1251 of these patients tested positive for Staphylococcus aureus a bacterium responsible for most staph infections 4 a Describe the population and explain in words what the parameter p is b Give the numerical value of the statistic p that estimates p

Statistics
StatisticsA sample of 30 newborn babies was taken and whether or not they needed special care was recorded A 95 confidence interval for p is 69 72 a The individual object in the study was a randomly selected This is computer graded so use exact wording from the problem above Remember an individual is ONE of something b What was the variable information recorded for each object in the study This is computer graded so use exact wording from the problem above The variable information was whether or not they c State the statistical interpretation of the confidence interval in the context of this problem the Select an answer of newborn babies that needed special care is and Select an answer between d What is the symbol and value of the point estimate for p v e What is the margin of error for the given interval f Fill in the boxes below to show the relation on the number line between the numeric values of the point estimate and the interval estimate for p C

Statistics
StatisticsA golf course architect has four linden trees three white birch trees and three bald cypress trees to plant in a row along a fairway In how many ways can the landscaper plant the rees in a row assuming that the trees are evenly spaced The trees can be planted in different ways

Statistics
StatisticsExpress the confidence interval 737 2 138 5 in the form of a trilinear inequality 595 7 X 872 7 X


Statistics
StatisticsExpress the confidence interval 737 2 138 5 in the form of a trilinear inequality H

Statistics
ProbabilityExpress the confidence interval 80 4 8 6 in interval form Express the answer in decimal format do not enter as percents


Statistics
StatisticsSuppose you compute a confidence interval with a sample size of 48 What will happen to the confidence interval if the sample size increases to 86 O The confidence interval will widen O The confidence interval will narrow O The width of the confidence interval will stay the same

Statistics
StatisticsSuppose each box of a popular brand of cereal contains a pen as a prize The pens come in four colors blue red green and yellow Each color of pen is equally likely to appear in any box of cereal What is the probability of having to buy at least five boxes of cereal to get a blue pen Show all of the work that leads to your solution

Statistics
Statistics35 Appliance sales A research firm supplies manufactur ers with estimates of the sales of their products from samples of stores Marketing managers often look at the sales estimates and ignore sampling error An SRS of 50 stores this month shows mean sales of 41 units of a particular appliance with standard deviation of 11 units During the same month last year an SRS of 52 stores gave mean sales of 38 units of the same appli ance with a standard deviation of 13 units An increase from 38 to 41 is a rise of 7 9 The marketing manager is happy because sales are up 7 9 a Give a 95 confidence interval for the difference in mean number of units of the appliance sold at all retail stores b Explain in language that the manager can under stand why he cannot be confident that sales rose by

Statistics
Statistics37 Improving your tips Researchers gave 40 index cards to a waitress at an Italian restaurant in New Jersey Before delivering the bill to each customer the waitress ran domly selected a card and wrote on the bill the same message that was printed on the index card Twenty of the cards had the message The weather is supposed to be really good tomorrow I hope you enjoy the day An other 20 cards contained the message The weather is supposed to be not so good tomorrow I hope you enjoy the day anyway After the customers left the waitress recorded the amount of the tip percent of bill before taxes Here are the tips for those receiving the good weather message 20 TIP4 20 8 18 7 19 9 20 6 21 9 23 4 22 8 24 9 22 2 20 3 24 9 22 3 27 0 20 5 22 2 24 0 21 2 22 1 22 0 22 7 The tips for the 20 customers who received the bad weather message are 18 0 19 1 19 2 18 8 18 4 19 0 18 5 16 1 16 8 14 0 17 0 13 6 17 5 20 0 20 2 18 8 18 0 23 2 18 2 19 4 a Make stemplots or histograms of both sets of data Because the distributions are reasonably symmetric with no extreme outliers the t procedures will work well h Is there good evidence that the two different messages

Statistics
Probabilityod and food In a study of the effects of mood on evaluation of nutritious food 208 subjects were ran domly assigned to read either a happy story to induce a positive mood or a control no story neutral mood group Subjects were then asked to evaluate their atti tude toward a certain indulgent food on a nine point scale with higher numbers indicating a more positive attitude toward the food The following table summa rizes data on the attitude rating 14 Group Positive mood Neutral mood n 104 104 X S 4 30 2 05 5 50 1 74 a What are the standard errors of the sample means of the two groups b What degrees of freedom does the conservative Op tion 2 use for two sample t procedures for these data c Test the null hypothesis of no difference between the two group means against the two sided alterna

Statistics
Probability11 Weeds among the Corn Lamb s quarter is a common weed that interferes with the growth of corn An agriculture researcher planted corn at the same rate in 16 small plots of ground then weeded the plots by hand to allow a fixed number of lamb s quarter plants to grow in each meter of corn row No other weeds were allowed to grow Here are the yields of corn bushels per acre for only the experimental plots controlled to have one weed per meter of row and nine weeds per meter of row WDCORN One weed meter 166 2 157 3 166 7 161 1 Nine weeds meter 162 8 142 4 162 8 162 4 Explain carefully why a two sample t confidence interval for the difference in

Statistics
Probability3 Smart Watch Battery Life To check the lifetime of a new battery in a soon to be released smart watch with GPS an engineer used the GPS tracking fea ture of the watch continuously beginning with a fully charged battery until the battery was drained The engineer repeated this for a total of 10 times He compared the results with the lifetime of 4 8 hours for the current battery used in the company s GPS enabled smart watch

Statistics
Probability1 1 Smartphones and Spouses Choose a random sample of 100 married couples Ask each member of the couple how much time they spend looking at their smartphone while at home Compare the mean times for the two mem bers of couples

Statistics
Statistics2 According to the National Institute on Alcohol Abuse and Alcoholism 45 of college students nationwide engage in binge drinking behavior having 5 or more drinks in one occasion during the past two weeks A college president wonders if the proportion of students enrolled at her college that binge drink is actually lower than the national proportion In a commissioned study 348 students are selected randomly from a list of all students enrolled at the college Of these 149 admitted to having engaged in binge drinking a 1 pt State the null and alternative hypotheses b 1 pt State the p value c 1 pt What is your conclusion about the null hypothesis Use a 5 level of significance d 2 pts What is your conclusion in context of this problem

Statistics
Probability1 According to the records of an auto insurance company the average distance that their customers drive to work is 17 4 miles You are a new agent and you think this is too low You do a random polling of 50 of the company s customers and you find that the average is 18 5 miles with a standard deviation of 3 4 miles Do these data provide enough evidence at the 0 05 level of significance to conclude that the average distance driven to work is actually more than 17 4 miles a 1 pt State the null and alternative hypotheses b 1 pt State the p value c 1 pt What is your conclusion about the null hypothesis d 2 pts What is your conclusion in context of this problem

Statistics
Statistics2 The standard error has a value of Put the letter as answer choice in the answer box A 7 6056 B 0 4111 C 18 5000 D 2 7578 A 3 The margin of error has a value of Put the letter as answer choice in the answer box A 49 8071 B 2 7578 C 7 4248 D 1 1068

Statistics
StatisticsFind the x intercept of the line y 6 6 x 6 Write your answer as an integer or as a simplified proper or improper fraction not as an ordered pair

Statistics
StatisticsComplete the process of solving the equation Fill in the missing term and select the missing description Simplify any fraction b 12 20 14 b 12 6 b Divide both sides by 20 Add 20 to both sides Subtract 20 from both sides Multiply both sides by 20 Divide both sides by 20 Apply the distributive property

Statistics
StatisticsComplete the process of solving the equation Fill in the missing term and select the missing description Simplify any fraction 69 t 9 19 61 9 10 t Multiply both sides by 9