Probability Questions and Answers

Statistics
ProbabilityA summary of home ownership statuses of loan applicants is displayed in the pie chart below rent 62 11 27 Suppose a loan is selected at random What is the probability that the applicant owns his her home What is the probability that the applicant rents What is the probability that the applicant does not have a mortgage mortgage 11 own 27

Statistics
ProbabilityA poll showed that 64 6 of Americans say they believe that some people see the future in their dreams What is the probability of randomly selecting someone who does not believe that some people see the future in their dreams Round to 3 decimal places

Statistics
Probabilityne bivariate frequency table below contains expected stats hours vs anxiety 1 to 10 scale 10 highest for a sample of 12 students from the class State your theoretical not based on the data hypothesis about the relationship between stats hours and anxiety and your reasoning briefly My theory is that people with higher anxiety will study a greater of hours positive relationship but theirs may be different Anxiety 10 1 99876543 2 1 3 1 1 4 1 5 2 6 27 2 7 1 8 9 Stats Hours 1 1 10 11 12 Extract the paired scores for each student from the table and calculate the correlation between anxiety and stats hours What can you say about the relationship between these two variables at the table Was your

Statistics
ProbabilityLet A and B be two disjoint events such that P A 0 16 and 3 0 42 What is P A or B Your Answer 0 58 I

Statistics
ProbabilityBogs are inbred for such desirable characteristics as blue eye color but an unfortunate by product of such inbreeding can be the emergence of characteristics such as deafness A 1992 study of Dalmatians by Strain and others as reported in The Dalmatians Dilemma found the following i 31 of all Dalmatians have blue eyes ii 38 of all Dalmatians are deaf iii If a Dalmatian has blue eyes there is a 42 chance that it is deaf What is the probability that a randomly chosen Dalmatian is blue eyed and deaf 0 31 0 38 0 1178 0 38 0 42 0 9048 0 31 0 42 0 1302 0 38 0 42 0 1596 0 31 0 38 0 8158

Statistics
ProbabilityA florist determines the probabilities for the number of flower arrangements they deliver each day X 19 20 21 22 23 P x 0 19 0 24 0 37 0 11 0 09 Your Answer Find the variance of the distribution rounded to 4 decimal places

Statistics
ProbabilityThe random variable X representing the number of accidents in adetain intersection in a week has the following probability distribution Your Answer 1 0 22 Amor 2 0 25 3 0 18 X 0 P X x 0 18 On average how many accidents are there in the intersection in a week Your answer should be given to 2 decimal places 4 0 09 5 0 08

Statistics
ProbabilitySuppose a basketball team had a season of games with the following characteristics Of all the games 54 were at home games Denote this by H the remaining were away games Of all the games 47 were wins Denote this by W the remaining were losses Of all the games 31 were at home wins Of the at home games what proportion of games were wins Your answer should be rounded to 4 decimal places

Statistics
ProbabilityLet A and B be two disjoint events such that P A 0 32 and P B What is P A and B Your Answer

Statistics
ProbabilityBelow is a probability distribution for the number of failures in an elementary statistics course X 0 1 P X x 0 42 0 18 Determine the following probability P X 3 2 Your Answer 3 0 11 0 07 4

Statistics
ProbabilityDetermine if the following could be a probability distribution for a discr random variable X If no state why X P X x 3 4 9 2 9 1 9 12 1 9 15 1 9 No the probabilities do not add up to 1 Yes the values of X are all positive No the values of X do not start at 1 and the probabilities do not add up to 1 Yes the probabilities associated with each X are all positive and they all add up

Statistics
ProbabilityLet A and B be two independent events If P A 0 68 and P B 0 22 what is P A B Your Answer

Statistics
ProbabilityLet A and B be two independent events such that P A 0 18 and P B 0 70 What is P A or B Your answer should be given to 4 decimal places Your Answer 0 7540

Statistics
ProbabilityAccording to the information that comes with a certain prescription drug when taking this drug there is a 19 chance of experiencing nausea N and a 50 chance of experiencing decreased sexual drive D The information also states that there is a 7 chance of experiencing both side effects What is the probability of experiencing only nausea Your answer should be rounded to two decimal places Your Answer
Statistics
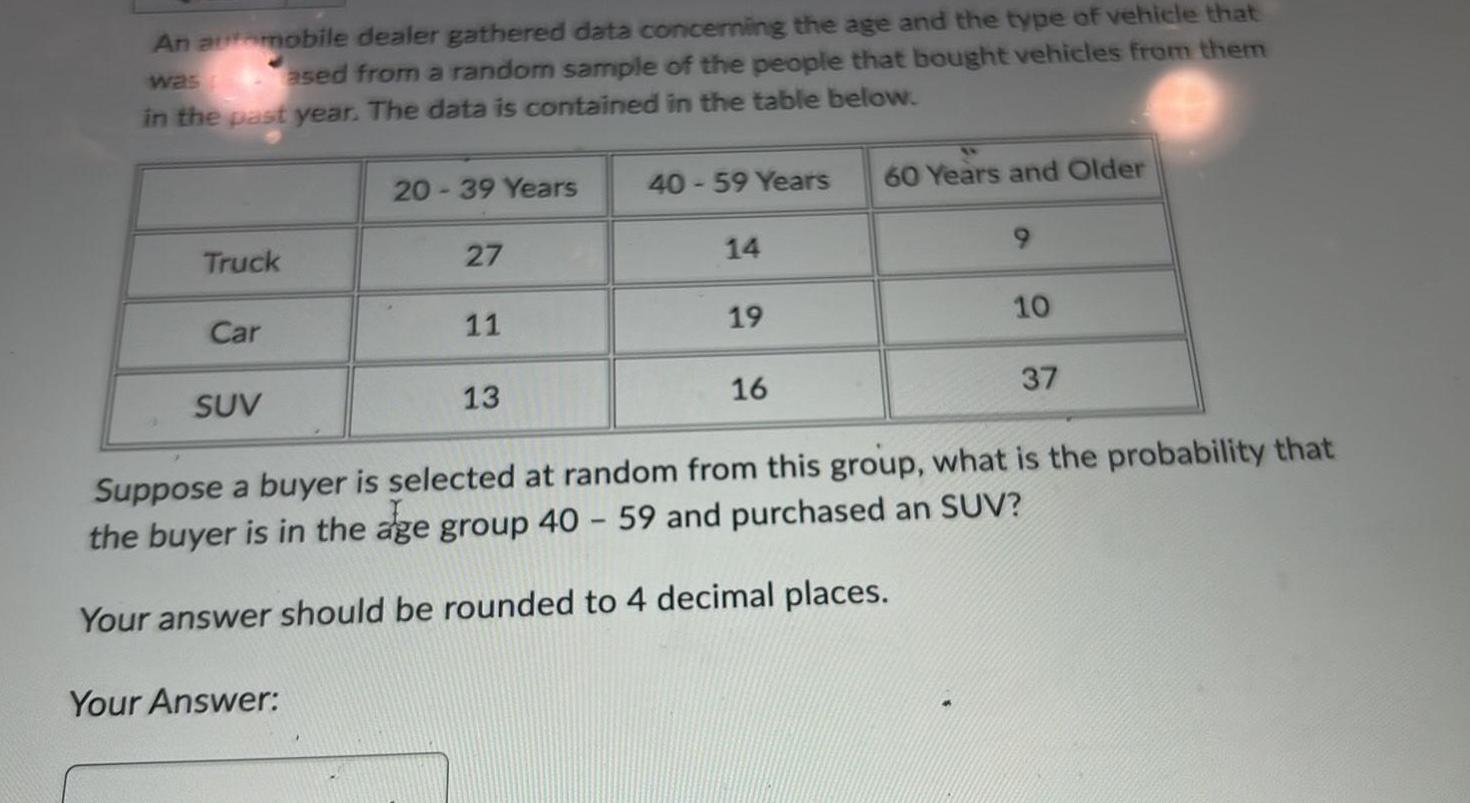
ProbabilityAn automobile dealer gathered data concerning the age and the type of vehicle that ased from a random sample of the people that bought vehicles from them in the past year The data is contained in the table below was Truck Car SUV 20 39 Years Your Answer 27 11 13 40 59 Years 14 19 16 60 Years and Older 10 37 Suppose a buyer is selected at random from this group what is the probability that the buyer is in the age group 40 59 and purchased an SUV Your answer should be rounded to 4 decimal places

Statistics
Probability1 2 pts A company that makes light bulbs would like to know what percentage of their light bulbs is defective when they leave their facilities They randomly select and test 100 of their light bulbs for defects Out of the light bulbs tested 4 of them did not work State the population and sample

Statistics
ProbabilityRuben is the proud owner of an eclectic bow tie collection He keeps track of how many bow ties he has and organizes them by pattern and material Velvet Cotton 3 1 Zigzags 4 Swirls 3 What is the probability that a randomly selected bow tie is made of cotton given that the bow tie is decorated with zigzags Simplify any fractions

Statistics
ProbabilityIn a recent year about 36 of all infants born in a country were conceived through in vitro fertilization IVF Of the IVF deliveries about twenty five percent resulted in multiple births a Find the probability that a randomly selected infant was conceived through IVF and was part of a multiple birth b Find the probability that a randomly selected infant conceived through IVF was not part of a multiple birth c Would it be unusual for a randomly selected infant to have been conceived through IVF and to have been part of a multiple birth Explain

Statistics
ProbabilityAn insurance company believes that people can be divided into two classes those who are accident prone and tho who are not The company s statistics show that an accident prone person will have an accident at some time withi fixed 1 year period with probability 0 4 whereas this probability decreases to 0 16 for a person who is not accident prone Assume that 21 percent of the population is accident prone Some probabilities that can be found from this a included in the accompanying information What is the probability that someone has an accident in the second year given that they had no accidents in the first year Click the icon to view the probabilities NNN The probability is Type an integer or decimal rounded to four decimal places as needed

Statistics
ProbabilityYou collected the data given in the table below on y and x Complete an OLS regression using this data For credit show all your work Observation 1 2 3 y 5 4 10 1 Using calculus estimate coefficients for the following equation where a is the intercept b is the slope and e is the error term Hint be sure to consider both the FOC and SOC y a bx e O Obser 1 2 3 X 4 2 2 Write the estimated equation in numerical form 2 Fill in the following table using your estimated equation Cells with do not need to be calculated Two decimal places are enough 9 y Y 9 9 9

Statistics
ProbabilityAn urn contains 23 balls of which 15 are white Three players A B and C successively draw from the urn A first then B then C then A and so on The winner is the first one to draw a white ball Find the probability of winning for each player if a each ball is replaced after it is drawn b the balls that are withdrawn are not replaced a The probability that A wins is Simplify your answers the probability that B wins is and the probability that C wins is

Statistics
Probabilitycannot have a negative acceleration Do you agree or disagree with this statement Justify your answer 17 What is the correct description of its motion during the ten second motion Baumgartner falls a Same distance every second b Further away every second c Less and less distance every second Even if Baumgartner doesn t have a parachute air resistance becomes important once he enters the denser layers of the atmosphere 18 List at least three factors that affect the air resistance of an object 19 Which of the following best explains how air resistance affects movement Air resistance caused it a decreased speed so that it takes less time to reach the ground b its speed decreased and it took more time to reach the ground c its speed increased and it took more time to reach the ground Module 3 Planning Parks Commercial playgrounds are big business and can cost schools up to 100 000 One of the most common playgrounds is the slide According to the CPSC Playground Safety Manual the target angle for fur and safety is between 30 45 degrees Dr Bookman chooses a 30 degree playground slide A 20 pound kindergartener plans to slide down the slide

Statistics
ProbabilityThe average speed of a pitch in women s college fastpitch softball is 61 5 mph with a standard deviation of 2 5 mph Assume that the pitches are normally distributed What is the probability that a randomly selected pitch is between 60 mph and 65 mph 0 194 0 645 0 356

Statistics
ProbabilityA dentist was making note of her upcoming appointments with different aged patients and the reasons for their visits Regular cleaning Broken tooth Toothache Patients under 18 Patients 19 60 2 3 6 2 5 4 What is the probability that a randomly selected appointment is for a broken tooth and is not with a patient under 18 Simplify any fractions

Statistics
ProbabilityThe age at which babies walk is normally distributed with a mean of 13 months with a standard deviation of 1 5 months Which age separates the youngest 7 5 that walked 9 4 months 14 months 10 8 months 14 9 months

Statistics
ProbabilitySolve for b 11 b 2 12 Write your answer as a fraction or as a whole or mixed number b

Statistics
Probability1 41 mogb33dn som non bobogans6 835 mmmbno bnbogasan 1 10 2 10000 3 41 42 Morbanan m honns dsan6 xy 3z 3

Statistics
ProbabilityThe magnitude of a vector d is 9 and its direction angle 8 is 11 Write the component form for d Round each component to the nearest hundredth d

Statistics
ProbabilityWrite the vector in component form 104 10 8 6 4 2 8 6 4 2 0 2 4 6 8 10 2 4 6 LO 8 X 10

Statistics
ProbabilityWhat is the area of this figure 11 yd 7 yd 6 yd 5 yd 9 yd 3 yd 15 yd 3 yd Write your answer using decimals if necessary square yards

Statistics
ProbabilityAssume random variable X follows a normal distribution with mean 50 and standard deviation of 10 a Use the Empirical rule to find P 40 X 60 Write as a probability not as a percentage 0 68 b Use the Empirical rule to find P 40 X 50 Write as a probability not as a percentage 0 34 c Use the Empirical rule to find P 30 X 50 Write as a probability not as a percentage d Use the Empirical rule to find P X 80 Write as a probability not as a percentage e Use the Empirical rule to find P 20 X 60 Write as a probability not as a percentage

Statistics
Probability22 The equivalent resistance of a complex circuit is usually determined by a inspection b simplifying the circuit into groups of series and parallel circuits c adding and subtracting individual resistances d dividing the sum of the individual resistances by the number of resistances

Statistics
ProbabilityD D A survey recently went out to 15 university presidents across a certain country The data represents the ages of the different presidents Use a stem and leat plot that has two rows for each stem to represent their ages 53 63 59 53 56 58 60 69 55 63 54 62 57 54 71 Determine the leaves in the stem and leaf plot shown at the right Use ascending order Which of the following best summarizes what the stem and leaf plot tells you about the data OA The plot shows that most university presidents have ages that range from 65 to 75 years old OB The plot shows that most university presidents have ages that range from 50 to 65 years old OC The plot shows that the age of the university presidents cluster around age 60 OD The plot shows that there is an equal amount of university presidents under the age of 60 as there is above the age of 60 GOLD Stems 5 5 8 Leaves

Statistics
Probabilityemale ale otal reach each level of attainment The National Center for Educational Statistics provides projections for the number of de grees earned classified by level and by the sex of the degree recipient Here are the projected number of earned degrees in thousands in the United States for the 2019 2020 academic year 7 Associate s Bachelor s Master s Doctorate Total 756 1143 589 99 2587 519 792 349 98 1758 1275 1935 938 197 4345 a If you choose a degree recipient at random what is the probability that the person you choose is a man b What is the conditional probability that you choose a man given that the person chosen received a master s

Statistics
Probability5 Lost Internet Sites Internet sites often vanish or move so that references to them can t be followed In fact 13 of Internet sites referenced in major scientific journals are lost within two years after publication If a paper contains seven Internet references what is the probability that all seven are still good two years later What specific assumptions did you make to calculate this probability

Statistics
Probability49 Winning at tennis A player serving in tennis has two chances to get a serve into play If the first serve is out the player serves again If the second serve is also out the player loses the point Here are probabilities based on four years of the Wimbledon Championship 20 P 1st serve in 0 59 P win point 1st serve in 0 73 P 2nd serve in 1st serve out 0 86 P win point 1st serve out and 2nd serve in 0 59 Make a tree diagram for the results of the two serves and the outcome win or lose of the point The branches in your tree have different numbers of stages depending on the outcome of the first serve What is the probabil

Statistics
Probability3 1 Photo and Video Sharing Photos and videos have become an important part of the online social experience with more than half of Internet users post ing photos or videos online that they have taken themselves Let A be the event an Internet user posts photos that he or she has personally taken and B be the event an Internet user posts videos that he or she has personally taken Pew Research Center finds that P A 0 52 P B 0 26 and P A or B 0 54 a Make a Venn diagram similar to Figure 13 4 showing the events A and B A and not B B and not A and neither A nor B b Describe each of these events in words c Find the probabilities of all four events and add the probabilities to your Venn diagram The four probabilities you have found should add to 1

Statistics
Probability3 9 At the Gym Suppose that 8 of adults belong to health clubs and 45 of these health club members go to the club at least twice a week What percent of all adults go to a health club at least twice a week Write the information given in terms of probabilities and use the general multiplication rule

Statistics
Probability29 Universal blood donors People with type O negative blood are referred to as universal donors although if you give type O negative blood to any patient you run the risk of a transfusion reaction due to certain antibodies present in the blood However any patient can receive a transfusion of O negative red blood cells Only 7 2 of the American population have O negative blood If 10 people appear at random to give blood what is the prob ability that at least one of them is a universal donor

Statistics
Probability8 15 False Negative Rate In a diagnostic test for a particular disease the condi tional probability that a person has the disease given that the test is negative is called the false negative rate Suppose the PSA screening test with the prop erties described in Example 13 14 is used to screen for prostate cancer in the population of men over 50 for which 6 3 have prostate cancer Compute the false negative rate using Bayes rule
Statistics
ProbabilityDetermine the probability of the given complementary event What is the probability that a 59 free throw shooter will miss her next free throw The probability that a 59 freethrow shooter will miss her next free throw is Type an integer or a decimal

Statistics
ProbabilityAssume that 700 births are randomly selected and 360 of the births are girls Use subjective judgment to describe the number of girls as significantly high significantly low or neither significantly low nor significantly high Choose the correct answer below OA The number of girls is neither significantly low nor significantly high OB The number of girls is significantly low OC The number of girls is significantly high OD It is impossible to make a judgment with the given information

Statistics
ProbabilityProblem 3 Exponential distribution example A tech support center averages a new call every 1 2 minutes In the probability distribution below the x axis indicates the number of minutes until the next phone call Exponential Distribution 1 4 1 2 1 0 8 0 6 0 4 0 2 0 0 0 5 1 1 5 2 2 5 3 a 6 5 0 02 0 13 I b What is the probability that the next call will come in less than 0 5 minutes a Insert your answer here 3 5 a What is the probability that the next call will come in between 1 and 1 5 minutes Estimate this probability using the graph It may be helpful to begin by noting the size of each small rectangle is 0 2 by 0 1 0 02 c What is the probability that the next call will be between 0 5 and 1 minutes a Insert your answer here 4 d What is the probability that the next call will come in more than 3 minutes Would this be considered a rare event or a not so rare event

Statistics
ProbabilityMAKE SURE YOU USE CORRECT NOTATIONS 1 4 0 5 1 5 2 Consider the following sample data set X 22 23 24 25 26 f early systematically and understandably 4 6 9 11 8 a Find the mode b Find the median c Find the mean by extending the table above and then show your computation below

Statistics
Probability10 8 6 4 Linear function Quadratic Function None of these Exponential Function 14 12 ON 10 8 16 4 2 2 40 16 ob 8 10 0 X 8 10

Statistics
ProbabilityA sign on the pumps at a gas station encourages customers to have their oil checked and claims that one out of 7 cars needs to have oil added If this is true what is the probability of each of the following A One out of the next four cars needs oil Probability B Two out of the next eight cars needs oil Probability C 10 out of the next 40 cars needs oil Probability

Statistics
ProbabilityIn the United States voters who are neither Democrat nor Republican are called Independent It is believed that 13 of voters are Independent A survey asked 38 people to identify themselves as Democrat Republican or Independent A What is the probability that none of the people are Independent Probability B What is the probability that fewer than 7 are Independent Probability C What is the probability that more than 2 people are Independent Probability

Statistics
ProbabilitySam is applying for a single year life insurance policy worth 45 400 00 If the actuarial tables determine that she will survive the next year with probability 0 991 what is her expected value for the life insurance policy if the premium is 352 00 Note Include dollar signs in your answer

Statistics
ProbabilityFind the expected value for the random variable E X 0 X 2 P X 0 23 4 5 7 0 19 0 1 0 48

Statistics
ProbabilityA firm has classified its customers in two ways according to whether the account is overdue and whether the account is new less than 12 months or old An analysis of the firm s records provided the input for the following table of joint probabilities One account is selected at random A If the account is overdue what is the probability that it is new B If the account is new what is the probability that it is overdue Overdue Not overdue 0 03 New Old 0 51 0 15 0 31