Probability Questions and Answers
Statistics
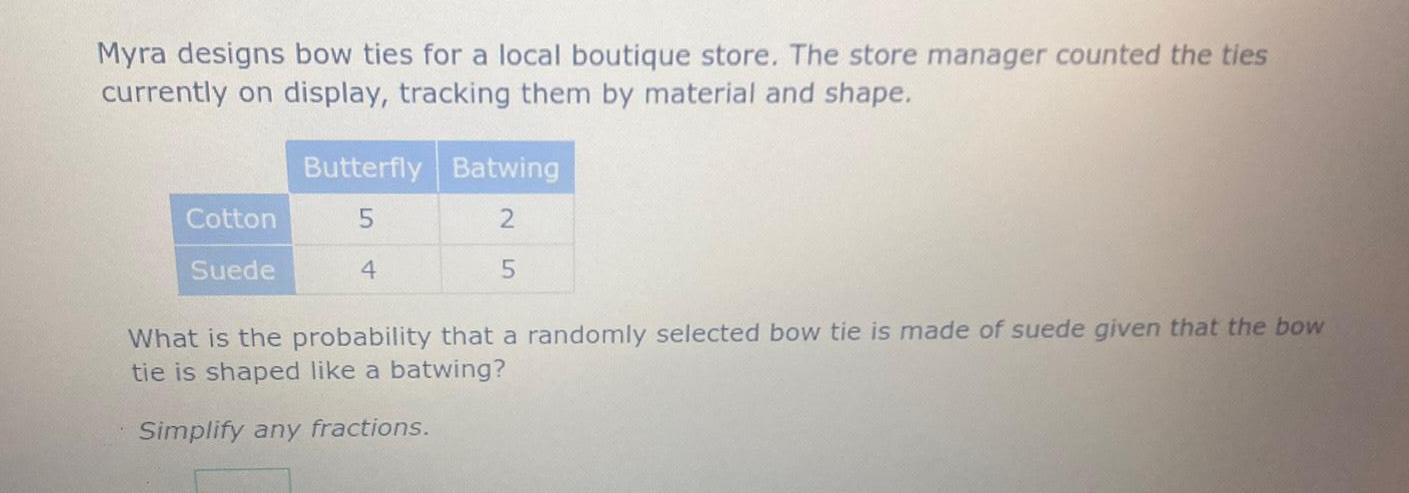
ProbabilityMyra designs bow ties for a local boutique store The store manager counted the ties currently on display tracking them by material and shape Cotton Suede Butterfly Batwing 5 2 5 4 What is the probability that a randomly selected bow tie is made of suede given that the bow tie is shaped like a batwing Simplify any fractions

Statistics
ProbabilityBruce attended a music store s banjo sale He counted the types of banjos and made note of their discounts 4 strings 5 strings 25 off 50 off 6 6 4 What is the probability that a randomly selected banjo has 5 strings given that the banjo is 50 off Simplify any fractions Vic

Statistics
ProbabilityA sample of 30 dentists from Seattle is taken to estimate the median income of all Seattle residents Is this study A REPRESENTATIVE O B NON REPRESENTATIVE A simple random sample of men over age 18 is taken to estimate the mean weight of all adult males Is this study A REPRESENTATIVE B NON REPRESENTATIVE A telephone survey is conducted during the day in order to determine the chances of a certain candidate winning an election Is this study OA REPRESENTATIVE B NON REPRESENTATIVE A simple random sample of 40 U S citizens is taken in order to estimate the mean cholesterol level of U S citizens Is this study O A REPRESENTATIVE B NON REPRESENTATIVE

Statistics
Probabilitymanatee deatns from powerboat collisions in Florida Yea r 2007 2008 2009 2010 2011 2012 2013 2014 2015 2016 Manatee deaths from powerboat collisions 100 80 60 40 20 Powerboa Deat ts hs 400 1027 1010 982 942 922 902 897 900 916 931 73 90 97 83 87 81 73 69 86 104 In 1997 there were 755 000 powerboats registered and 54 manatee deaths 1000 600 800 Powerboats registered x1000 Side by Side Macmillan Learning Now imagine that Florida took a drastic measure and limited the number of powerboat registrations to 200 000 per year Use the exact prediction equation found for this question y 46 75 0 1358x to predict the number of manatee deaths by powerboat in this condition Enter your answer rounded to two decimal places manatee deaths This equation should not be used to predict the number of manatee deaths by powerboat in this condition because it is and make sense because it is negative

Statistics
ProbabilityExecutives at a health insurance company want to know the percent of residents in a state who have health insurance Based on data from other states they estimate that p 0 7 They are aiming for a 99 confidence interval and a margin of error of 1 7 What sample size n should they use Round to the nearest whole number as needed Enter the correct value in the box n Show Hints

Statistics
Probabilitya Using the classical interpretation of probability what is the chance the student will pass the exam b Using a simulation approach approximate the chance the student will pass the exam Hint Generate at least 10 000 sets of 25 single digit numbers Each num ber represents the answer to one of the questions with even numbers recorded as a true answer and odd numbers recorded as a false answer Determine the relative frequency of 17 or more correct answers in the 25 questions

Statistics
Probability4 10 A die is rolled two times Provide a list of the possible outcomes of the two rolls in this form the result from the first roll and the result from the second roll 4 11 Refer to Exercise 4 10 Assume that the die is a fair die that is each of the outcomes has a probability of 1 36 What is the probability of observing a Event A Exactly one dot appears on each of the two upturned faces b Event B The sum of the dots on the two upturned faces is exactly 4 c Event C The sum of the dots on the two upturned faces is at most 4

Statistics
ProbabilityAssume that in 2003 consumers used credit and debit cards to pay for 38 of all purchases This percentag projected to be 58 in 2011 a Find a linear function that models the data where x is the year and P x is the percentage b Estimate when this percentage was between 43 and 53 Points 0 of 1 a P x Simplify your answer Use integers or decimals for any numbers in the expression of 25 points

Statistics
ProbabilitySuppose that a single die with 9 sides numbered 1 2 3 9 is rolled twice What is the probability that the sum of the two rolls equals 7 Answer

Statistics
ProbabilityA die is rolled Find the probability of the given event a The number showing is a 2 The probability is b The number showing is an even number The probability is c The number showing is greater than 4 The probability is

Statistics
ProbabilityAngela has 5 fish When she feeds them she collects data on which fish eats first Look at her data Which Fish Eats First Fish will Goldie Marlin Nemo Dory Flounder Number of Times h 9 5 2 3 Based on Angela s data what is the probability that Nemo 6

Statistics
ProbabilityThe answer above is NOT correct Suppose that a single die with 23 sides numbered 1 2 3 23 is rolled once What is the probability of getting an even number Answer 1 91

Statistics
ProbabilityThanks to social media the happiest creature on earth an always smiling Australian marsupial called a quokka has become well known Suppose that weights of quokkas can be described by a Normal model with a mean of 6 pounds and a standard deviation of 1 7 pounds a How many standard deviations from the mean would a quokka weighing 8 pounds be b Which would be more unusual a quokka weighing 8 pounds or one weighing 10 pounds a A quokka weighing 8 pounds is standard deviation s below the mean Round to two decimal places as needed b A quokka weighing 10 pounds is standard deviation s the mean weight Round to two decimal places as needed the mean The quokka weighing pounds is more unusual because its weight is a number of standard deviations from

Statistics
Probability18 Identify the following variables as either Quantitative QN or Qualitative QL a The brands of ice cream that you might purchase b The daily high temperature for the last 4 weeks c The amount of sugar consumed by Americans each year d The species of fish in Golden Lake e The lengths of time children wait for the school bus f Your favorite NFL team such as the Las Vegas Raiders 19 A math teacher would like to present the midterm results to his class in a way that shows the overall spread of the data The 25 test scores for the math midterm are listed below Construct a graph of your choice use an appropriate heading for the graph and interpret the data set 62 50 98 89 57 79 80 68 65 78 45 78 73 70 73 91 61 72 62 64 50 77 69 82 95

Statistics
Probabilitybe If the manager of a grocery store wishes to display the sales trend the most effective type of graph wil a A bar chart b A pie chart The range of a set of data is a measure of the a Center b Variability c A histogram d A line chart c Middle value d Population

Statistics
ProbabilityActivity A B C D E F G H 1 Predecessor s A A A B C D E E F G H Figure 7 6 Network Scheduling Data Duration days 5 20 15 in 5 60 050 15 20 15 2 Consider the network scheduling data presented in Figure 7 6 How many days of slack are associated with activity E a 0 b 107

Statistics
ProbabilityThe roundworm Caenorhabditis elegans is a widely studied animal model in part because of its small number of neurons and easily manipulated genome Nociception is the neural perception of an actually or potentially harmful stimulus In C elegans it evokes a self preserving withdrawal behavior However repeated stimulation can result in reduced withdrawal response or habituation Researchers compared the withdrawal response to disturbing light stimuli in wild type C elegans and a mutant C elegans line that exhibits a slower response of sensory neurons PVD The given scatterplot shows the data of the percent of animals tested that exhibited a withdrawal reaction to a noxious stimulus consisting of varying numbers of consecutive light pulses Failure to react indicates habituation Circles represent wild type C elegans and squares represent the mutant line Percent of animals reacting 100 60 40 20 Wild type Mutant 10 15 Number of light pulses 20 1 S J Husson et al Optogenetic analysis of a nociceptor neutron and network reveals ion channels acting downstream of primary sensors Current Biology 22 2012 pp 743 753 doi 10 1016 j cub 2012 02 066 Macmillan Learning What does the scatterplot show about the pattern of withdrawal responses in wild type C elegans for increasing numbers of light pulses How does your answer fit in the context of habituation What does the scatterplot show about the pattern of withdrawal responses in wild type C elegans for increasing numbers of light pulses How does your answer fit in the context of habituation O The negative linear association in the wild type C elegans does not indicate habituation The response to the harmful stimulus is more pronounced when the stimulus is applied more times The negative linear association in the wild type C elegans does not indicate habituation The response to the harmful stimulus is less pronounced when the stimulus is applied more times O The negative linear association in the wild type C elegans indicates habituation The response to the harmful stimulus is more pronounced when the stimulus is applied more times The negative linear association in the wild type C elegans indicates habituation The response to the harmful stimulus is less pronounced when the stimulus is applied more times

Statistics
ProbabilityA recent poll was taken from SJSU college students asking their political affiliation either Republican R Democrat Independent I The following responses are from a sample of 40 SJSU students R 1 D D D D R K R DI R Political Affiliation IDD DR D D R R D D R RD D R Proportion D D D R R D Complete the frequency distribution table for these data Be sure your frequencies sum to 40 R Political Affiliation first column f second column proportion third column round to the 1 decimal place D

Statistics
ProbabilityCompanies who design furniture for elementary school classrooms produce a variety of sizes for kids of different ages Suppose the heights of kindergarten children can be described by a Normal model with a mean of 39 2 inches and standard deviation of 1 9inches a What fraction of kindergarten kids should the company expect to be less than 35 inches tall About of kindergarten kids are expected to be less than 35 inches tall Round to one decimal place as needed

Statistics
Probabilitya Draw and label the Normal model OA levels of women can be described by a Normal model with a mean of 188 mg dL and a standard deviation of 28 Complete parts a through e 10 174 211 230 60 Round to two decimal places as needed SON 997 104 32 160 188 215 241 272 b What percent of women do you expect to have cholesterol levels over 210 mg dL 00 20 95 26 22 100

Statistics
ProbabilityUse the Normal model N 100 16 describing IQ scores to answer the following a What percent of people s IQs are expected to be over 80 b What percent of people s IQs are expected to be under 90 c What percent of people s IQs are expected to be between 116 and 128 a Approximately of people s IQs are expected to be above 80 Round to one decimal place as needed

Statistics
Probability4 What is the median price for a snowboard at Middletown Snowboards 55 60 65 70 75 80 85 90 95 100 What is the median score 1 70 3 77 4 85

Statistics
Probability49 Learning online Many colleges offer online versions of courses that are also taught in the classroom It of ten happens that the students who enroll in the online version do better than the classroom students on the course exams This does not show that online instruc tion is more effective than classroom teaching because the people who sign up for online courses are often quite different from the classroom students Suggest some differences between online and classroom stu donts that might explain why online students do better

Statistics
Probability5 9 Does Fast Driving Waste Fuel Exercise 4 8 page 109 gives data on the fuel consumption y of a car at various speeds x Fuel consumption is measured in mpg and speed is measured in miles per hour Software tells us that the equa tion of the least squares regression line is FASTDR2 55 3286 0 02286x Using this equation we can add the residuals to the original data Speed Fuel Residual 10 20 38 1 54 0 17 0 87 80 30 40 50 60 70 68 4 63 6 60 5 55 4 50 6 13 76 9 19 6 31 1 44 3 13 9 70 43 8 a Make a scatterplot of the observations and draw the regression line on your plot b Would you use the regression line to predict y from x Explain your answer c Verify the value of the first residual for x 10 Verify that the residuals have sum zero up to roundoff error d Make a plot of the residuals against the values of x Draw a horizontal line at height zero on your plot How does the pattern of the residuals about this line compare with the pattern of the data points about the regression lina torplot from nort a
Statistics
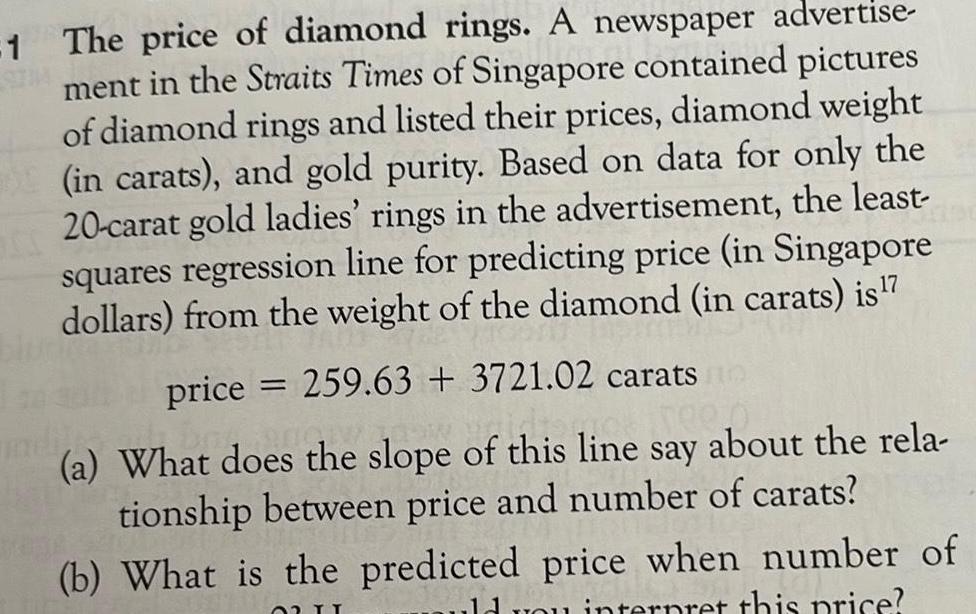
Probability1 The price of diamond rings A newspaper advertise ment in the Straits Times of Singapore contained pictures of diamond rings and listed their prices diamond weight in carats and gold purity Based on data for only the 20 carat gold ladies rings in the advertisement the least squares regression line for predicting price in Singapore dollars from the weight of the diamond in carats is 7 TRIS price 259 63 3721 02 carats a What does the slope of this line say about the rela tionship between price and number of carats b What is the predicted price when number of you interpret this price 02 II

Statistics
ProbabilityThe following linear regresion equation represents 18 brown trout caught in a local river The fish were measured inches and weighed ounces before they were released back into the river Weight 2 28 1 20Length Use the equation to predict the weight of a brown trout that is 13 inches in length Do not round

Statistics
ProbabilityA business owner randomly selected 15 days from the last quarter of the most recent year They investigated the number of employees that reported to work that day and the number of products that the employees produced The scatterplot is below How many products were produced on the day that 8 employees reported to work Number of Products 1600 1400 1200 1000 800 10 12 Number of Employees 14 16 18

Statistics
ProbabilityThe histogram below shows the time spent on a Saturday by visitors to a museum browsing an exhibit There were 300 visitors that day The number of visitors that spent less than 25 minutes at the museum that day is closest to Frequency 60 55 50 LL DS 15 25 35 45 55 65 75 85 95 105115125135145155 Time minutes O A 25 OB 80 O C 60 O D 40

Statistics
ProbabilityEnteroliths are calcifications that form in the gut of a horse The stones can cause considerable morbidity and mortality A study was conducted to investigate factors such as diet and environment that may be related to the formation of enteroliths The study contained 62 horses with enteroliths cases and 75 horses without controls The graph below contains side by side boxplots of the ages for cases and controls Based on the poxplots the mean age for cases 30 25 20 15 10 S case enteroliths control no enteroliths Panel variable Diagnosis Box plot of age by diagnosis case control

Statistics
ProbabilityIvan is participating in a 6 day cross country biking challenge He biked for 70 67 67 62 and 49 miles on the first five days How many miles does he need to bike on the last day so that his average mean is 64 miles per day miles X

Statistics
ProbabilityThe following diagram represents a process where two components are made at stations A1 and A2 one component is made at A1 and the other at A2 These components are then assembled at station B and moved through the rest of the process where some additional work is completed at stations C D and E Assume that one and only one person is allowed at each station Assume that the times given for each station represent the amount of work that needs to be done at that station by that person with no processing time variation Assume that inventory is not allowed to build in the system A1 0 30 min A2 0 40 min B 0 70 min D 0 65 min 0 60 min Average hourly output E 0 55 min What is the average hourly output of the process when it is in normal operation Round your answer to the nearest whole number units

Statistics
ProbabilitySuppose Joan has a fair four sided die with sides that are numbered 1 2 3 and 4 A 07 B C D 12 After she rolls it 33 times Joan finds that she s rolled the number 4 a total of seven times What is the empirical probability that Joan rolls a 4 33 25 21 21 Select one answer 10 points t

Statistics
ProbabilityA club is choosing 2 members to serve on a committee The club has nominated 2 women and 2 Type numbers in the boxes 10 points men Based on chance alone what is the probability no women are chosen to be on the committee Your answer should be rounded to 4 decimal places where applicable

Statistics
ProbabilitySelect one answer 10 points A 2000 study analyzed data from the National Longitudinal Study of Adolescent Health Participants were followed into adulthood Each study participant was categorized as to whether they were obese BMI 30 or not and whether they were dating cohabiting or married The researchers were trying to determine the effect of relationship status on obesity The table below summarizes the results Obese Not obese Total Dating Cohabiting Married Total 359 440 103 326 429 147 277 962 424 1 293 In this example which of the following would it be appropriate to calculate A Conditional row percentages B Conditional column percentages The correlation coefficient r D The five number summary of both variables

Statistics
ProbabilityA couple decides to have three children Let A define the event that the couple has at least 1 girl 10 points What are the possible outcomes for this event G girl B boy G BG BBG G GG GGG BBB BBG BGB GBB GGB GBG BGG GGG GGG GGB GBG BGG GBB BGB BBG Select one answer A B C D E GBB BGB BBG
Statistics
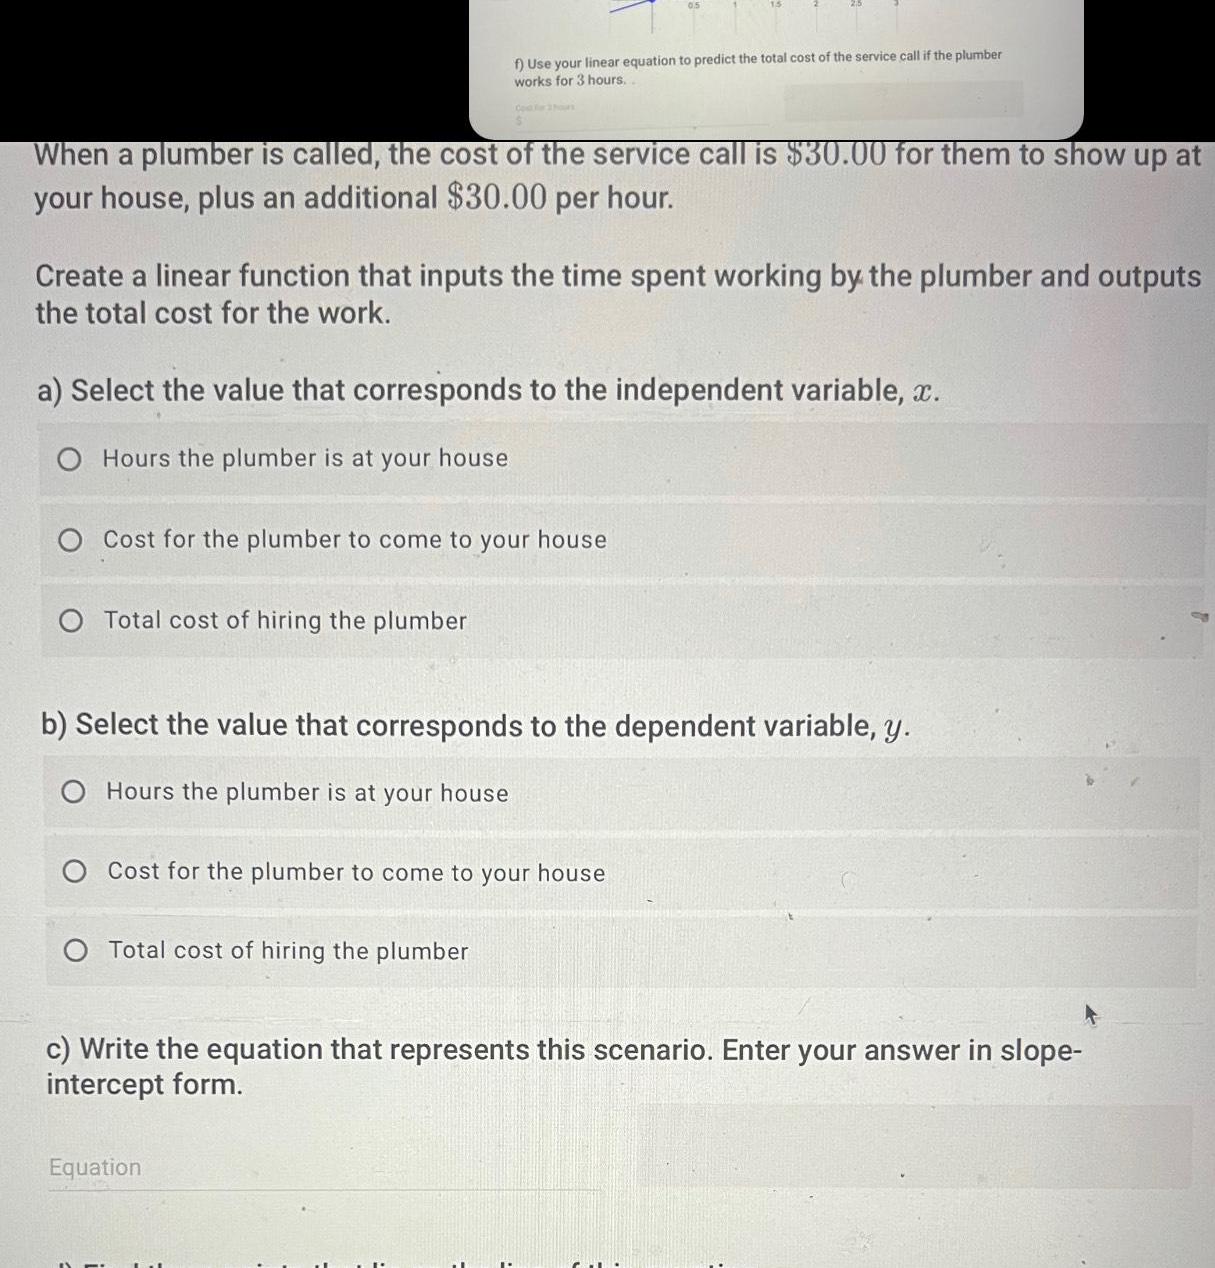
ProbabilityWhen a plumber is called the cost of the service call is 30 00 for them to show up at your house plus an additional 30 00 per hour Create a linear function that inputs the time spent working by the plumber and outputs the total cost for the work f Use your linear equation to predict the total cost of the service call if the plumber works for 3 hours a Select the value that corresponds to the independent variable x O Hours the plumber is at your house Cost for the plumber to come to your house Total cost of hiring the plumber b Select the value that corresponds to the dependent variable y O Hours the plumber is at your house O Cost for the plumber to come to your house Total cost of hiring the plumber c Write the equation that represents this scenario Enter your answer in slope intercept form Equation

Statistics
ProbabilityThere are 710 identical plastic chips numbered 1 through 710 in a box What is the probability of reaching into the box and randomly drawing the chip numbered 568 Express your answer as a simplified fraction or a decimal rounded to four decimal places Answer How to enter your answer opens in new window 2 Points Keypad Keyboard Shortcuts

Statistics
ProbabilityUse the following information to answer the next two exercises Suppose 111 people who shopped in a special T shirt store were asked the number of T shirts they own costing more than 19 each Relative frequency 40 111 30 111 20 111 10 111 0 5 111 17 111 23 111 39 111 25 111 2 111 1 2 3 4 5 6 7 Number of T shirts costing more than 19 each 83 The percentage of people who own at most three T shirts costing more than 19 each is approximately a 21 b 59 c 41 d cannot be determined

Statistics
Probability130037 d A smaller sample of 15 students yielded the following data 5 4 7 6 8 1 6 6 5 3 8 10 10 19 50 Use a class interval of 1 to calculate the mean range and standard deviation and compare to values of the large sample How much do the extreme scores affect the larger sample compared to the smaller sample

Statistics
ProbabilityThe distribution of the amount of money spent by students on textbooks in a semester is approximately normal in shape with a mean of 374 and a standard deviation of 32 According to the standard deviation rule almost 2 5 of the students spent more than what amount of money on textbooks in a semester Your Answer

Statistics
ProbabilityA veggie wrap at City Subs is composed of 4 different vegetables and 2 different condiments wrapped up in a tortilla If there are 7 vegetables 5 condiments and 6 types of tortilla available how many different veggie wraps can be made Answer How to enter your answer opens in new window Tables Keypad Keyboard Shortcut

Statistics
ProbabilityBen wants to buy a new collar for each of his 5 dogs The collars come in a choice of 9 different colors Step 1 of 2 How many selections of collars for the 5 dogs are possible if repetitions of colors are allowed Answer How to enter your answer opens in new window

Statistics
ProbabilityGarcia s Grill offers 8 side dishes 3 types of steak and 7 toppings How many different smothered steak dinners can be made if a smothered steak dinner consists of the customer s choice of steak served with 2 different toppings and 4 different side dishes Answer How to enter your answer opens in new window Tables Kavho E Keypad tout

Statistics
ProbabilityAn urn contains 10 red marbles 28 blue marbles and 29 yellow marbles One marble is to be chosen from the urn without looking What is the probability of choosing a red marble Your answer should be to rounded to 4 decimal places

Statistics
ProbabilityConsider the following X 22 50 69 100 106 Y 213 224 176 129 102 1 What is the slope of the regression line predicting Y from X rounded to 2 decimal

Statistics
Probability4 29 Of a finance company s loans 1 are defaulted not completely repaid The company routinely runs credit checks on all loan applicants It finds that 30 of defaulted loans went to poor risks 40 to fair risks and 30 to good risks Of the nondefaulted loans 10 went to poor risks 40 to fair risks and 50 to good risks Use Bayes Formula to calculate the probability that a poor risk loan will be defaulted
Statistics
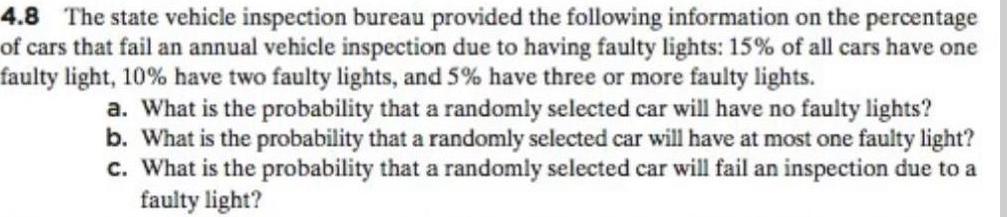
Probability4 8 The state vehicle inspection bureau provided the following information on the percentage of cars that fail an annual vehicle inspection due to having faulty lights 15 of all cars have one faulty light 10 have two faulty lights and 5 have three or more faulty lights a What is the probability that a randomly selected car will have no faulty lights b What is the probability that a randomly selected car will have at most one faulty light c What is the probability that a randomly selected car will fail an inspection due to a faulty light

Statistics
Probability10 points When buying a home the interest rate given on a loan typically depends on the applicant s credit score The Fair Isaac Corporation FICO is a major producer of credit scores The following table contains 10 randomly selected loan applicants along with their FICO scores and the interest they were given when financing their homes 3 A O 0 0144 B O 0 9642 C 0 9819 4 6 7 FICO Score Interest Rate 0 756 679 5 677 527 839 686 512 590 9 765 10 502 6 32 7 85 10 2 5 52 7 3 7 37 9 67 8 4 5 82 10 01 The linear correlation coefficient between FICO score and home loan interest rate is Select one ans

Statistics
ProbabilityThe data in the scatterplot below are an individual s weight and the time it takes in seconds on a treadmill to raise his or her pulse rate to 140 beats per minute The o s correspond to females and the s to males Which of the following conclusions is most accurate Time 165 155 145 135 125 115 90 O 00 O 100 110 120 130 140 xx O Weights 150 160 170 180 A O There is a positive correlation between time and weight for males and for females B O There is a negative correlation between gender and weight C O There is a positive correlation between gender and weight D There is a negative correlation between time and weight for males and for females 0 F M Select one answer 10 points

Statistics
ProbabilityWhat can we say about the relationship between the correlation r and the slope b of the least squares line for the same set of data A O The slope b is always equal to the square of the correlation r B Or and b have the same sign or C Or is always larger than b D Ob is always larger than r E O Both r and b always have values between 1 and 1 Select one answer 10 points