Probability Questions and Answers
Statistics
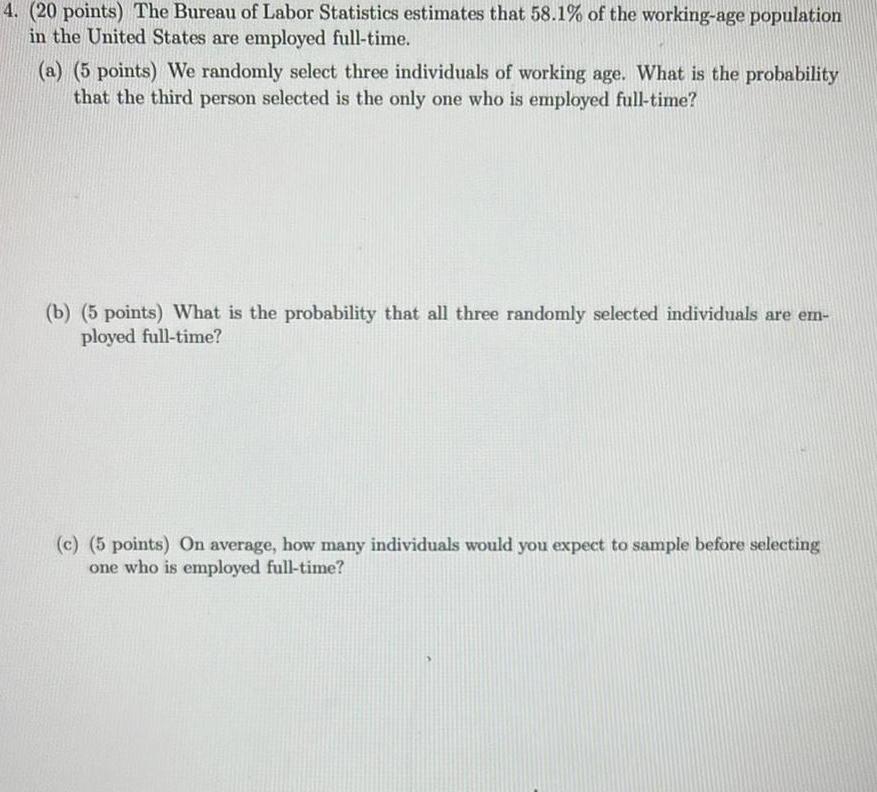
Probability4 20 points The Bureau of Labor Statistics estimates that 58 1 of the working age population in the United States are employed full time a 5 points We randomly select three individuals of working age What is the probability that the third person selected is the only one who is employed full time b 5 points What is the probability that all three randomly selected individuals are em ployed full time c 5 points On average how many individuals would you expect to sample before selecting one who is employed full time
Statistics
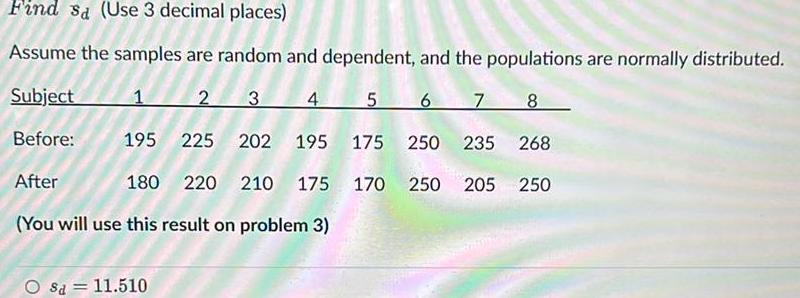
ProbabilityFind sa Use 3 decimal places Assume the samples are random and dependent and the populations are normally distributed Subject 1 2 3 4 5 6 7 8 Before 195 225 202 195 175 250 235 268 After 180 220 210 175 170 250 205 250 You will use this result on problem 3 Sa 11 510
Statistics
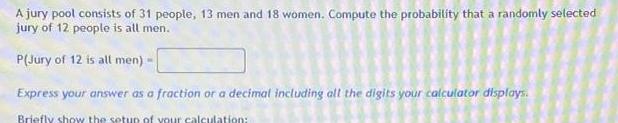
ProbabilityA jury pool consists of 31 people 13 men and 18 women Compute the probability that a randomly selected jury of 12 people is all men P Jury of 12 is all men Express your answer as a fraction or a decimal including all the digits your calculator displays Briefly show the setup of your calculation
Statistics
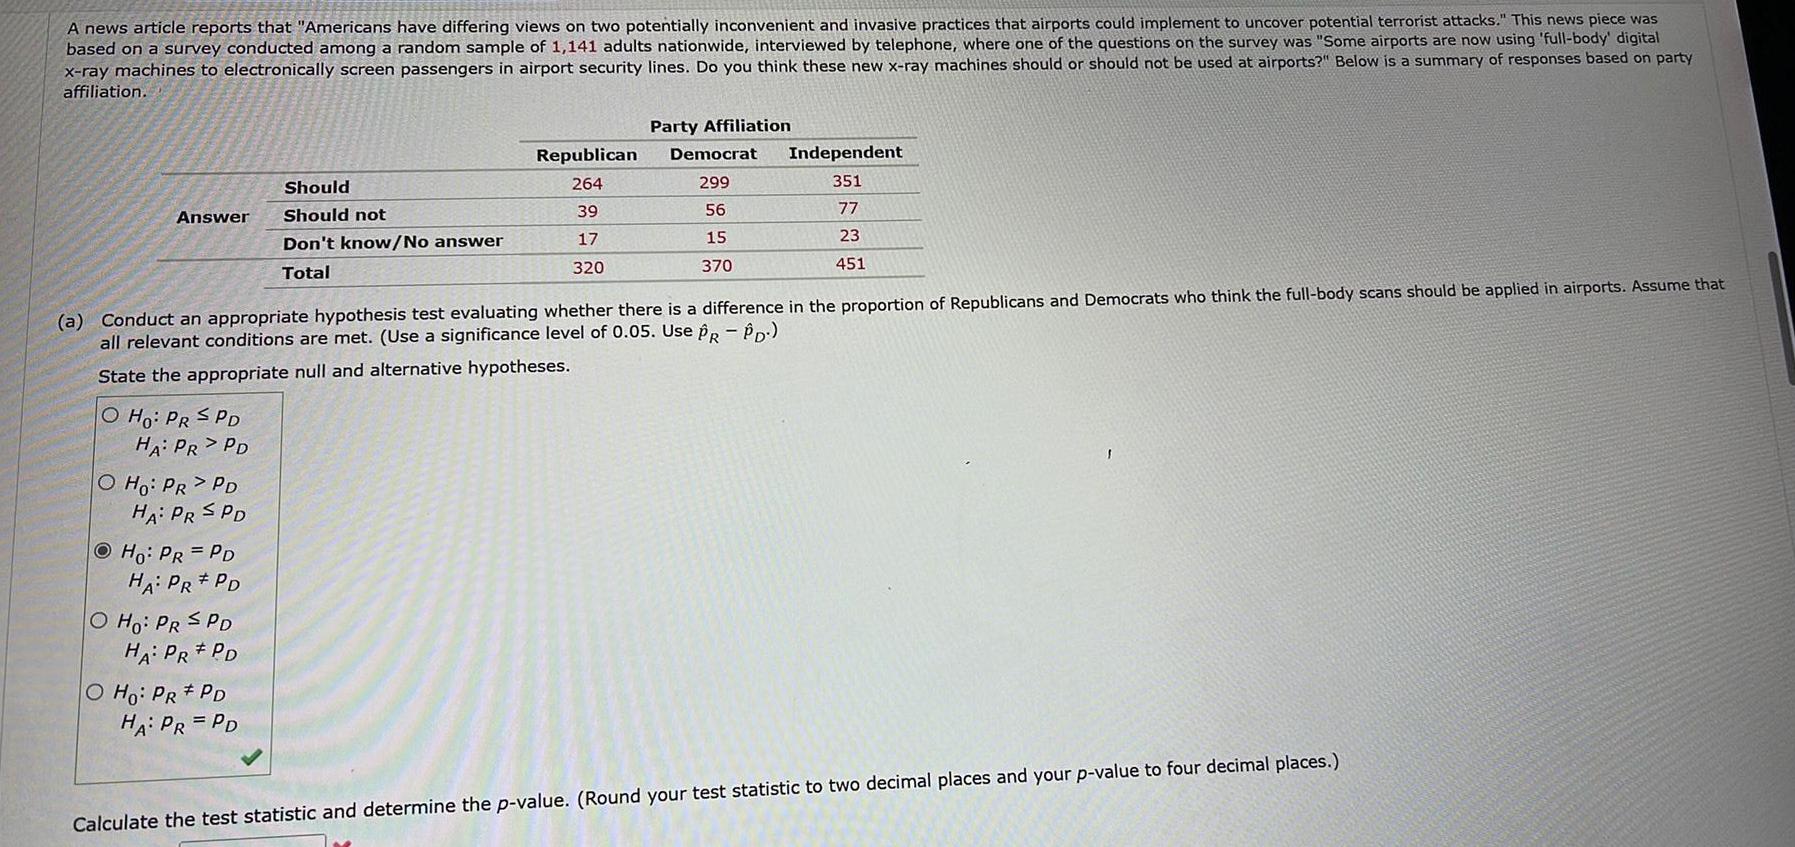
ProbabilityA news article reports that Americans have differing views on two potentially inconvenient and invasive practices that airports could implement to uncover potential terrorist attacks This news piece was based on a survey conducted among a random sample of 1 141 adults nationwide interviewed by telephone where one of the questions on the survey was Some airports are now using full body digital x ray machines to electronically screen passengers in airport security lines Do you think these new x ray machines should or should not be used at airports Below is a summary of responses based on party affiliation Answer O Ho PR SPD HA PR PD O Ho PR PD HA PR SPD Ho PR PD HA PR PD O Ho PR SPD HA PR PD Should Should not Don t know No answer Total O Ho PR PD HA PR PD Republican 264 39 17 320 a Conduct an appropriate hypothesis test evaluating whether there is a difference in the proportion of Republicans and Democrats who think the full body scans should be applied in airports Assume that all relevant conditions are met Use a significance level of 0 05 Use PR PD State the appropriate null and alternative hypotheses Party Affiliation Democrat 299 56 15 370 Independent 351 77 23 451 1 Calculate the test statistic and determine the p value Round your test statistic to two decimal places and your p value to four decimal places

Statistics
ProbabilityFunun 10 company Test the null hypothesis that the average number of years of service is the same for males and females Assume that the populistion variances are unequal b lest the null hypothesis that the average years of undergraduate study is the same for males and females Assume that the population variances are unequal Click the icon to view the survey data a Is there sufficient evidence at the 0 05 level of significance that the average number of years of service is the same for males and females Determine the null hypothesis He and the alternative hypothesis H Let females be population 1 and males be population 2 0 Survey data Hy H 0 Type integers or decimals Do not round Compute the test statistic Round to two decimal places as needed Gender Female Female Female Female Female Female Female Female Female Female Female Female Years of Service Years Undergraduate Study 2 2 16 4 9 22 7 9 9 10 16 m 4 4 4 2 0 Gender Male Male Maie Male Male Male Maler Male Male Male Male Male Years of Service Years Undergradu Study 10 252722252885 15 26 18 19 30 4 4 4 4 4 2 4 4

Statistics
Probabilityscience fair project Emily conducted an experiment in which she tested professional touch therapists to see if they could sense her energy field She flipped a coin to select either her right hand or her left hand and then she asked the therapists to identify the selected hand by placing their hand just under Emily s hand without seeing it and without touching it Among 354 trials the touch therapists were correct 167 times Complete parts a through d C a Given that Emily used a coin toss to select either her right hand or her left hand what proportion of correct responses would be expected if the touch therapists made random guesses 0 5 Type an integer or a decimal Do not round b Using Emily s sample results what is the best point estimate of the therapists success rate 0 472 Round to three decimal places as needed c Using Emily s sample results construct a 95 confidence interval estimate of the proportion of correct responses made by touch therapists p Round to three decimal places as needed

Statistics
Probabilitywho have heard of the brand How many adults must he survey in order to be 80 confident that his estimate is within eight percentage points of the true ager for a brand of toothpaste must plan a campaign designed to increase brand recognition He wants to first determine the percentage of aduits population percentage Complete parts a through c below CELE b Assume that a recent survey suggests that about 78 of adults have heard of the brand Points 0 67 of 1 n 44 Round up to the nearest integer c Given that the required sample size is relatively small could he simply survey the adults at the nearest college of 13 points OA No a sample of students at the nearest college is a cluster sample not a simple random sample so it is very possible that the results would not be representative of the population of adults OB Yes a sample of students at the nearest college is a simple random sample so the results should be representative of the population of adults O C No a sample of students at the nearest college is a stratified sample not a simple random sample so it is very possible that the results would not be representative of the population of adults Save O D No a sample of students at the nearest college is a convenience sample not a simple random sample so it is very possible that the results would not be representative of the population of adults

Statistics
Probabilitynergy In a science fair project Emily conducted an experiment in which she tested professional touch therapists to see if they could sense net select either her right hand or her left hand and then she asked the therapists to identify the selected hand by placing their hand just under Emily s hand without seeing it a without touching it Among 284 trials the touch therapists were correct 137 times Complete parts a through d a Given that Emily used a coin toss to select either her right hand or her left hand what proportion of correct responses would be expected if the touch therapists made random guesses 0 5 Type an integer or a decimal Do not round b Using Emily s sample results what is the best point estimate of the therapists success rate 0 482 Round to three decimal places as needed c Using Emily s sample results construct a 90 confidence intervalestimate of the proportion of correct responses made by touch therapists p Round to three decimal places as needed
Statistics
ProbabilityAccording to an almanac 70 of adult smokers started smoking before turning 18 years old a If 100 adult smokers are randomly selected how many would we expect to have started smoking before turning 18 years old b Would it be unusual to observe 85 smokers who started smoking before turning 18 years old in a random sample of 100 adult smokers Why a We would expect about adult smokers to have started smoking before turning 18 years old Type a whole number b Would it be unusual to observe 85 smokers who started smoking before turning 18 years old in a random sample of 100 adult smokers OA Yes because 85 is between 20 and 2o OB No because 85 is greater than 20 OC No because 85 is between 2o and 2o O D Yes because 85 is greater than 2o OE No because 85 is less than 2o


Statistics
ProbabilityThe given data represents a frequency distribution of the F scale intensities of recent tornadoes Use the frequency distribution to construct a frequency polygon Does the graph suggest that the distribution is skewed If so how Construct a frequency polygon using the data Choose the correct graph below OA 30 Frequency F Scale 5 Q OB Frequency 307 F Scale Q O C Tornado F Scale Frequency F Scale Does the graph suggest that the distribution is skewed If so how OA The distribution appears to be skewed to the right or positively skewed OB The distribution does not appear to be skewed O C The distribution appears to be skewed to the left or negatively skewed OD The distribution appears to be skewed to both sides 0 1 2 3 4 O D Frequency O 24 Frequency 27212 F Scale Q Q

Statistics
Probabilityd the area of the shaded region The graph to the right depicts IQ scores of adults and those scores are normally distributed with a mean of 100 and a standard deviation of 15 k10 view page 1 of the table Click to view page 2 of the table dard Normal Table Page 2 Standard Normal 2 Distribution Cumulative Area from the LEFT 00 5000 5318 KTP9 4554 6916 COPEN 7530 2001 8159 849 5032 9102 9332 9452 9554 9641 9713 9772 9861 0891 9918 9938 9953 01 5040 5438 5832 6217 6591 6950 7291 7611 7910 4106 8438 8665 8869 9049 9207 9345 9463 9564 9649 9719 9778 9826 9864 9896 9920 9940 9955 02 5080 5478 5871 6255 6628 6985 7324 7939 8212 8461 8686 8888 9066 9222 9357 9474 9573 9656 9726 9783 9830 9868 9898 9922 9941 9956 POSITIVE z Scores 03 5120 5517 5910 6293 6664 2019 7357 7673 7967 8238 8485 8708 8907 9082 9236 9370 9484 9582 9664 9732 9788 9834 9871 9901 9925 9943 9957 04 5160 5557 5948 6331 6700 7054 7389 7704 7995 8264 8508 8729 8925 9099 9251 9382 9495 9591 9671 9738 9793 9838 9875 9904 9927 9945 9959 05 5199 5596 5987 6368 6736 7088 7422 7734 8023 8289 8531 8749 8944 9115 9265 9394 9505 9599 9678 9744 9798 9842 9878 9906 9929 9946 9960 06 5239 5636 6026 6406 6772 7123 7454 7764 8051 8315 8554 8770 8962 9131 9279 9406 9515 9608 9686 9750 9803 9846 9881 9909 9931 9948 9961 07 5279 5675 6064 6443 6808 7157 7486 7794 8078 8340 8577 8790 8980 9147 9292 9418 9525 9616 9693 9756 9808 9850 9884 9911 9932 08 5073 5319 5714 6103 6480 6844 7190 9761 9812 9854 9887 9913 9934 9949 9951 99629963 7517 7823 8106 8365 8599 6810 8997 9162 9306 9429 9535 9625 9699 5077 09 5359 5753 6141 6517 6879 7224 7549 7852 8133 8389 8621 6830 9015 9177 9319 9441 9545 9633 9706 9767 9817 9857 9890 9916 9936 9952 9964 9974 X Standard Normal Table Page 1 NEGATIVE Z Scores 2 3 50 and lower 34 33 32 31 3 0 2 9 2 8 2 7 26 2 5 24 23 2 2 21 20 19 1 8 17 1 6 15 1 4 13 12 11 10 0 9 0 8 0 7 Standard Normal 2 Distribution Cumulative Area from the LEFT 00 0001 0003 0005 0007 0010 0013 0019 0026 0035 0047 0062 0082 0107 0139 0179 0228 0287 0359 0446 0548 0668 0808 0968 1151 1357 1587 1841 2119 2420 01 0003 0005 0007 0009 0013 0018 0025 0034 0045 0060 0080 0104 0136 0174 0222 0281 0351 0436 0537 0655 0793 0951 1131 1335 1562 1814 2090 2389 02 0003 0005 0006 0009 0013 0018 0024 0033 0044 0059 0078 0102 0132 0170 0217 0274 0344 0427 0526 0643 0778 0934 1112 1314 1539 1788 2061 2358 03 0003 0004 0006 0009 0012 0017 0023 0032 0043 0057 0075 0099 0129 0166 0212 0268 0336 0418 0516 0630 0764 0918 1093 1292 1515 1762 2033 2327 04 0003 0004 0006 0008 0012 0016 0023 0031 0041 0055 0073 0096 0125 0162 0207 0262 0329 0409 0505 0618 0749 0901 1075 1271 1492 1736 2005 2296 05 0003 0004 0006 0008 0011 0016 0022 0030 0040 0054 0071 0094 0122 0158 0202 0256 0322 0401 0495 0606 0735 0885 1056 1251 1469 1711 1977 2266 06 0003 0004 0006 0008 0011 0015 0021 0029 0039 0052 0069 0091 0119 0154 0197 0250 0314 0392 0485 0594 0721 0869 1038 1230 1446 1685 1949 2236 07 0003 0004 0005 0008 0011 0015 0021 0028 0038 0051 0037 0049 0068 A 0066 0087 0089 20116 0113 0150 0146 0192 0188 0244 0239 0301 0375 0465 0571 0694 0838 1003 3190 3401 1635 1894 2177 0307 0384 0475 0582 08 0708 0853 3020 1210 1423 1660 1922 2206 0003 0004 0005 0007 0010 0014 0020 0027 09 0002 0003 0005 0007 10010 0014 0019 0026 0036 0048 0064 0084 0110 0143 0183 0233 0294 0367 0455 0559 0681 0823 0985 3170 1379 1611 1867 2148 X mainin

Statistics
ProbabilityA recent campus poll found that 30 of all students at IRSC are history majors Determine the probability that 10 or 15 students out of a random sample of 21 students are history majors Use the Binomial probability formula or the binomial probability table if possible to solve 0 567 0 3987 0 0142 0413

Statistics
ProbabilityThe probability that a student is dual enrolled is 0 16 Suppose two students are chosen at random Determine the probability that the first student selected is dual enrolled and the second student selected is not dual enrolled Hint these two events are independent 0 7056 0 3888 O 0 1344 0256

Statistics
ProbabilityA recent poll found that 36 of all registered voters in Okeechobee County support a proposed new property tax Determine the probability that all people out of a random sample of 5 people support this proposed new property tax Use the Binomial probability formula or the binomial probability table if possible to solve 0 006 0 0754 00 1518 9698

Statistics
ProbabilityThe sum of the probabilities of all simple events of any experiment must always equal 00 OF Oo

Statistics
ProbabilityIn a group of 136 students 116 are freshmen If one student is selected at random the probability that this student is not a freshman is O 0 147 O 0 852 O 0 713 O 0 497

Statistics
ProbabilityIf a six sided die is rolled once the probability of obtaining a number greater than 1 is O 0 54 O 0 83 O 0 92 0 09

Statistics
ProbabilityQuestion 3 In an upcoming national swim competition 11 swimmers will be competing How many different ways can 2 swimmers finish the competition first and second 09 0110

Statistics
ProbabilityA random sample of 863 births in a state included 422 boys Construct a 95 confidence interval estimate of the proportion of boys in all births It is believed that among all births the proportion of boys is 0 508 Do these sample results provide strong evidence against that belief Construct a 95 confidence interval estimate of the proportion of boys in all births 0 456 p 0 522 Round to three decimal places as needed Do these sample results provide strong evidence against that belief OA There is strong evidence against 0 508 as the value of the proportion of boys in all births because 0 508 is contained within the 95 confidence interval OB There is not strong evidence against 0 508 as the value of the proportion of boys in all births because 0 508 is not contained within the 95 confidence interval OC There is not strong evidence against 0 508 as the value of the proportion of boys in all births because 0 508 is contained within the 95 confidence interval OD There is strong evidence against 0 508 as the value of the proportion of boys in all births because 0 508 is not contained within the 95 confidence interval

Statistics
Probabilitychere to view a t distribution table chere to view page 1 of the standard normal distribution table there to view page 2 of the standard normal distribution table is the confidence interval estimate of the population mean F d to three decimal places as needed Critical t values Critical t value negative Left tail Right tail Degrees of Freedom 1 2 3 4 5 6 7 8 9 10 11 12 13 14 15 16 17 18 19 20 21 22 t Distribution Critical t Values 0 005 0 01 63 657 9 925 5 841 4 604 4 032 3 707 3 499 3 355 3 250 3 169 3 106 3 055 3 012 2 977 2 947 2 921 2 898 2 878 2 861 2 845 2 831 2 819 0 01 0 02 31 821 6 965 4 541 3 747 3 365 3 143 2 998 2 896 2 821 2 764 2 718 2 681 2 650 2 624 2 602 2 583 2 567 2 552 2 539 2 528 2 518 2 508 Area in One Tail 0 025 Area in Two Tails 0 05 12 706 4 303 3 182 2 776 2 571 2 447 2 365 2 306 2 262 2 228 2 201 2 179 2 160 2 145 2 131 2 120 2 110 2 101 2 093 2 086 2 080 2 074 0 050 0 05 0 10 6 314 2 920 2 353 2 132 2 015 1 943 1 895 1 860 1 833 1 812 1 796 1 782 1 771 1 761 1 753 1 746 1 740 1 734 1 729 1 725 1 721 1 717 1 714 0 10 0 20 3 078 1 886 1 638 1 533 1 476 1 440 1 415 1 397 1 383 1 372 1 363 1 356 1 350 1 345 1 341 1 337 1 333 1 330 1 328 1 325 1 323 1 321 1 319 Degrees of Freedom 1 2 3 4 5 6 7 8 9 10 11 12 13 14 15 16 17 18 19 20 21 22 23

Statistics
ProbabilityIn the video we just saw we performed logarithmic regression for the height of a tree in feet over time and found our model equation to be y 2 062 7 695 In a where a is time in years According to this model how many years will it take for the tree to grow to 30 feet tall Round your answer to the nearest tenth of a year and do not include units Provide your answer below

Statistics
ProbabilityWhat is a random variable Choose the correct answer below OA A random variable is a numerical measure having either a finite or countable number of values of the ou of a probability experiment OB A random variable is a numerical measure having values that can be plotted on a line in an uninterrupted fashion of the outcome of a probability experiment OC A random variable is a numerical measure of the outcome of a probability experiment

Statistics
ProbabilityMODEL EXAMPLE https youtu be tQ2uuurC5RM 1 Suppose that 65 of the population gets a flu vaccine If 30 of those who were not vaccinated get the flu and 10 of those who were vaccinated still get the flu find the probability that a person was vaccinated given that they have the flu 8 pts Draw the square Venn diagram and its four rectangles find the areas needed to compute the probability See the example video

Statistics
ProbabilitySuppose x is a uniform random variable with values ranging from 30 to 60 Find the probability that a randomly selected observation exceeds 42 0000 0 6 0 1 0 4 0 9


Statistics
Probability35 A rare and deadly disease has a disease rate of 0 1 A screening test of the disease called DT is good in the sense that the accuracy of the test among healthy people is 97 while the accuracy among diseased people is 99 What is the overall accuracy of the test DT Further if a friend of yours diagnosed positively what is the chance that he she really don t have the disease

Statistics
ProbabilityB 15 There are 100 male birds and 300 female birds in birdhouse A and 300 males and 100 females in

Statistics
ProbabilityWhich of the following are properties of the normal curve Select all that apply A The area under the normal curve to the right of the mean is 1 B The graph of a normal curve is skewed right C The high point is located at the value of the mean D The area under the normal curve to the right of the mean is 0 5 E The graph of a normal curve is symmetric F The high point is located at the value of the standard deviation


Statistics
ProbabilityThe probability that an individual has 20 20 vision is 0 14 In a class of 32 students what is the probability of finding five people with 20 20 vision O 0 14 O 0 156 O 0 925 O 0 185

Statistics
ProbabilityUse the discrete probability distribution below to find the probability that x equals 4 4 7 9 0 18 0 03 x P x 3 0 15 O 0 61 O2 56 O 0 1521 O 0 64

Statistics
ProbabilitySuppose your city has a large hospital and a small hospital each performing major and minor surgeries You collect data to see how many surgical patients have their discharges delayed by postsurgical complications and find the results shown in the table a Overall for what percent of patients was discharge delayed Round to one decimal place as needed Major Minor Large 115 of 85 10 of 40

Statistics
ProbabilityANSWER Write the word or phrase that best completes each statement or answers the question Find the indicated probability Round to three decimal places 18 A test consists of 10 true false questions To pass the test a student must answer at least 6 questions correctly If a student guesses on each question what is the probability that the student will pass the test 18 4 I MULTIPLE CHOICE Choose the one alternative that best completes the statement or answers the question 19 Find the probability of at least 2 girls in 7 births Assume that male and female births are equally likely and that the birthe ara indonondont quanto

Statistics
ProbabilitySolve the problem 24 According to a college survey 22 of all students work full time Find the standard deviation for the number of students who work full time in samples of size 16 24 A 2 6 B 1 9 C 1 7 D 3 5 Determine if the outcome is unusual Consider as unusual any result that differs from the mean by more than 2 standard deviations That is unusual values are either less than 20 or greater than u 20 25 A survey for brand recognition is done and it is determined that 68 of consumers have heard of Dull Computer Company A survey of 800 randomly selected consumers is to be conducted For such groups of 800 would it be unusual to get 634 consumers who recognize the Dull Computer Company name 25 A Yes B No 26 A survey for brand recognition is done and it is determined that 68 of consumers have heard of Dull Computer Company A survey of 800 randomly selected consumers is to be conducted For such groups of 800 would it be unusual to get 530 consumers who recognize the Dull Computer Company name 26

Statistics
Probability0 183 0 311 0 264 0 150 and 0 064 respectively MULTIPLE CHOICE Choose the one alternative that best completes the statement or answers the question Find the mean of the given probability distribution 6 In a certain town 40 of adults have a college degree The accompanying table describes the probability distribution for the number of adults among 4 randomly selected adults who have a college degree X P x 0 0 1296 1 0 3456 2 0 3456 30 1536 4 0 0256 6

Statistics
ProbabilityConsider a set of data in which the sample mean is 33 7 and the sample standard deviation is 7 2 Calculate the z score given that x 30 2 Round your answer t two decimal places

Statistics
ProbabilitySuppose that 43 of voters in St Lucie county support a proposed zoning ordinance Consider the sampling distribution of the sample proportion of supporters with sample size n 125 Determine the mean and standard deviation of the sampling distribution of p Round solutions to four decimal places if necessary What is the mean of this distribution Hp What is the standard error of this distribution M

Statistics
ProbabilitySuppose that IQ scores have a bell shaped distribution with a mean of 97 and a standard deviation of 17 Using the empirical rule what percentage of IQ scores are at least 46 Please do not round your answer

Statistics
ProbabilityLeta be a normally distributed continuous random variable with a mean of 291 and a standard deviation of 26 Determine the value of a such that the area to the left of x is 0 2743 Round the solution to two decimal places if necessary 89 11

Statistics
ProbabilityBased on the Consumer Transportation Survey data below develop a probability mass function and cumulative distribution function both tabular and as charts for the random variable number of children a What is the probability that an individual in this survey has fewer than three children b What is the probability that an individual in this survey has at least one child c What is the probability that an individual in this survey has five or more children Click the icon to view the Consumer Transportation Survey data Develop a probability mass function table X 0 1 2 Round to three decimal places as needed 3 4 5 or more B D 1ehicle Drivel Type stisfaction with vehicGender 2 Truck Domestic Yes Foreign No 3 Truck 4 Truck Male Male Male Male Domestic No Domestic Yes 5 SUV 6 SUV Domestic No 7 SUV Domestic No 8 SUV 9 SUV 10 SUV 11 SUV 12 SUV 13 Mini Van 14 Mini Van 15 Mini Van 16 Mini Van 17 Mini Van 18 Car 19 Car 20 C 21 Car 22 Car 23 Car 24 Car 25 Car 26 Car 27 Car 28 Ca 29 Car 30 Car 31 Car 32 33 34 Domestic Yes Domestic Yes Foreign Yes Domestic Yes Foreign Yes Domestic Yes Foreign Yes Domestic No Foreign Yes Domestic No Dornestic Yes Domestic Yes Domestic Yes Foreign Yes Domestic Yes Foreign No Foreign Yes Domestic No Domestic Yes Foreign Yes Domestic No Domestic No Domestic Yes Foreign No Female Female Male Male Male Male Male Female Female Female Female Male Fernale Female Female Female Female Female Male Male Female Male Male Female Female Female E F G H Age of hours per week in vehililes drive per wecumber of Childreerage number of rideMiles from work 29 26 18 31 31 29 28 49 50 48 45 33 28 B 43 38 35 39 51 22 34 47 19 33 46 21 30 44 62 29 42 12 6 10 15 4 21 16 15 51 10 8 201 10 5 10 11 5 10 4 5 15 4 Al 5t 6 51 51 51 3701 580 300 675 800 300 400 1000 840 1400 300 800 350 7000 450 350 700 600 250 600 300 500 400 275 150 351 285 175 250 400 0 of 2 21 0 0 0 0 11 4 4 1 15 201 35 50 20 151 22 45 25 201 51 0 0 0 0 45 40 3 16 21 4 22 18 n 18 16 0 19 22


Statistics
ProbabilityThe monthly incomes for 12 randomly selected people each with a bachelor s degree in economics are shown on the right Complete parts a through c below Assume the population is normally distributed a Find the sample mean x 4263 1 Round to one decimal place as needed b Find the sample standard deviation S Round to one decimal place as needed 4450 31 4455 08 4283 49 3946 76 4596 4151 452 402

Statistics
ProbabilityThe standard deviation of the distribution of sample means is The standard deviation of the distribution of sample means is O

Statistics
ProbabilityA genetics experiment involves a population of fruit flies consisting of 3 males named Alfonso Barry and Carlos and 1 female named Diane Assume that two fruit flies are randomly selected with replacement a After listing the possible samples and finding the proportion of females in each sample use a table to describe the sampling distribution of the proportion of females Proportion of females Probability 0 0 5 Type integers or fractions

Statistics
ProbabilityUse the standard normal distribution or the t distribution to construct a 99 confidence interval for the population mean Justify your decision If neither distribution can be used explain why Interpret th in a random sample of 42 people the mean body mass index BMI was 29 1 and the standard deviation was 6 12 Which distribution should be used to construct the confidence interval Choose the correct answer below A Use a normal distribution because the sample is random na 30 and a is known B Use a t distribution because the sample is random na 30 anda is unknown OC Use a normal distribution because the sample is random the population is normal and a is known D Use a t distribution because the sample is random the population is normal and a is unknown E Neither a normal distribution nor a t distribution can be used because either the sample is not random or n 30 and the population is not known to be normal Select the correct choice below and if necessary fill in any answer boxes to complete your choice OA The 99 confidence interval is Round to two decimal places as needed OB Neither distribution can be used to construct the confidence interval

Statistics
ProbabilityConstruct the confidence interval for the population mean c 0 90 x 9 9 o 0 7 and n 58 A 90 confidence interval for is Round to two decimal places as needed

Statistics
ProbabilityK Determine the point estimate of the population mean and margin of error for the confidence interval with lower bound of 22 and upper bound of 44 OA X 33 E 22 OB X 33 E 11 OC X 44 E 11 OD X 22 E 22 m

Statistics
ProbabilityIf 8cos 0 4 12 where 0 0 2 what are the values of 0 List your answers as exact answers in terms of it separated by a comma if necessary Provide your answer below

Statistics
Probability33 When playing roulette at a casino a gambler is trying to decide whether to bet 20 on the number 15 or to bet 20 that the outcome is any one of the five possibilities 00 0 1 2 or 3 The gambler 38 knows that the expected value of the 20 bet for a single number is 1 05 For the 20 bet that the outcome is 00 0 1 2 or 3 there is a probability of of making a net profit of 100 and a probability of losing 20 38 a Find the expected value for the 20 bet that the outcome is 00 0 1 2 or 3 b Which bet is better a 20 bet on the number 15 or a 20 bet that the outcome is any one of the numbers 00 0 1 2 or 3 Why a The expected value is Round to the nearest cent as needed b Since the expected value of the bet on the number 15 is COCOS than the expected value for the bet that the outcome is 00 0 1 2 or 3 the bet on is better