Probability Questions and Answers

Statistics
ProbabilityIt s believed that as many as 23 of adults over 50 never graduated from high school We wish to see if this percentage is the same among the 25 to 30 age group What sample size would a to increase our confidence level to 95 while reducing the margin of error to only 5 n Round up to the nearest integer

Statistics
ProbabilityTo test Ho 20 versus H 20 a simple random sample of size n 16 is obtained from a population that is known to be normally distributed Answer parts a d Click here to view the t Distribution Area in Right Tail RONG to two decimal places as need b Draw a t distribution with the area that represents the P value shaded Which of the following graphs shows the correct shaded region O A B c Approximate the P value Choose the correct range for the P value below OA 0 15 P value 0 20 OB 0 025 P value 0 05 OC 0 10 P value 0 15 0 05 R value 0 10 C Q Q

Statistics
Probability8 Consider any regular pyramid Indicate which line segmen has the greater length a slant height or altitude b lateral edge or radius of the base

Statistics
ProbabilityThe headline reporting the results of a poll stated Majority of Adults at Personal Best in the Morning The results indicated that a survey of 1100 adults resulted in 56 stating they were at their personal best in the morning The poll s results were reported with a margin of error of 4 Explain why the poll s headline is accurate Choose the correct answer below OA All the values within the margin of error are greater than 50 O B More than 50 of the respondents answered in the affirmative OC More than 30 people were surveyed

Statistics
ProbabilityThe probability of making a Type II error is indicated by the letter OA H Provide an appropriate response OB x OC B D a

Statistics
ProbabilityA survey of 400 non fatal accidents showed that 173 involved faulty equipment Find a point estimate for p the population proportion of accidents that involved faulty equipment OA 0 568 OB 0 302 OC 0 433 D 0 762

Statistics
ProbabilityProvide an appropriate response True or False As the number of degrees of freedom increases the chi square distribution becomes more nearly symmetric OA True OB False

Statistics
ProbabilityScores on the quantative portion of an exam have a mean of 589 and a standard deviation of 152 Assume the scores are normally distributed what percentage of students taking the quantive exam score above 6127 Click the icon to view the table of standard scores and percentiles What percentage of students taking the quantitative exam score above 6127 Round to the nearest whole number as needed

Statistics
ProbabilityA circle has an initial radius of 50 ft when the radius begins decreasing at the rate of 5 ft min What is the rate in the change of area at the instant that the radius is 28 ft Write an equation relating the area of a circle A and the radius of the circle r Type an exact answer using it as needed

Statistics
Probabilitypart per ppm Listed below mercury ppm found in tuna sushi sampled at different stores in a major city Construct a 95 confidence interval estimate of the mean amount of mercury in the population Does it appear that there i too much mercury in tuna sushi 0 56 0 81 0 10 0 99 1 23 0 52 0 79 AUT SURCO UCuina praves as cucu Does it appear that there is too much mercury in tuna sushi A No because it is possible that the mean is not greater than 1 ppm Also at least one of the sample values is less than 1 ppm so at least some of the fish are safe OB Yes because it is possible that the mean is not greater than 1 ppm Also at least one of the sample values exceeds 1 ppm so at least some of the fish have too much mercury OC Yes because it is possible that the mean is greater than 1 ppm Also at least one of the sample values exceeds 1 ppm so at least some of the fish have too much mercury No because it is not possible that the mean is greater than 1 nom Also at least one of the sample values is less than 1 ppm so at least some of the fish are safe


Statistics
Probability1 point Find a particular solution to the nonhomogeneous differential equation y 25y cos 5x Yp help formulas Find the most general solution to the associated homogeneous differential equation Use c and c in your answer to denote arbitrary constants Enter c as c1 and c as c2 Yh help formulas Find the solution to the original nonhomogeneous differential equation satisfying the initial conditions y 0 0 and y 0 0 y help formulas

Statistics
ProbabilityI pxrxt FUTURE VALUE OF AN ANNUITY U Y 1 FR A P 1 i PRESENT VALUE OF AN ANNUITY PVR ROM THE AMORTIZATION TABLE 1 1 1 ORTGAGES ONLINE CALCULATOR 3 Maya decides to buy a townhouse The price of the townhouse is 500000 which requires a mortgage to be amortized over 25 years at an interest rate of 3 a Is this a Present Value or a Future Value problem Explain b Maya needs to pay 5 as a down payment What is the down payment Explain what Closing Costs are c What is the leftover amount that needs to be mortgaged d What is the amount of the monthly payment e What is the total amount paid on the mortgage loan 1 How much interest will Maya pay over the life of the loan g Explain one way that Maya can pay less interest over the life of the loan In your explanation state how much she will save in interest

Statistics
ProbabilityState the conclusion based on the results of the test According to the Federal Housing Finance Board the mean price of a single family home two years ago was 299 200 A real estate broker believes that because of the recent credit crunch the mean price has decreased since then The null hypothesis is not rejected Choose the correct answer below OA There is not sufficient evidence to conclude that the mean price of a single family home has increased from its level two years ago of 299 200 OB There is not sufficient evidence to conclude that the mean price of a single family home has decreased from its level two years ago of 299 200 OC There is sufficient evidence to conclude that the mean price of a single family home has increased from its level two years ago of 299 200 OD There is sufficient evidence to conclude that the mean price of a single family home has decreased from its level two years ago of 299 200
Statistics
ProbabilityState the conclusion based on the results of the test The standard deviation in the pressure required to open a certain valve is known to be o 1 3 psi Due to changes in the manufacturing process the quality control manager feels that the pressure variability has increased The null hypothesis was rejected Choose the correct answer below OA The standard deviation in the pressure has not changed OB There is sufficient evidence that the standard deviation in the pressure required to open a certain valve has not changed OC There is not sufficient evidence that the standard deviation in the pressure required to open a certain valve has increased OD There is not sufficient evidence that the standard deviation in the pressure required to open a certain valve has not changed O E There is sufficient evidence that the standard deviation in the pressure required to open a certain valve has increased OF The standard deviation in the pressure has increased

Statistics
ProbabilitySuppose the null hypothesis is rejected State the conclusion based on the results of the test Six years ago 11 3 of registered births were to teenage mothers A sociologist believes that the percentage has increased since then Which of the following is the correct conclusion OA There is sufficient evidence to conclude that the percentage of teenage mothers has remained the same OB There is not sufficient evidence to conclude that the percentage of teenage mothers has remained the same OC There is not sufficient evidence to conclude that the percentage of teenage mothers has increased OD There is sufficient evidence to conclude that the percentage of teenage mothers has increased

Statistics
Probabilityhat is at the heart of hypothesis testing in statistics This is a reading assessment question Be certain of your answer because you only get one attempt on this question hoose the best answer below O A Determine whether a statement is true OB Make an assumption about reality and collect sample evidence to determine whether it contradicts the assumption C Determine whether a statement is false n Nong of the above

Statistics
ProbabilityWhat happens to the probability of making a Type II error as the level of significance a decreases Why Choose the correct answer below OA The probability increases Type I and Type II errors are inversely related OB The probability increases The sum of x and always equals 1 OC The probability decreases Type I and Type II errors are proportional O D The probability decreases The more careful researcher is the lower the chances of making any error

Statistics
ProbabilityIf the consequences of making a Type I error are severe would you choose the level of significance x to equal 0 01 0 05 or 0 10 Choose the correct answer below OA 0 05 OB 0 01 OC 0 10

Statistics
ProbabilityIf a hypothesis is tested at the a 0 05 level of significance what is the probability of making a type I error Choose the correct answer below OA The probability of making a type I error is 0 95 OB The probability of making a type I error is 0 5 OC The probability of making a type I error is 0 05

Statistics
ProbabilityUse the Hypothesis Test for Linear Correlation flow chart interactive to answer the following question A null hypothesis of Ho p 0 is equivalent to which one of the following Choose the correct answer below A There is a negative linear correlation B There is no linear correlation C There is a linear correlation D There is a positive linear correlation

Statistics
Probabilitya What is a residual b In what sense is the regression line the straight line that best fits the points in a scatterplot a What is a residual A A residual is a value of y y which is the difference between an observed value of y and a predicted value of y OB A residual is a value that is determined exactly without any error OC A residual is a point that has a strong effect on the regression equation OD A residual is the amount that one variable changes when the other variable changes by exactly one unit b In what sense is the regression line the straight line that best fits the points in a scatterplot The regression line has the property that the of the residuals is the possible sum

Statistics
ProbabilityAs accounts manager in your company you classify 75 of your customers as good credit and the rest as risky credit depending on their credit rating Customers in the risky category allow thei accounts to go overdue 50 of the time on average whereas those in the good category allow their accounts to become overdue only 10 of the time What percentage of overdue accounts are held by customers in the risky credit category OA 93 75 B 12 5 C 20 D 62 5

Statistics
ProbabilityJeff a sales manager of a car dealership believes that his sales force sells a car to 35 of the customers who stop by the showroom He needs the dealership to make 40 sales this month to get special bonus of 120 000 Approximately 120 customers visit the showroom each month You may assume that the customers entering the dealership are independent of one another Complete parts a through f below a What is the probability that he will make his bonus The probability that he will make his bonus is 0 681 Round to three decimal places as needed b What is the probability that he will sell between 30 and 40 cars exclusively The probability that he will sell between 30 and 40 cars is Round to three decimal places as needed

Statistics
ProbabilityWhen generating a sample space a table is most effective when Select one O a there is one event because it shows the total number of events O b there is one event because it shows the likelihood for different outcomes there are three events because it shows the total number of events O c O d there are two events because it shows the likelihood for different outcomes

Statistics
ProbabilityDraw a normal curve with a mean of 66 and a standard deviation of 11 Describe how you constructed the curve and discuss its features Choose the correct graph of the normal curve below OA 55 66 77 88 99 Q OB 44 55 66 77 88 Q Describe how you constructed the curve and discuss its features The normal distribution curve is centered at and has 2 points of inflection representing u a Type integers or decimals OC 40 53 66 79 92 representing u d and a

Statistics
ProbabilityA sample of voters were polled to determine the likelyhood of measure 324 passing The poll determined that 45 of voters were in favor of the measure with a margin of error of 2 1 Find the confidence interval Use in your notation

Statistics
ProbabilityThe per capita energy consumption level in kilowatt hours in a certain country for a recent year can be approximated by a normal distribution as shown in the figure a What consumption level represents the 10th percentile b What consumption level represents the 21st percentile c What consumption level represents the third quartile www a The consumption level that represents the 10th percentile is Round to the nearest integer as needed b The consumption level that represents the 21st percentile is Round to the nearest integer as needed c The consumption level that represents the third quartile is Round to the nearest integer as needed kilowatt hours kilowatt hours kilowatt hours 2299 k UNE 5942 L 299 2299 Kilowatt hours 4299

Statistics
ProbabilityFor the following expression find the correct partial fraction decomposition y 16y 12 y y 2 3y 2 Enter your answer as the sum or difference of fractions with a constant in each numerator and with a linear expression in each denominator Provide your answer below Mi

Statistics
ProbabilityFill in the blank to complete the sentence below If the normality requirement is not satisfied that is np 1 p is not at least 10 then a 95 confidence interval about the population proportion will include the population proportion in 95 of the intervals This is a reading assessment question Be certain of your answer because you only get one attempt on this question If the normality requirement is not satisfied that is np 1 p is not at least 10 then a 95 confidence interval about the population proportion will include the population proportion in 95 of the intervals exactly more than

Statistics
ProbabilityA group conducted a poll of 2045 likely voters just prior to an election The results of the survey indicated that candidate A would receive 49 of the popular vote and candidate B would receive 48 of the popular vote The margin of error was reported to be 3 The group reported that the race was too close to call Use the concept of a confidence interval to explain what this means What does it mean to say the race was too close to call OA The margin of error suggests candidate A may receive between 46 and 52 of the popular vote and candidate B may receive between 45 and 51 of the popular vote Because the poll estimates overlap when accounting for margin of error the poll cannot predict the winner OB Since the poll results do not show that one of the candidates has more than 50 of the popular vote the poll cannot predict the winner OC Since the difference between the percentages of the popular vote for the candidates is less than the 3 of voters that are undecided the poll cannot predict the winner OD Since the estimated proportions depend on the level of confidence the candidate predicted to receive the greater percentage of the popular vote changes for different levels of confidence so the poll cannot predict the winner

Statistics
Probabilityplain what 90 confidence means in a 90 confidence interval hat does 90 confidence mean in a 90 confidence interval A The probability that the value of the parameter lies between the lower and upper bounds of the interval is The probability that it does not is 10 O B The value of the parameter lies within 90 of a standard deviation of the estimate O C If 100 different confidence intervals are constructed each based on a different sample of size n from the same population then we expect 90 of the intervals to include the parameter and 10 to not include the parameter D The confidence interval includes 90 of all possible values for the parameter

Statistics
ProbabilityThe Okeechobee County Health Department needs to estimate the proportion of all children in the county aged 19 35 months that are completely up to date with all state recommended immunizations The Okeechobee County Health Department found that 76 of a random sample of children in the county aged 19 35 months were completely up to date with all state recommended immunizations Find three different confidence intervals one with sample size 285 one with sample size 454 and one with sample size 631 Assume that 76 of the children each sample are completely up to date with all state recommended immunizations Observe how the sample size affects the margin of error and subsequently the width of each interval Report confidence interval solutions using interval notation Report all solutions in percent form rounded to two decimal places if necessary When n 285 the margin of error for a 90 confidence interval is given by When n 285 a 90 confidence interval is given by When n 454 the margin of error for a 90 confidence interval is given by When n 454 a 90 confidence interval is given by When n 631 the margin of error for a 90 confidence interval is given by When n 631 a 90 confidence interval is given by If the sample size is increased leaving all other characteristics constant the margin of error of the confidence interval will Select an answer If the sample size is increased leaving all other characteristics constant the width of the confidence interval will Select an answer


Statistics
ProbabilityA world record was set in a given year for the longest run on an ungaffed fair roulette wheel The number 8 appeared 6 times in a row What is the probability of the occurrence of this event Assume that there are 38 equally likely outcomes consisting of the number 1 36 0 and 00 If you enter your answer in scientific notation round the decimal value to two decimal places Use equivalent rounding if you do not enter your answer in scientific notation

Statistics
Probability1 Given the function represented by the following graph Note The corners are at 1 0 2 0 4 and 6 0 0 6 0 4 0 2 0 0 2 2 3 y f x a 3 pts Verify that it is a probability density function 4 L O 5 6

Statistics
ProbabilityK For the statement below write the claim as a mathematical statement State the null and alternative hypotheses and identify which represents the claim An amusement park claims that the mean daily attendence at the park is at least 20 000 people Write the claim as a mathematical statement OA 20 000 OD 20 000 Choose the correct null and alternative hypotheses below OA Ho 20 000 Ha 220 000 OD Ho 20 000 Hus 20 000 Identify which is the claim A The alternative hypothesis H H 20 000 is the claim OB The null hypothesis Ho 220 000 is the claim OC The alternative hypothesis H 20 000 is the claim OD The alternative hypothesis H 20 000 is the claim OE The null hypothesis Ho u 20 000 is the claim OF The null hypothesis Ho p 20 000 is the claim OB H 20 000 OE 220 000 OB Ho 20 000 H 20 000 OE Ho 20 000 Ha 20 000 www OC p 20 000 OF 20 000 OC Ho 20 000 Ha 20 000 OF Hou220 000 H 20 000

Statistics
ProbabilityK Explain how to decide when a normal distribution can be used to approximate a binomial distribution Choose the correct answer below OA If np 5 and nq 5 the normal distribution can be used B If np 0 and nq 0 the normal distribution can be used O C If np 5 and nq 5 the normal distribution can be used OD If np 5 and nq 25 the normal distribution can be used

Statistics
ProbabilityK The statement represents a claim Write its complement and state which is Ho and which is HA p 9 7 OA Ho 9 7 H p 9 7 claim OB Ho p29 7 claim Ha 9 7 OC Ho 9 7 Ha p 9 7 claim O D Ho p 9 7 claim H 9 7

Statistics
ProbabilityA random sample of 200 adults was given an IQ test It was found that 94 of them scored higher than 100 Based on this compute a 99 confidence interval for the proportion of all adults whose IQ score is greater than 100 Then find the lower limit and upper limit of the 99 confidence interval Carry your intermediate computations to at least three decimal places Round your answers to two decimal places If necessary consult a list of formulas Lower limit Upper limit X S Im A

Statistics
ProbabilityIs the statement below true or false The mean of the sampling distribution of p is p Choose the correct answer below O False O True

Statistics
Probabilitys the statement below true or false The distribution of the sample mean x will be normally distributed if the sample is obtained from a population that is normally distributed regardless of the sample size Choose the correct answer below O True False GILE

Statistics
ProbabilityThe following contingency table shows opinion about global warming nonissue vs serious concem among registered voters broken down by political party affiliation Democratic Repul Independent Use the table to answer a through c below Opinions on Global Warming Nonissue Serious Concern Total Democratic Political Party Republican Independent Total 70 260 70 400 430 240 130 800 500 500 200 1200 O www a What is the probability that a randomly selected registered voter who is a Republican believes that global warming is a serious issue 480 Round to three decimal places as needed b What is the probability that a randomly selected registered voter is a Republican given that he or she believes global warming is a serious issue Round to three decimal places as needed

Statistics
ProbabilityDoes the claim represent the null hypothesis or the alternative hypothesis V a statement of equality it represents the Since the claim Part 1 of 3 Determine whether the claim stated below represents the null hypothesis or the alternative hypothesis If a hypothesis test is performed how should you interpret a decision that a rejects the null hypothesis or b fails to reject the null hypothesis A scientist claims that the mean incubation period for the eggs of a species of bird is at least 46 days contains does not contain Points 0 of 1 hypothesis Save

Statistics
ProbabilityK A baseball team claims that the mean length of its games is at most 1 5 hours State Ho and H in words and in symbols Then determine whether the hypothesis test for this claim is lett talled right tailled or two tailed Explain your reasoning State the null hypothesis in words and in symbols Choose the correct answer below A The null hypothesis expressed in words is the mean length of a baseball team s games is 1 5 hours The null hypothesis is expressed symbolically as Ho p 1 5 OB The null hypothesis expressed in words is the mean length of a baseball team s games is not 1 5 hours The null hypothesis is expressed symbolically as H 1 5 c The null hypothesis expressed in words is the mean length of a baseball team s games is at most 1 5 hours The null hypothesis is expressed symbolically as Ho p 15 OD The null hypothesis expressed in words is the mean length of a baseball team s games is at least 1 5 hours The null hypothesis is expressed symbolically as Ho p215 State the alternative hypothesis in words and in symbols Choose the correct answer below CZB OA The alternative hypothesis expressed in words is the mean length of a baseball team s games is not 1 5 hours The alternative hypothesis is expressed symbolically as H 1 5 OB The alternative hypothesis expressed in words is the mean length of a baseball team s games is 1 5 hours The alternative hypothesis is expressed symbolically as H p 15 OC The alternative hypothesis expressed in words is the mean length of a baseball team s games is less than 1 5 hours The alternative hypothesis is expressed symbolically as H 15 D The alternative hypothesis expressed in words is the mean length of a baseball team s games is more than 1 5 hours The alternative hypothesis is expressed symbolically as H 1 5 The hypothesis test is left tailed because the alternative hypothesis contains

Statistics
ProbabilityKE Use technology to help you test the claim about the population mean at the given level of significance a using the given sample statistics Assume the population is normally distributed Claim us 1200 a 0 04 o 198 63 Sample statistics x 1219 75 n 250 Identify the null and alternative hypotheses Choose the correct answer below OA Ho 21219 75 Ha 1219 75 OC Ho Ha 1219 75 1219 75 OE Ho 21200 Ha 1200 4 OB Ho 1219 75 H 1219 75 OD Ho 1200 H 1200 OF Ho 1200 Haus 1200
Statistics
ProbabilityK State Ho and H in words and in symbols Then determine whether the hypothesis test is left tailed right tailed or two tailed Explain your reasoning Sketch a normal sampling distribution and shade the area the P value A report claims that lung cancer accounts for 21 of all cancer diagnoses SZERD State the null hypothesis in words and in symbols The null hypothesis expressed in words is the proportion of cancer diagnoses attributable to lung cancer Type integers or decimals Do not round Y is less than IS is at least is not The null hypothesis is expressed symbolically as Ho p is more than is at most 4
Statistics
Probabilityill in the blank to complete the statement The area under the normal curve to the right of u equals The area under the normal curve to the right of u equals 0 O 1 2
Statistics
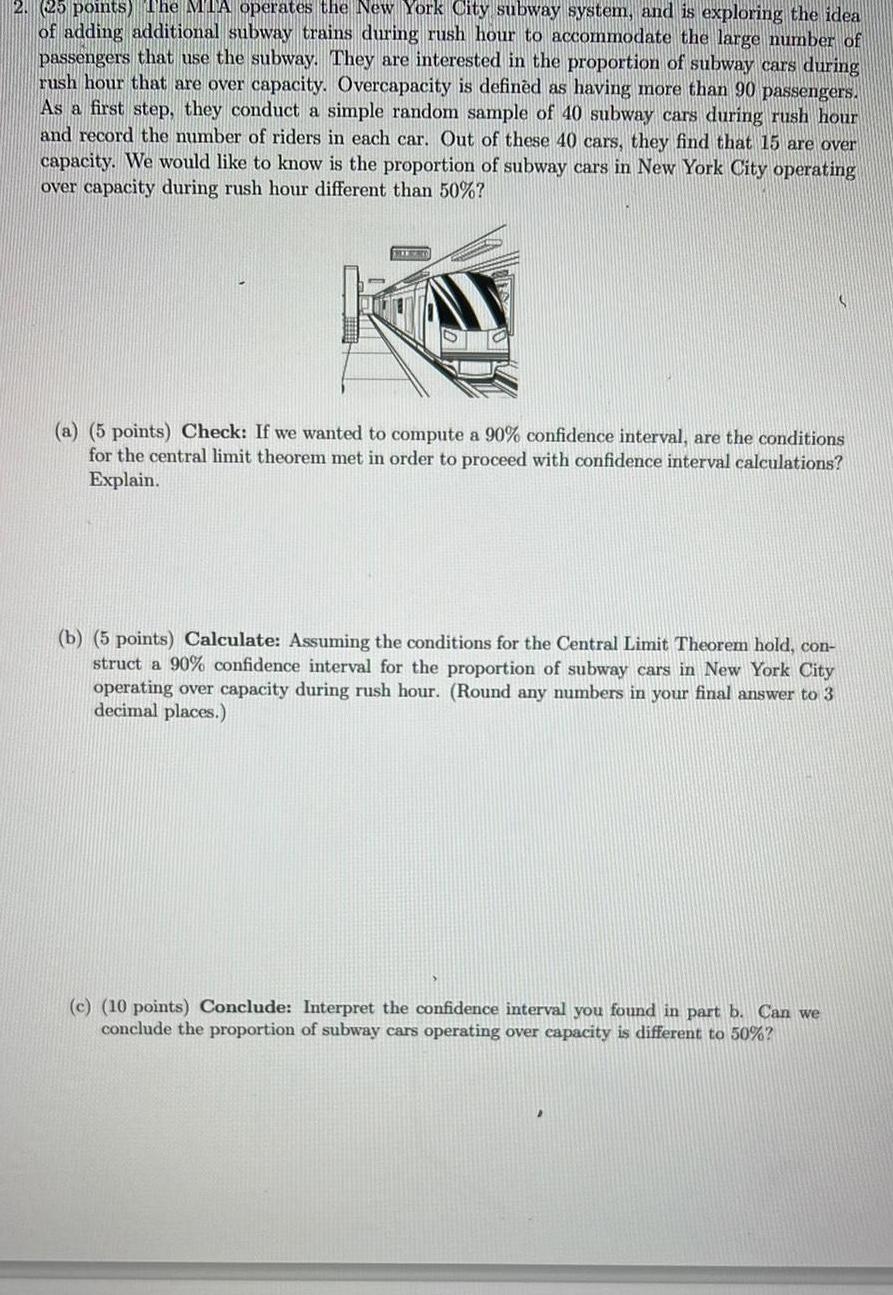
Probability2 25 points The MTA operates the New York City subway system and is exploring the idea of adding additional subway trains during rush hour to accommodate the large number of passengers that use the subway They are interested in the proportion of subway cars during rush hour that are over capacity Overcapacity is defined as having more than 90 passengers As a first step they conduct a simple random sample of 40 subway cars during rush hour and record the number of riders in each car Out of these 40 cars they find that 15 are over capacity We would like to know is the proportion of subway cars in New York City operating over capacity during rush hour different than 50 HIERO a 5 points Check If we wanted to compute a 90 confidence interval are the conditions for the central limit theorem met in order to proceed with confidence interval Explain b 5 points Calculate Assuming the conditions for the Central Limit Theorem hold con struct a 90 confidence interval for the proportion of subway cars in New York City operating over capacity during rush hour Round any numbers in your final answer to 3 decimal places c 10 points Conclude Interpret the confidence interval you found in part b Can we conclude the proportion of subway cars operating over capacity is different to 50
Statistics
Probability1 25 points A group of researchers claims that a city s collee of people favoring coffee over other beverages This claim was determined by conducting a hypothesis test at a significance level of 0 05 According to their test results they found evidence against the null hypothesis which stated that the true proportion is 35 Upon further investigation you found out that the test statistic for their test was 2 33 The researchers also revealed that the observed proportion of people who actually preferred coffee in their sample was 30 The researchers also hinted that they used a two sided test for their study COFFEE a 10 points Assuming the conditions for the central limit theorem are met estimate the sample size they might have used for this study b 5 points Under what conditions is the Central Limit Theorem applicable Are all the conditions met in this problem If not state what additional statement would need to be made