Statistics Questions and Answers

Statistics
StatisticsFor 10 17 Elephants have the longest pregnancy of all mammals One species of elephant has a mean gestation period of 525 days and standard deviation of 32 days Pregnancy length follows an approximately normally distribution Use the 68 95 99 7 Rule to approximate each of the following 10 Using the values given above label the normal curve at the right with the numerical values for o 20 and 30 11 The longest 16 of all elephant pregnancies last at least how many days 12 The middle 68 of all elephant pregnancies last between and days 13 Only 2 5 of all elephant pregnancies last longer than days 14 What percent of elephant pregnancies last less than 461 days 15 What percent of elephant pregnancies last between 525 and 557 days 16 What percent of elephant pregnancies last between 493 and 589 days 17 What percent of elephant pregnancies last less than 557 days

Statistics
StatisticsRULE INTERPRETING Z SCORES 1 If a person has a negative z score did the person score higher or lower than the mean 2 If a person has a negative z score it does not always mean that the person did not do well Name a sport where having the lowest z score would be the most desirabla At Name

Statistics
StatisticsLet H be the set of polynomials a Give two different examples of polynomials in H example 1 p x example 2 g x b Give two different examples of polynomials from P3 which are not in H example 1 p x example 2 g x c Complete the following statements to determine if H is a subspace of P3 0 in H q x H p P3 P 2 0 His under vector addition If it is not closed enter two polynomials p q E H below whose sum is not in H If it is closed then leave the following spaces blank p x His under scalar multiplication If it is not closed enter a scalar k and polynomial r H below whose product is not in H If it is closed then leave the following spaces blank k and r x

Statistics
StatisticsThree forces are acting on a modern streetlamp at points A B and C a Express the three forces acting at points A B and C as Cartesian force vectors in Sl units b Compute the resultant force vector written as a Cartesian force vector c Compute the magnitude of the resultant force vector you found in part d d Convert your answer in part d to the US customary system of units FPS 8 m 2 1 2 4 m 2 4 m A y 45 650 N 2 4 m 8 kN B 12 kN

Statistics
StatisticsA researcher wants to know how registered voters in her state feel about health care She obtains a list of 2152 registered voters in her state selects 700 of them at random and emails a questionnaire to them 149 questionnaires are returned Of these 73 stated that they believe that the current health care program needs to be completely overhauled Classify the following groups a the population or the sample for this particular study If a group does not belong in either category leave it unplaced Population the 149 registered voters who returned the questionnaire the 73 who stated that the current health care program needs to be completely overhauled Answer Bank the 700 registered voters who were randomly chosen all registered voters in the researcher s state 21 the proportion of all registered voters in the researcher s state who believe that the current health care program needs to be completely overhauled Sample the 2152 registered voters whose names were obtained all registered voters

Statistics
Statisticsind the sample standard deviation rounding to one decimal plac 0 7 8 11 20 20 6 19 7 23 OA 6 2 OB 1 5 OC 6 1 C D 6 6

Statistics
StatisticsThe stem and leaf display below gives the amounts of money to answer the questions that follow Amount spent at the amusement park dollars 180

Statistics
Statisticsind the z score for the value 71 when the mean is 84 and the standard deviation is 2 rounding to two decimal pla O A z 0 82 OB Z 6 50 OC z 0 82 D Z 7 00 C

Statistics
StatisticsMartina repairs 5 types of electronic devices in her repair shop The number of bar graph answer the questions Number of Repairs 12 10 8 6 4 2 Telephone Computer Radio Type of Device Television CD player

Statistics
StatisticsThe citizens of a city were asked to choose their favorit question how many chose Cat
Statistics
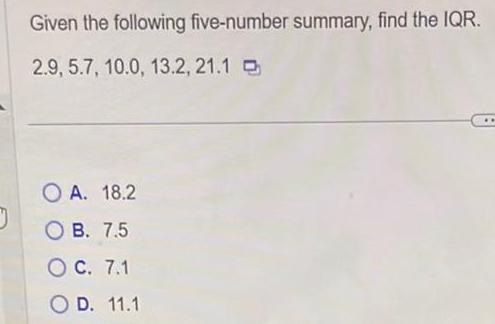
StatisticsGiven the following five number summary find the IQR 2 9 5 7 10 0 13 2 21 1 OA 18 2 OB 7 5 O C 7 1 O D 11 1

Statistics
StatisticsCompute the range for the set of data 0 223 0 12 0 55 0 433 0 572 0 233 A 0 572 OB 0 452 OC 0 12 OD 0 355

Statistics
StatisticsGiven the following five number summary find Q3 2 9 5 7 10 0 13 2 21 1 D OA 5 7 OB 21 1 O C 13 2 R 10 0 12

Statistics
StatisticsDecide if the following statement is true or false Explain why Answer 0 5 Points It is possible to have a standard deviation of True the standard deviation is a measure of how far th negative value only means that the data are generally False the standard deviation is equal to the variance s negative

Statistics
Statisticsempah s tt son nbach ka thy a Pulse 71 28288 FE 78 65 65 90 89 74 66 64 0 n standard deviation ce as needed standard deviation of the following three simple random samples of size 3 Perpectual y Janette al Crystal ation s of sample 1 Janette Kathy Perpectual is beats per minute ce as needed

Statistics
StatisticsConsider the following box plots for Data Set A and Data S H 0 45 50 55 57 61 60 65 D

Statistics
StatisticsThe data represent the age of world leaders on their day of inauguration Find the 43 five number summary and construct a boxplot for the data Comment on the shape 67 of the distribution 46 48 The five number summary is 57 51 61 50 53 46 54 67 50 53 47

Statistics
StatisticsViolent crimes include rape robbery assault and homicide The following is a summary of the violent crime rate violent crimes per 100 000 population for all states of a country in a certain year Complete parts a through d Q 271 8 Q 387 9 Q 528 3 OA The middle 25 of all observations have a range of 256 5 crimes per 100 000 population OB The middle 50 of all observations have a range of 116 1 crimes per 100 000 population c The middle 50 of all observations have a range of 256 5 crimes per 100 000 population D All observations have a range of 256 5 crimes per 100 000 population c The violent crime rate in a certain state of the country in that year was 1 496 Would this be an outlier crimes per 100 000 population The lower fence is The upper fence is Round to two decimal places as needed crimes per 100 000 population

Statistics
StatisticsThe following data represent the monthly phone use in minutes of a customer enrolled in a fraud prevention program for the past 20 months The phone company decides to use the upper fence as the cutoff point for the number of minutes at which the customer should be contacted What is the cutoff point minutes The cutoff point is Round to the nearest minute 536 451 331 480 356 324 500 527 349 409 457 414 440 503 543 484 349 528 446 331

Statistics
StatisticsGiven the data in the table what graph best depicts banana prices in Feb Ye 200 200 201 201 201

Statistics
StatisticsA highly selective boarding school will only admit students who place at least 2 standard deviations above the mean on a standardized test that has a mean of 200 and a standard deviation of 24 What is the minimum score that an applicant must make on the test to be accepted The minimum score that an applicant must make on the test to be accepted is

Statistics
StatisticsA random selection of volunteers at a research institute have been exposed to a typical cold virus After they started to have cold symptoms 10 of them were given multivitamin tablets formulated to fight cold symptoms The remaining 10 volunteers were given placebo tablets For each individual the length of time taken to recover from the cold is recorded At the end of the experiment the following data are obtained Days to recover from a cold Treated with multivitamin 2 6 5 9 5 3 5 8 8 7 6 2 7 6 6 4 8 0 4 0 3 0 5 1 4 7 4 2 4 7 5 6 5 9 4 7 7 1 4 9 Treated with placebo It is known that the population standard deviation of recovery time from a cold is 1 8 days when treated with multivitamin tablets and the population standard deviation of recovery time from a cold is 1 5 days when treated with placebo tablets It is also known that both populations are approximately normally distributed The researchers claim that the mean recovery time of the patients treated with multivitamin is not equal to the mean recovery time of the patients who are treated with placebo tablets At the 0 01 level of significance is there enough evidence to support this claim Perform a two tailed test Then complete the parts below Carry your intermediate computations to at least three decimal places a State the null hypothesis Ho and the alternative hypothesis H Ho H b Determine the type of test statistic to use Z t Chi Square F Degrees of freedom if applicable c Find the value of the test statistic Round to three or more decimal places d Find the two critical values at the 0 01 level of significance Round to three or more decimal places e Can we support the researchers claim that the mean recovery time when treated with multivitamin is not equal to the mean recovery time when treated with placebo Yes

Statistics
StatisticsThe mean finish time for a yearly amateur auto race was 185 49 minutes with a standard deviation of 0 323 minute The winning car driven by Sam finished in 185 16 minutes The previous year s race had a mean finishing time of 111 5 with a standard deviation of 0 109 minute The winning car that year driven by Beth finished in 111 34 minutes Find their respective z scores Who had the more convincing victory Sam had a finish time with a z score of Beth had a finish time with a z score of Round to two decimal places as needed

Statistics
Statistics2 Suppose that follows a chi square distribution with 22 degrees of freedom Use a calculator to answer the following a Compute P x 13 Round your answer to at least three decimal places P 13 b Find k such that P x k 0 1 Round your answer to at least two decimal places k

Statistics
StatisticsA study was designed to investigate the effects of two variables 1 a student s level of mathematical anxiety and 2 teaching method on a student s achievement in a mathematics course Students who had a low level of mathematical anxiety were taught using the traditional expository method These students obtained a mean score of 430 with a standard deviation of 40 on a standardized test Assuming a bell shaped distribution where would approximately 95 of the students score OA below 350 or above 510 B below 310 or above 550 C between 310 and 550 D between 350 and 510

Statistics
StatisticsA small computing center has found that the number of jobs submitted per day to its computers has a distribution that is approximately bell shaped with a mean of 71 jobs and a standard deviation of 8 Where would one expect most approximately the middle 95 of the distribution to fall O A between 55 and 95 jobs per day B between 55 and 87 jobs per day C between 47 and 95 jobs per day D between 63 and 79 jobs per day

Statistics
StatisticsA union of restaurant and foodservice workers would like to estimate the mean hourly wage of foodservice workers in the U S this year The mean hourly wage last year was 8 16 and there is good reason to believe that this year s value is greater than last year s The union decides to do a statistical test to see if the value has indeed increased The union chooses a random sample of this year s wages computes the mean of the sample to be 8 56 and computes the standard deviation of the sample to be 1 20 Based on this information complete the parts below a What are the null hypothesis Ho and the alternative hypothesis H that should be used for the test Ho H b Suppose that the union decides to reject the null hypothesis What sort of error might it be making Type I Type II c Suppose the true mean hourly wage for foodservice workers in the U S this year is 8 61 Fill in the blanks to describe a Type II error A Type II error would be rejecting failing to reject the hypothesis that u is less than less than or equal to greater than greater than or equal to not equal to equal to 8 16 1 20 8 56 when in fact u is equal to 1 20 equal to 8 16 less than 1 20 less than 8 16 less than 8 56 greater than 8 16

Statistics
StatisticsThe costs in dollars of 10 college math textbooks are listed below Find the sample standard deviation rounding to the nearest cent 70 72 71 70 69 73 69 68 70 71 OA 2 23 B 1 49 C 70 30 OD 5 00

Statistics
StatisticsQuestion 3 A decade old study found that the proportion of high school seniors who felt that getting rich was an important personal goal was 65 Suppose that we have reason to believe that this proportion has changed and we wish to carry out a hypothesis test to see if our belief can be supported State the null hypothesis Ho and the alternative hypothesis H that we would use for this test Ho

Statistics
StatisticsLast year batting averages in professional baseball averaged 0 250 with a high of 0 324 and a low of 0 221 minimur 250 at bats Based on this information which measure of variation could be calculated A variance OB standard deviation C percentile D range

Statistics
StatisticsThe scores from a state standardized test have a bell shaped distribution with a mean of 100 and a standard deviation of 15 Use the Empirical Rule to find the percentage of students with scores between 70 and 130 OA 100 B 68 OC 99 7 OD 95
Statistics
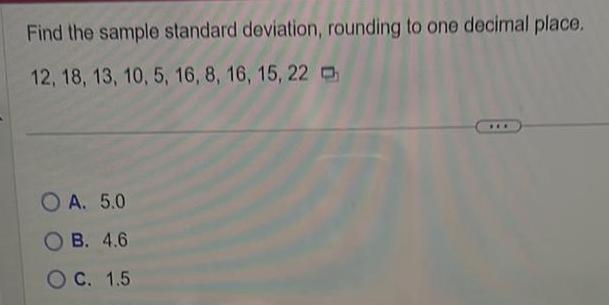
StatisticsFind the sample standard deviation rounding to one decimal place 12 18 13 10 5 16 8 16 15 22 OA 5 0 B 4 6 OC 1 5

Statistics
StatisticsGiven the following five number summary find Q 2 9 5 7 10 0 13 2 21 1 OA 2 9 OB 5 O C 10 0

Statistics
StatisticsFind the z score for the value 80 when the mean is 95 and the standard deviation is 3 rounding to two decimal places OA Z 5 00 B Z 0 81 C z 0 81 D z 5 33 www

Statistics
StatisticsThe average score of local students on a college entrance exam is 110 with a standard deviation of 5 The distribution is roughly bell shaped Use the Empirical Rule to find the percentage of local students with scores above 120 O A 97 5 B 95 C 2 5 D 5

Statistics
StatisticsThe one way distances from work in miles of 30 employees are listed below Find Q 25 25 26 26 5 27 27 27 5 28 29 29 30 30 30 5 33 33 34 34 5 28 28 5 31 31 32 32 5 32 5 35 35 37 37 38 38 OA 30 75 mi B 28 mi C 34 mi OD 31 75 mi

Statistics
StatisticsThe amount of television viewed by today s youth is of primary concern to Parents Against Watching Television PAWT 300 parents of elementary school aged children were asked to estimate the number of hours per week tha their child watched television The mean and the standard deviation for their responses were 13 and 4 respectively PAWT constructed a stem and leaf display for the data that showed that the distribution of times was a bell shaped distribution Give an interval around the mean where you believe most approximately 95 of the television viewing times fell in the distribution A between 5 and 21 hours per week B less than 9 and more than 17 hours per week C between 1 and 25 hours per week D between 9 and 17 hours per week

Statistics
StatisticsIf the graph of a distribution of data shows that the graph is skewed to the left then what are the relative positions of the mean and median MAX OA Mean Median B Median Mean OC Mean Median D No conclusion about the relative position of the mean and the median can be made

Statistics
StatisticsA student scores 56 on a geography test and 249 on a mathematics test The geography test has a mean of 80 and a standard deviation of 20 The mathematics test has a mean of 300 and a standard deviation of 34 If the data for both tests are normally distributed on which test did the student score better relative to the other students in each class A The student scored the same on both tests B The student scored better on the mathematics test C The student scored better on the geography test

Statistics
StatisticsSolar energy is considered by many to be the energy of the future A recent survey was taken to compare the cost o solar energy to the cost of gas or electric energy Results of the survey revealed that the distribution of the amount c the monthly utility bill of a 3 bedroom house using gas or electric energy had a mean of 95 and a standard deviatio of 12 If the distribution can be considered bell shaped what percentage of homes will have a monthly utility bill of more than 83 A approximately 32 B approximately 95 C approximately 16 O D approximately 84

Statistics
StatisticsCompute the range for the set of data 0 219 0 117 0 519 0 365 0 597 0 311 OA 0 355 B 0 117 OC 0 597 OD 0 48


Statistics
StatisticsThe April precipitation amounts in inches for 10 obes are listed below Find the range of the data OA 2 45 inches OS 14 inches OC 28nches OD 32 inches


Statistics
StatisticsHealth care issues are receiving much attention in both academic and political arenas A sociologist recently conducte a survey of citizens over 60 years of age whose net worth is too high to qualify for government health care but who have no private health insurance The ages of 25 uninsured senior citizens were as follows Find Q of the data 68 73 66 76 86 74 61 89 65 90 69 92 76 62 81 63 68 81 70 73 60 87 75 64 82 A 66 5 B 65 5 C 81 5 D 64 5 www

Statistics
StatisticsA pharmaceutical testing company wants to test a new cholesterol drug The average cholesterol of the target population is 200 mg and they have a standard deviation of 25 mg The company wished to test a sample of people who fall between 1 5 and 3 z scores above the mean Into what range must a candidate s cholesterol level be in order for the candidate to be included in the study OA 125 162 5 B 237 5 275 O C 162 5 275 D 225 237 5 XXX

Statistics
StatisticsHere are the hottest recorded temperatures in F for eac Temperatures in F 114 99 103 116 105 117 110 113 104 113 108 107 98 102 113 Send data to calculator plete the grouped frequency distribution for
Statistics
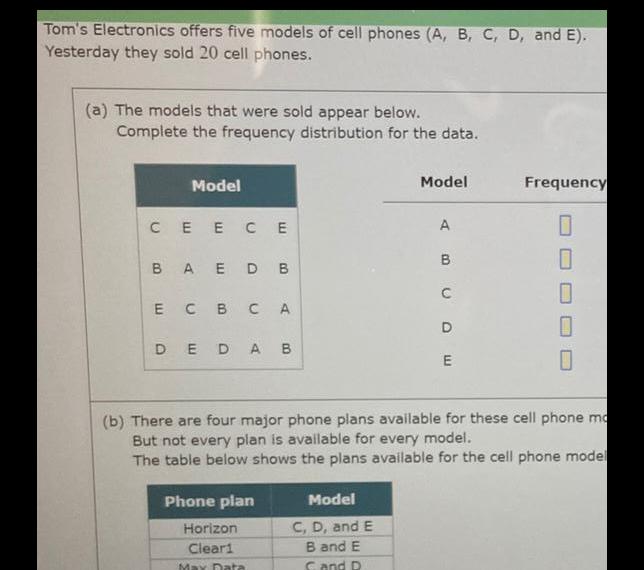
StatisticsTom s Electronics offers five models of cell phones A B C D and E Yesterday they sold 20 cell phones a The models that were sold appear below Complete the frequency distribution for the data Model CEECE BAED B ECB CA DEDA B Phone plan Horizon Cleari Max Data Model Model C D and E B and E S and D ABCDE B D Frequency 0 b There are four major phone plans available for these cell phone mo But not every plan is available for every model The table below shows the plans available for the cell phone model 0 0

Statistics
StatisticsKala is taking a self paced math class Her so Complete the grouped relative frequency dis decimal r

Statistics
StatisticsA sample of 17 participants took part in a hearing exp participant The 17 measurements were as follows