Statistics Questions
The best high school and college tutors are just a click away, 24×7! Pick a subject, ask a question, and get a detailed, handwritten solution personalized for you in minutes. We cover Math, Physics, Chemistry & Biology.

Statistics
Statistics3 Are we getting smarter When the Stanford Binet IQ test came into use in 1932 it was adjusted so that scores for each age group of children followed roughly the Nor mal distribution with mean 100 and standard deviation 15 The test is readjusted from time to time to keep the mean at 100 If present day American children took the 1932 Stanford Binet test their mean score would be about 120 The reasons for the increase in IQ over time are not known but probably include better childhood nutrition and more experience in taking tests a IQ scores above 130 are often called very superior What percentage of children had very superior scores in 1932 b If present day children took the 1932 test what per centage would have very superior scores Assume

Statistics
Statistics1 Heights of men and women The heights of women aged 20 29 follow approximately the N 64 2 2 8 dis tribution Men the same age have heights distributed as N 69 4 3 0 What percent of men aged 20 29 are taller than the mean height of women aged 20 29

Statistics
Statistics1 Here are the resting heart rates of 26 ninth grade biology students Make a stemplot of these data Do no split stems 61 7 77 81 48 75 70 77 70 76 86 55 65 60 63 79 62 71 72 74 74 64 66 71 66 68

Statistics
Statistics6 31 Acid rain Emissions of sulfur dioxide by industry set off chemical changes in the atmosphere that result in acid rain The acidity of liquids is measured by pH on a scale of 0 to 14 Distilled water has pH 7 0 and lower pH values indicate acidity Normal rain is somewhat acidic so acid rain is sometimes defined as rainfall with a pH below 5 0 The pH of rain at one location varies among rainy days according to a Normal distribution with mean 5 43 and standard deviation 0 54 What pro 11 II bal

Statistics
Statistics8 35 I love my bug The 2016 Volkswagen Beetle with a four cylinder 1 8 L engine and automatic transmission has combined gas mileage of 28 mpg What percent of all 2016 vehicles have better gas mileage than the Beetle

Statistics
Statisticsa Find the number z such that the proportion of ob servations that are less than z in a standard Normal distribution is 0 2 Find the number such that 40 of all observa

Statistics
StatisticsCholesterol Low density lipoprotein or LDL is the main source of cholesterol buildup and blockage in the arteries This is why LDL is known as bad cholesterol LDL is measured in milligrams per deciliter of blood or mg dL In a population of adults at risk for cardiovascu lar problems the distribution of LDL levels is Normal with a mean of 123 mg dL and a standard deviation of 41 mg dL If an individual s LDL is at least 1 standard de viation or more above the mean he or she will be moni tored carefully by a doctor What percentage of individuals from this population will have LDL levels 1 or more stan dard deviations above the mean Use the 68 95 99 7 rule
Statistics
Statistics7 Monsoon Rains The summer monsoon rains bring 80 of India s rainfall and are essential for the country s agriculture Records going back more than a century show that the amount of monsoon rainfall varies from year to year according to a dis tribution that is approximately Normal with mean 852 millimeters mm and stan dard deviation 82 mm 3 Use the 68 95 99 7 rule to answer the following questions a Between what values do the monsoon rains fall in the middle 95 of all years b How small are the monsoon rains in the driest 2 5 of all years

Statistics
Statistics9 Men s and Women s Heights The heights of women aged 20 29 in the United States are approximately Normal with mean 64 2 inches and standard deviation 2 8 inches Men the same age have mean height 69 4 inches with stan dard deviation 3 0 inches What are the z scores for a woman 5 5 feet tall and a 6 man 5 5 feet tall Say in simple language what information the z scores give that the original nonstandardized heights do not

Statistics
StatisticsMonsoon Rains The summer monsoon rains in India follow approximately a Normal distribution with mean 852 millimeters mm of rainfall and standard deviation 82 mm BIC 3 a In the drought year 1987 697 mm of rain fell In what percent of all years will India have 697 mm or less of monsoon rain b Normal rainfall means within 20 of the long term aver age or between 682 mm and 1022 mm In what percent of all years is the rainfall normal

Statistics
Statistics1 Find the limit function for the sequence of functions f x Is this convergence uniform Why or why not 1 1 mx 1 on the interval 0 1

Statistics
Statistics6 5 5 4 2 1 T 3 2 1 0 1 2 11 2 3 N 3 3 T 4 T 5 6 X 4 Find average rate of change over the interval 6 2 5 Find average rate of change over the interval 2 0 6 Find average rate of change over the interval 0 2 7 Find average rate of change over the interval 2 5 8 Find average rate of change over the interval 6 5

Statistics
ProbabilityFind the following Probabilities given 500 people were surveyed Total Sports a b C Men Women Total Dance 0 04 0 32 0 36 0 20 0 12 0 32 TV 0 16 0 16 0 32 0 40 0 60 1 00 That a person surveyed does not dance That a woman surveyed likes sports How many people surveyed were men who liked dance

Statistics
ProbabilityOpening Activity In a class of 30 students 3 out of the 16 girls and 6 out of the 14 boys are left handed Draw a Venn diagram and find the probability that a student chosen at random is a boy or left handed L 3 6 B 8 13

Statistics
Statisticsinclude each of the six categories O A possible This question 1 point s possible On which interval s is the function undefined Select the correct choice below and if necessary fill in the answer box to complete your choice Type an inequality Use integers or decimals for any numbers in the inequality Use a comma to separate answers as needed OB There is no interval on which the function is undefined On which interval s is the function increasing Select the correct choice below and if necessary fill in the answer box to complete your choice OA O Type an inequality Use integers or decimals for any numbers in the inequality Use a comma to separate answers as needed OB There is no interval on which the function is increasing On which interval s is the function decreasing Select the correct choice below and if necessary fill in the answer box to complete your choice DA Type an inequality Use integers or decimals for any numbers in the inequality Use a comma to separate answers as needed There is no interval on which the function is decreasing Submit te

Statistics
StatisticsIn 2016 quarterback Matt Ryan won the NFL s most valuable player award The two way table summarizes the association between distance of pass attempt and outcome of pass attempt for Matt Ryan during the 2016 season Suppose we select one pass attempt at random Give each answer as a decimal rounded to the thousandths place Two Way Table Outcome of pass attempt Complete Incomplete Total Distance of pass attempt yards 10 or less 11 20 21 30 31 or more 281 67 17 8 86 48 16 367 115 33 11 19 Total 373 161 534 14 a What is the probability that the pass attempt was at most 10 yards b What is the probability that the pass attempt was more than 10 yards c What is the probability that the pass attempt was at most 10 yards and complete d What is the probability that the pass attempt was at most 10 yards or complete

Statistics
Statistics320 available to fence in a rectangular garden The fencing for the side of the garden facing the road costs 12 per foot and the fencing for the other three sides costs 4 per foot The picture on the right depicts this situation Consider the problem of finding the dimensions of the largest possible garden a Determine the objective and constraint equations b Express the quantity to be maximized as a function of x c Find the optimal values of x and y a Let A equal the area of the garden The objective equation is Type an equation The constraint equation is Type an equation b Express the quantity to be maximized as a function of x Type an equation c Find the optimal values of x and y 8 mplify your answers point s possible Submit test 4 14 Y 12 Road

Statistics
Probabilityf 4 2 f x 0 for x 4 f 4 0 and f x 0 for x 4 fiction that has the properties described below Choose the correct graph below O A Ay 4 2 B 4 2 57 Next question O C D
Statistics
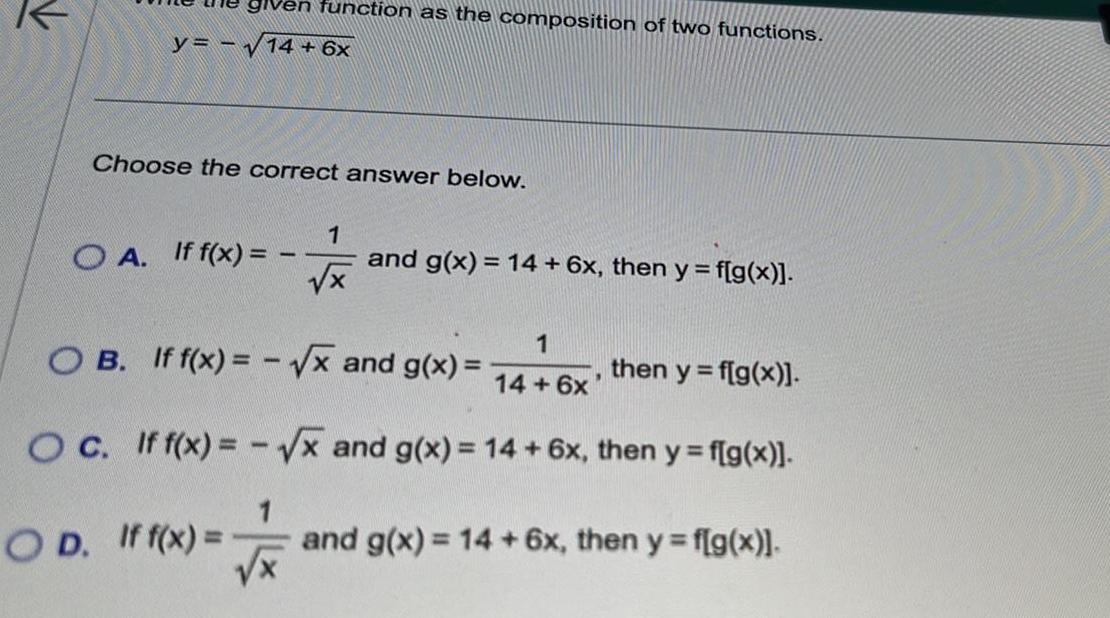
Probabilityfunction as the composition of two functions y 14 6x Choose the correct answer below OA If f x 1 1 x and g x 14 6x then y f g x 1 OB If f x x and g x then y f g x 14 6x OC If f x x and g x 14 6x then y f g x OD If f x and g x 14 6x then y f g x

Statistics
Probabilityy 24x16x 9 given function Next question This test 20 points pembin This question 1 points pomm The x intercept s is are Type an ordered pair Use a comma to separate answers as needed Use integers or fractions for any numbers in the expression


Statistics
ProbabilityO y x 2 x 8x 1 Choose the correct setup below to differentiate the function O d y x 2 x 2 x 8x 1 dx d dx O y x 2 x 8x 1 x 8x 1 x 2 dx dx x 8x 1 y 2 x 2 x 2 2 x 8x 1 dx d x 2 2 x 8x 1 x 8x 1 dx d y x 2 x x 1 x 2 dx y x 2 x 8x 1 x 8x 1 x 2

Statistics
ProbabilityWhich of the functions below are increasing for all x B I 1 t Q This test 20 point s possible This question 1 point s possible A Submit tes Select the correct choice below and if necessary fill in the answer box to comple choice Type A B C or D Use a comma to separate answers as needed OB None of the functions are increasing for all x

Statistics
Probabilityf x x 1 2 x 5 function has one relative extreme point Find it and determine whether it is a relative maximum or a relative minimum The relative extreme point is Type an ordered pair Is the relative extreme point a relative maximum or a relative minimum Relative maximum Relative minimum 1 point s po


Statistics
ProbabilityAllie buys a box of granola bars to hand out to her friends at school There are twelve granola bars in the box in which six are chocolate chip three are raisin and three a peanut butter Allie randomly passes out the granola bars to her friends Determine whether each statement indicates the correct probability for the occurrence of events as described Select Yes or No for each statement AB C The probability that the first two friends both get chocolate chip is 0 250 The probability that the first friend gets peanut butter and the second friend gets chocolate chip is 0 136 The probability that the first friend gets raisin and the second friend gets peanut butter is 0 063 Yes 00 No

Statistics
Probability13 Two marbles are drawn from a bag containing 11 red 10 white and 9 purple What is the probability of drawing Red first purple second 1 red and 1 purple No white marbles Same color DRAG DROP THE ANSWER 11 X 30 29 30 II 30 10 XXNSE 10 9 y 8 X X 29 30 29 X x 2 29 20 19 30 29 II 9 30 29

Statistics
ProbabilitySuppose you spin the spinner one time AA 15 U a B A D A BA Probability C A D Construct a probability model Outcomes D B B C b What is the probability of the spinner not landing on ar

Statistics
Probability8 A coin is tossed and a die is rolled What is the probability that the coin shows tails and the die shows a multiple of 2 Leave your answer in fraction form

Statistics
StatisticsA basket contains 3 green marbles and 9 blue marbles A marble is drawn without replacement Then another marble is drawn What is the probability that both marbles will be green Write your answer to the nearest whole percent

Statistics
Probability10 Kylie has a collection of bows for her hair She has two different sizes small and large All the bows are either solid or have a pattern Small Pattern 8 Solid 7 Large 6 7 What is the probability as a percentage that a randomly selected bow is large and has a pattern Enter your answer rounded to the nearest whole number in the space provided 06

Statistics
ProbabilityPlace an X In the table to show whether each pair of events is mutually exclusive or inclusive A person is 27 years old and 29 years old A student is walking and listening to music A number is even and is a multiple of 5 A number is odd and is a multiple of 2

Statistics
Probability2 a Noah surveyed 500 sophomores and juniors about their third period classes His results are summarized in the relative frequency tab Math Science History Total 0 24 0 20 0 68 0 08 0 15 0 32 0 32 0 35 1 00 Sophomore 0 24 0 09 0 33 Junior Total Part A What is the probability that a surveyed student does not have third period history b Part B What is the probability that a surveyed junior has third period math c Part C How many surveyed students are sophomores with third period science

Statistics
ProbabilityA card is picked from the following cards Find the probability that the card drawn is purple Answer Note Use slash to separate numerator and denominator

Statistics
ProbabilityPart 3 of 4 102 points O Points 0 of 1 Save Another useful measure of variation for a data set is the mean absolute X deviation MAD It is calculated by the formula MAD a Find the mean absolute deviation of the data set here Compare the result b The mean absolute deviation of the data is X

Statistics
StatisticsConsumer Reports provides cost per daily feeding for 28 brands of dry dog food and 23 brands of canned dog food The following side by side box plot for these data was created COST 3 5 3 0 2 5 2 0 1 5 1 0 5 0 DOG FOOD COSTS BY TYPE OF FOOD CAN TYPE DRY a From these graphs determine the median lower quartile and upper quartile for the daily costs of both dry and canned dog food b Comment on the similarities and differences in the distributions of daily costs for the two types of dog food

Statistics
Statisticsreport change in the type of practice physicians are selecting for their career In particular there is concern that there will be a shortage of family practice physicians in future years The following table contains data on the total number of office based physicians and the number of those physicians declaring themselves to be family practice physicians The numbers in the table are given in thousands of physicians Year nas 1998 1999 2000 2001 67 5 70 0 490 4 514 0 1980 1990 1995 Family Practice 47 8 57 6 59 9 64 6 66 2 Total Office Based Physicians 271 3 359 9 427 3 468 8 473 2 Create a bar chart to display the increase in the number of family practice physicians from 1990 to 2001 Here is the Excel file data Prob1 xlsx You need to create a bar chart using SAS Studio or another software and upload the file You can upload a pdf file or a picture file

Statistics
Statistics3 Tucker 1 2 Example 2 Consider a linear economic supply demand model described by Industrial Demand Consumer Const Trans Steel Demand 0 23 0 2 0 2r3 0 1 0 24 Total Demand Ener Energy d 0 4x Construction d 0 3x Transportation ds 0 1 Steel da I 0 2 0 3x2 0 122 0 122 0 123 100 50 100 0 Use an iterative procedure to estimate production supply levels of all four commodities that perfectly balance supply and demand Begin with supply values of 300 units of energy 250 units of construction 160 units of transportation and 40 units of steel Compute the overall demand given these values then use these results as new supply values Repeat for 3 iterations Make a plot of both the maximum absolute difference and the maximum relative difference from one step the next with number of steps on the x axis

Statistics
StatisticsThe following data are the resting pulse rates for 30 randomly selected individuals who were participants at a 10K race Here is the Excel file Prob3 xlsx 49 40 59 56 55 70 49 59 54 56 55 65 57 61 41 52 55 49 58 54 55 72 51 60 49 57 46 55 63 55 a Construct a stem and leaf plot of the pulse rates SAS Studio doesn t produce stem and leaf and hence you can just type directly using a Word document b Construct a boxplot of the pulse rates c Describe the shape of the distribution of the pulse rates Please combine all outputs into just one file Word document file would be the best choice

Statistics
StatisticsData set Reaction times in milliseconds of 30 adult females to an auditory stimulus 429 295 383 336 514 424 387 430 371 310 441 386 352 471 387 412 440 427 303 455 305 308 324 414 450 388 319 361 508 418 Construct a frequency distribution of the data Use the minimum data entry as the lower limit of the first class Class 1 295 322 2 323 350 3 351 378 Freque 6 2 3

Statistics
StatisticsPart 1 of 3 The distribution of the tuitions fees and room and board charges of a random sample of public 4 year degree granting postsecondary institutions is shown in the pie chart Make a frequency distribution for the Class 15 000 17 499 X 102 points O Points 0 of 1 f Save 15 000 17 499 11 17 500 19 999 9 20 000 22 499 19 22 500 24 999 10 25 000 or more 6

Statistics
StatisticsUsing the employment information in the table on Alpha Corporation determine the width of each class Years Employed at Alpha Corporation Frequency Class Limits Years of Service No of Employees 1 5 6 10 11 15 16 20 21 25 26 30 04 06 5 20 25 10 5 3

Statistics
StatisticsA nurse measured the blood pressure of each person who visited her clinic Following is a relative frequency histogram for the systolic blood pressure readings for those people aged between 25 and 40 Use the histogram to answer the question The blood pressure readings were given to the nearest whole number Given that 800 people were aged between 25 and 40 approximately how many had a systolic blood pressure reading of 140 or higher O 11 O 88

Statistics
StatisticsFind the original data from the stem and leaf plot O 61 68 74 74 76 84 85 88 89 94 95 O 61 68 71 71 74 76 81 84 84 88 89 94 95 O 64 64 65 71 71 74 76 81 81 94 95 0 7 14 7 7 10 12 9 9 12 16 17 13 14 16

Statistics
StatisticsFind the median for the given sample data The salaries of ten randomly selected doctors are shown below 148 000 116 000 169 000 207 000 244 000 142 000 116 000 817 000 219 000 193 000 Find the median salary Round to the nearest thousand O 237 000 O 116 000 O 181 000

Statistics
StatisticsFind the mean for the given sample data Six college students spent 202 12 176 81 202 12 125 14 223 15 and 234 84 respectively for books Compute the mean amount spent Round your answer to the nearest cent O 212 64 O 202 12 O 194 03 30411

Statistics
StatisticsSolve the problem Using the information in the table on home sale prices in the city of Summerhill for the month of June find the class boundaries for class 80 0 110 9 Home Sale Prices in Summerhill for June Class Limits Frequency Sale price in thousands No of homes sold 80 0 110 9 111 0 141 9 142 0 172 9 173 0 203 9 204 0 234 9 235 0 265 9 O 80 110 O 80 111 O 79 111 O 79 95 110 95 2579 10 3 1 7

Statistics
Statisticsincreased in value for the day Down means the stock price decreased in value for the day and No change me Uck for 30 randomly selected trading days Up means the stock price the stock price closed at the same price it closed for the previous day Complete parts a through e below i Click the icon to view the table of data a Construct a frequency distribution Movement Frequency Down No change Up b Construct a relative frequency distribution Movement Relative Frequency Down No change Up Round to three decimal places as needed c Construct a frequency bar graph Choose the correct graph below O A 20 OB 20

Statistics
StatisticsThe table shows the movement of a stock for 30 randomly selected trading days Up means the stock price increased in value for the day Down means the stock price decreased in value for the day and No change mean the stock price closed at the same price it closed for the previous day Complete parts a through e below Click the icon to view the table of data No change Up Round to three decimal places as needed c Construct a frequency bar graph Choose the correct graph below O A OC Frequency Frequency 20 10 20 10 Down No change Up Down No change Up G L OB D louanbai 20 10 20 10 0 PL Down No change Up Down No change Up

Statistics
StatisticsGrade Subject 9th Grade 10th Grade Math What 7 Total 10 Science 29 11 nt relative frequency a 9th grader liked math What s the marginal relative frequency of 9th graders surveyed English 23 30 dent preferred English 6 Social Studies 11 Total 50