Statistics Questions
The best high school and college tutors are just a click away, 24×7! Pick a subject, ask a question, and get a detailed, handwritten solution personalized for you in minutes. We cover Math, Physics, Chemistry & Biology.

Statistics
StatisticsA 0 5 3 Il y a eu 15 donneurs ce matin une clinique de la Soci t canadienne du sang Voici la distribution de leur groupe sanguin Groupe sanguin OA BAB 8 3 3 de donneurs 1 Nous s lectionnons au hasard deux donneurs sans remise parmi ces 15 donneurs Quelle est la probabilit que nous s lectionnions exactement un donneur du groupe O

Statistics
Statistics2 La couleur des yeux d un membre d un groupe de 1770 hommes allemands est soit bleu ou brun et la couleur des cheveux est soit blond ou brun Dans ce groupe il y a 320 hommes qui ont les cheveux bruns et les yeux bruns et il y a 250 hommes qui ont les cheveux bruns et les yeux bleus En outre 400 ont les cheveux blonds et les yeux bruns Quelle est la probabilit qu un membre choisi au hasard de ce groupe a les cheveux blonds et les yeux bleus

Statistics
Statisticsesc 12 AKS 30 The graph of the function h x 2 x 1 is shown below List the characteristics of h x bing left X118 int Right X 3 Domain x 18 ya Positive Decreasing X intercept s 1 0 a How long will it take for the rocket to return to the ground d What is the maximum height Range 0 13 If a toy rocket is launched vertically upward from ground level with an initial velocity of 128 feet per second then its height h after t seconds is given by the equations h t 16t 128t if air resistance is neglected c How long will it take the rocket to hit its maximum height x18 y Negative Increasing o Y intercept s 0 2 x y b After how many seconds will the rocket be 112 feet above the ground

Statistics
StatisticsUnit 3 10 AKS 3a Simplify the following expression and then rewrite with radical form 12 ny n Power to Power 5 5n 1 Expoent must be Positive multiplay exporcent X 12 22 9 AKS 4e Use the graph find the solution s 2 Multiplay add exponentes 8 2 5 x X y 3 11 AKS 3 Simplify the following expression Same base Divide Subtract exponent 3 343 6 4 y 83 25 X x 1 6 12 13 S n6 5 Power Root 2 y s Kadical form x5 Vys Power root

Statistics
Statistics14 AKS 3e A construction worker needs to know how fast water will flow through a pipe He can find this value using the formula 2gh where v is the velocity of the water g is the acceleration due to gravity and h is the height of the water above the opening Unit 4 a On earth the acceleration due to gravity is approximately 10m 52 Write a function v h that represents the velocity of water on earth b What is the velocity v of the water if it is 23 meters above the opening c If the water s velocity is 7m s what is its height h above the opening 15 AKS 2a Find the inverse of the function f x 3 2 Once you find the inverse prove the functions are inverses by using the inverse composition rule f g x g f x x

Statistics
Statistics1 AKS 1a A principal at a school wants to know whether the students feel they are being tested too much at the end of the semester The school has 1000 students but the principal only has time and money to collect information from 200 students a For this situation what would be the BEST way to collect data Take a Survey from the Student b Would this data be considered primary or secondary Primary c What would be the BEST method that the principal could use to select 200 people for the study Select random People d What is the population and characteristic of interest in this scenario 1000 Students 2 A representative sample of trees in a forest shows the trees to have a mean circumference of 20 5 inches and a standard deviation of 1 5 inches a AKS 1e Assuming the circumferences are normally distributed construct a normal curve that describes the given data 20 5 b AKS 1e In this scenario our mean median and mode are all 20 5 c AKS 1e About what percent of trees have a circumference between 17 5 inches and 22 inches d AKS 1e What is the probability that a tree will have a circumference of at least 19 inches e AKS 1d What percent of trees have a circumference less than 21 1 inches

Statistics
Statistics3 AKS 11 A news show displays the results of a poll for a two candidate runoff election between two candidates A and B The polls show that candidate A is leading with 56 of the vote In small print below to poll results it says 6 1 Can candidate A be predicted as the winner Why 4 AKS 1f Sophia earned a score of 35 on Exam A that had a mean of 30 and a standard deviation of 5 She is about to take Exam B that has a mean of 700 and a standard deviation of 25 How well must Sophia score on Exam B in order to do equivalently well as she did on Exam A Assume that scores on each exam are normally distributed 5 AKS 1h John is playing dungeons and dragons with his friends but he is suspicious that one of his friends Mike is cheating In dungeons and dragons you must roll a 20 sided die Typically rolling a 20 is the best roll while rolling a one is the worst All dice rolls are supposed to be random meaning that you have an equal chance of rolling any number John believes that Mike is rolling 20 too frequently for it to be a random occurrence and that Mike must have somehow altered his die a What is the probability that you will roll a 20 if the dice is truly random b John takes Mike s 20 sided die and proceeds to roll it 200 times He records each roll and finds that 12 of the time he rolled a 20 Based on this data he then calculates the margin of error for a 95 confidence interval to be 5 After setting up a confidence interval is it likely that Mike is cheating

Statistics
StatisticsUse the fact that the variance of a Poisson distribution is o The mean number of bankruptcies filed per hour by businesses in a country was about seven a Find the variance and the standard deviation Interpret the results b Find the probability that at most three businesses will file bankruptcy in any given hour a The variance is Round to three decimal places as needed The standard deviation is Round to one decimal place as needed Choose the correct answer below OA The number of bankruptcies is always the standard deviation number of bankruptcies OB The number of bankruptcies always differs from the mean by no more than the standard deviation number of bankruptcies OC The number of bankruptcies usually differs from the mean by no more than the standard deviation number of bankruptcies OD The number of bankruptcies differs from the standard deviation by no more than the mean number of bankruptcies

Statistics
StatisticsAssume that police estimate that 23 of drivers do not wear their seatbelts They set up a safety roadblock stopping cars to check for seatbelt use They stop 50 cars during the first hour 1 p a Find the mean variance and standard deviation of the number of drivers expected not to be wearing seatbelts Use the fact that the mean of a geometric distribution is b How many cars do they expect to stop before finding a driver whose seatbelt is not buckled Round to the nearest tenth as needed The variance is Round to the nearest tenth as needed The mean is The standard deviation is Do not round until the final answer Then round to the nearest tenth as needed They expect to stop cars before finding a driver whose seatbelt is not buckled Round to the nearest tenth as needed THE and the variance is o
Statistics
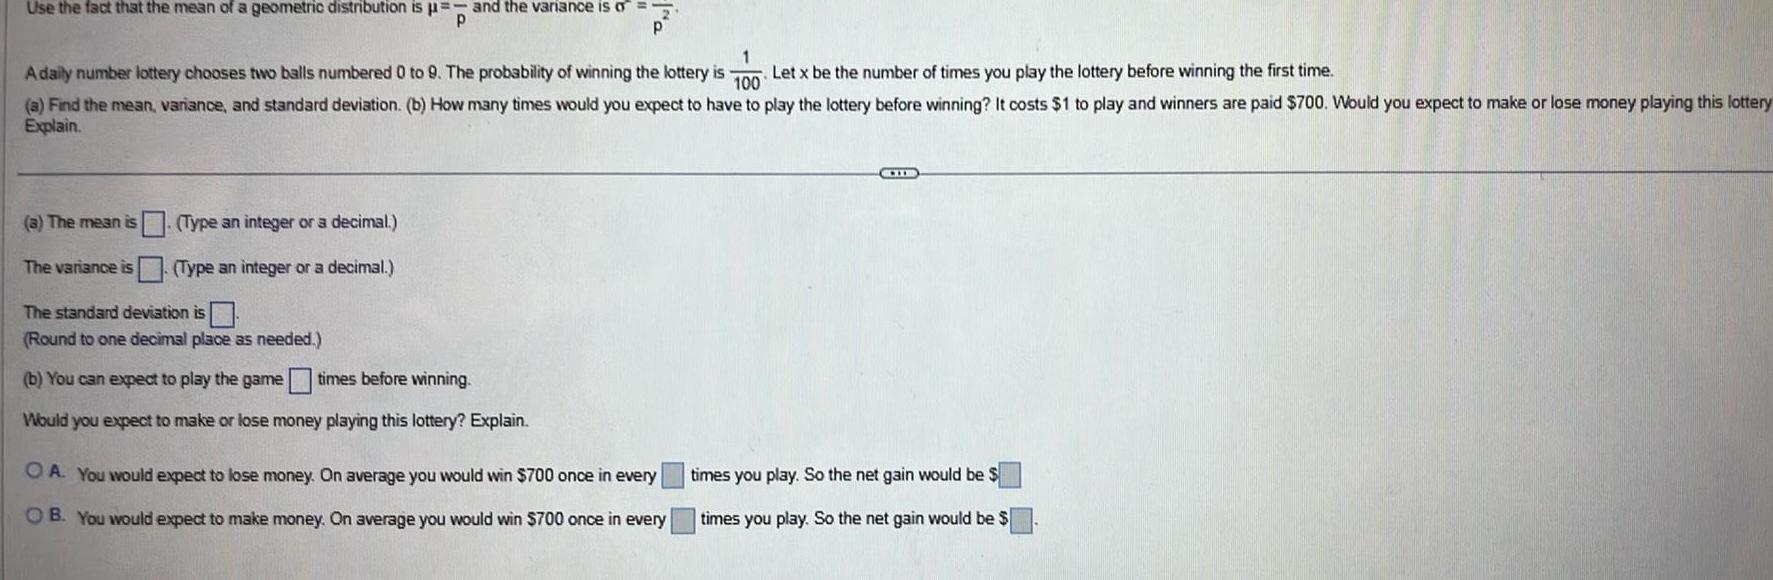
ProbabilityUse the fact that the mean of a geometric distribution is and the variance is o P P 1 A daily number lottery chooses two balls numbered 0 to 9 The probability of winning the lottery is Let x be the number of times you play the lottery before winning the first time 100 a Find the mean variance and standard deviation b How many times would you expect to have to play the lottery before winning It costs 1 to play and winners are paid 700 Would you expect to make or lose money playing this lottery Explain a The mean is Type an integer or a decimal The variance is Type an integer or a decimal The standard deviation is Round to one decimal place as needed b You can expect to play the game times before winning Would you expect to make or lose money playing this lottery Explain OA You would expect to lose money On average you would win 700 once in every OB You would expect to make money On average you would win 700 once in every CHI times you play So the net gain would be times you play So the net gain would be

Statistics
StatisticsAn SRS of 100 flights of a large airline airline 1 showed that 64 were on time An SRS of 100 flights of anothe large airline airline 2 showed that 80 were on time Let p and p2 be the proportion of all flights that are on time for these two airlines Using a 0 01 level of significance what conclusion would you draw from this test O A reject the null hypothesis the values for p and p2 indicate that there is strong enough evidence B fail to reject the null hypothesis there is not strong enough evidence O C reject the null hypothesis the P value indicates that there is strong enough evidence D accept the null hypothesis

Statistics
StatisticsInvestigators gave caffeine to fruit flies to see if it affected their rest The four treatments were a control a low caffeine dose of 1 mg ml of blood a medium dose 3 mg ml of blood and a higher caffeine dose of 5 mg ml of blood Twelve fruit flies were assigned at random to the four treatments three to each treatment and the minutes of rest measured over a 24 hour period were recorded The data follow Minutes of rest 413 422 453 330 Treatment Control Low dose Medium dose High dose Source Caffeine Error Total Assume the data are four independent SRSS one from each of the four populations of caffeine levels and that the distribution of the yields is Normal A partial ANOVA table produced by Minitab follows along with the means and standard deviation of the yields for the four groups One way ANOVA Rest Versus Caffeine DE 450 466 421 364 SS 11976 Level N Mean Control 3 427 00 Low Medium High MS 538 75 StDev 20 07 3 441 00 22 61 3 431 00 19 08 3 361 00 29 61 418 435 419 389 F P The numerator degrees of freedom for the ANOVA F test are A 11 B 2

Statistics
StatisticsIn the United States there has historically been a strong relationship between smoking and education with well educated people less likely to smoke To examine whether this pattern has changed a sample of 459 me was selected at random from those who had visited a health center for a routine check up over the course of the past year Education is classified into three categories corresponding to the highest level of education achieved and smoking status is classified into four categories Smoking Status Education High School College Graduate Total Nonsmoker OB 7 O C 2 56 37 53 146 Former 54 43 28 125 Moderate 41 27 36 104 The degrees of freedom for the chi square test for this two way table are O A 12 Heavy 36 32 16 84 Total 187 139 133 459

Statistics
StatisticsDDT is a pesticide banned in the United States for its danger to humans and animals In an experiment on the impact of DDT six rats were exposed to DDT poisoning and six rats were not exposed For each rat in the experiment a measurement of nerve sensitivity was recorded The researchers suspected that the mean nerve sensitivity for rats exposed to DDT is greater than that for rats not poisoned The data follow Poisoned rats 12 207 16 869 25 050 22 429 8 456 20 589 Unpoisoned rats 11 074 9 686 12 064 9 351 8 182 6 642 Let be the mean nerve sensitivity for rats poisoned with DDT Let 2 be the mean nerve sensitivity for rats not poisoned with DDT The numerical value of the standard error of the difference in sample means is OA 9 02 OB 4 05 O C 1 30 OD 2 71

Statistics
StatisticsYou are evaluating the effectiveness of improvements your company has made to a new mobile app The 95 confidence interval for the difference between the proportion of users who prefer the old version and the proportion who prefer the new version is 0 043 0 094 At the 0 05 level of significance should you reject the null hypothesis that there is no difference between the proportions A no because the value zero is firmly within the confidence interval B no because we do not know the P value C yes because the margin of error is very small D no because the margin of error is very small
Statistics
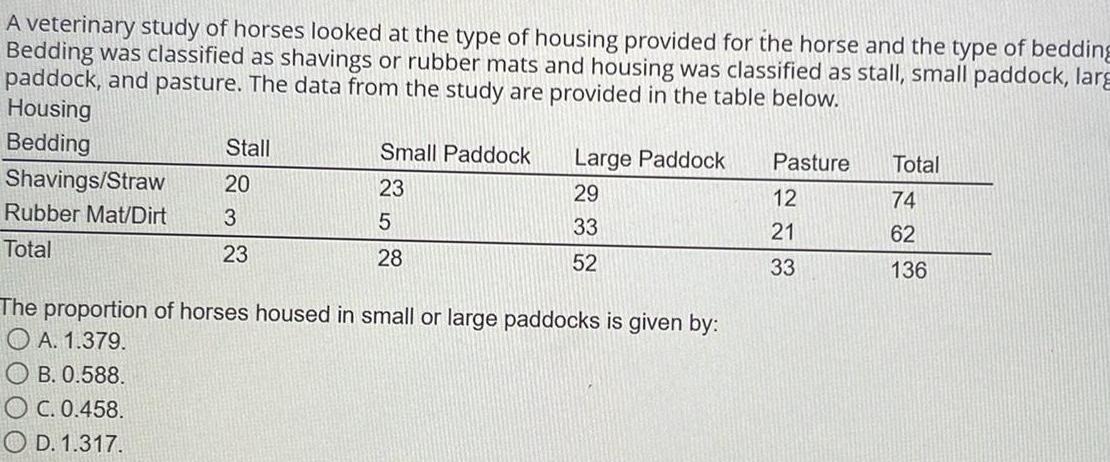
ProbabilityA veterinary study of horses looked at the type of housing provided for the horse and the type of bedding Bedding was classified as shavings or rubber mats and housing was classified as stall small paddock larg paddock and pasture The data from the study are provided in the table below Housing Bedding Shavings Straw Rubber Mat Dirt Total Stall 20 3 23 B 0 588 OC 0 458 OD 1 317 Small Paddock 23 5 28 Large Paddock 29 33 52 The proportion of horses housed in small or large paddocks is given by A 1 379 Pasture 12 21 33 Total 74 62 136
Statistics
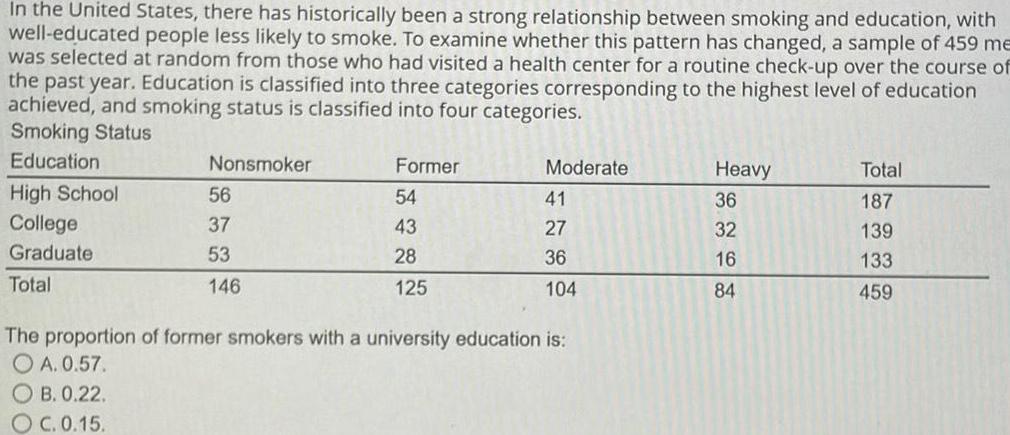
ProbabilityIn the United States there has historically been a strong relationship between smoking and education with well educated people less likely to smoke To examine whether this pattern has changed a sample of 459 me was selected at random from those who had visited a health center for a routine check up over the course of the past year Education is classified into three categories corresponding to the highest level of education achieved and smoking status is classified into four categories Smoking Status Education High School College Graduate Total Nonsmoker OB 0 22 OC 0 15 56 37 53 146 Former 54 43 28 125 Moderate 41 27 36 104 The proportion of former smokers with a university education is OA 0 57 Heavy 36 32 16 84 Total 187 139 133 459

Statistics
StatisticsIn 1965 about 44 of the U S adult population had never smoked cigarettes A national health survey of 1472 U S adults presumably selected randomly during 2010 revealed that 677 had never smoked cigarettes Suppose you wished to test whether there has been a change since 1965 in the proportion of U S adults who have never smoked cigarettes Based on the data you are not sure whether the proportion has increased or decreased Which of the following are the appropriate hypotheses O A Ho 0 44 Ha 0 44 O B Ho p 0 51 Ha p 0 51 OC Ho p 0 44 Ha p 0 44 O D Ho p 0 44 Ha p 0 44

Statistics
Statisticst a large university an SRS of 25 male faculty members included 10 men who felt that the university was upportive of female and minority faculty An SRS of 20 female faculty members found five women who felt the niversity was supportive of female and minority faculty Let p and p2 represent the proportion of all male nd female faculty members respectively who felt that the university was supportive of female and minority aculty A 95 plus four confidence interval for p1 p2 is OA 0 135 0 270 OB 0 135 0 263 OC 0 15 0 263 O D 0 15 0 270

Statistics
StatisticsThe law of large numbers states that as the number of observations drawn at random from a population with proportion p increases the proportion of the observed values p O A gets larger and larger O B gets smaller and smaller O C tends to get closer and closer to the population proportion p O D fluctuates steadily between one standard deviation above and one standard deviation below the observed proportion

Statistics
StatisticsWhich scenario is an example of a matched pairs design O A A teacher compares the scores of students using a computer based method of instruction with the scores of other students using a traditional method of instruction O B A teacher calculates the average of scores of students on a pair of tests and wishes to see if this average is larger than 80 O C A teacher compares the pretest and posttest scores of students O D A teacher compares the scores of students in her class on a standardized test with the national average score

Statistics
StatisticsIn many fast food restaurants there is a strong correlation between a menu item s fat content measured in grams and its calorie content We want to investigate this relationship Using all the food menu items at a well known fast food restaurant the fat content and calorie contents were measured We decide to fit the least squares regression line to the data with fat conten as the explanatory variable and y as the response variable A scatterplot of the data with regression line included and a summary of the data are provided One of the menu items is a hamburger with 107 grams of fat and 1410 calories 20 40 60 Fat grama 80 100 120 r 0 979 correlation between x and y x 40 35 grams mean of the values of x 662 88 calories mean of the values of y S 27 99 grams standard deviation of the values of x Sy 324 90 calories standard deviation of the values of y What is TRUE about the regression line in this example O A 97 9 of the variation is explained by the regression model OB When there are zero grams of fat there will be approximately 200 calories OC The point 40 35 662 88 lies on the regression line
Statistics
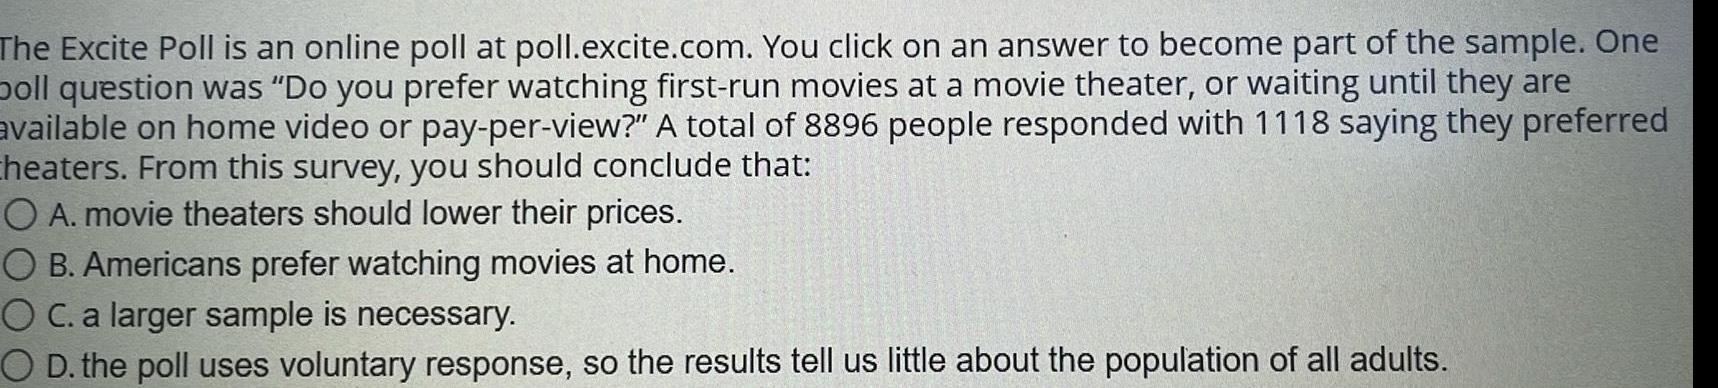
ProbabilityThe Excite Poll is an online poll at poll excite com You click on an answer to become part of the sample One poll question was Do you prefer watching first run movies at a movie theater or waiting until they are available on home video or pay per view A total of 8896 people responded with 1118 saying they preferred Cheaters From this survey you should conclude that O A movie theaters should lower their prices O B Americans prefer watching movies at home O C a larger sample is necessary O D the poll uses voluntary response so the results tell us little about the population of all adults

Statistics
StatisticsA local politician claims that one in five automobile accidents involve a teenaged driver He is advocating increasing the age at which teenagers can drive alone Over a two month period there are 67 accidents in you city and only nine of them involve a teenage driver If the politician is correct what is the chance that you would observe nine or fewer accidents involving a teenage driver OA about 0 20 B about 0 09 OC about 0 05 D about 0 16

Statistics
StatisticsA company produces precision 1 meter 1000 mm rulers The actual distribution of lengths of the rulers produced by this company is Normal with mean and standard deviation o 0 02 mm Suppose I select a simple random sample of four of the rulers produced by the company and I measure their lengths in mm The sample yields 1000 A 90 confidence interval for is OA 1000 00 0 0082 OB 1000 00 0 0115 O C 1000 00 0 0165 O D 1000 00 0 0196

Statistics
StatisticsA group of veterinary researchers plan a study to estimate the average number of enteroliths in horses suffering from them The number of enteroliths is determined by surgery or ultrasound This requires the participation of a radiologist and a surgeon in the study The researchers decide that they should only enroll horses seen at the best veterinary hospital in the country to ensure correct counts Such a hospital will typically see the most severe cases The researchers will enroll the first 20 horses seen beginning on the day the study is funded The researchers will calculate a 95 confidence interval The procedure is not valid because the O A data are counts and therefore not Normally distributed B average number is not an integer and does not reflect any actual observation C sample size is too small for the central limit theorem to apply OD None of the above The procedure is valid
Statistics
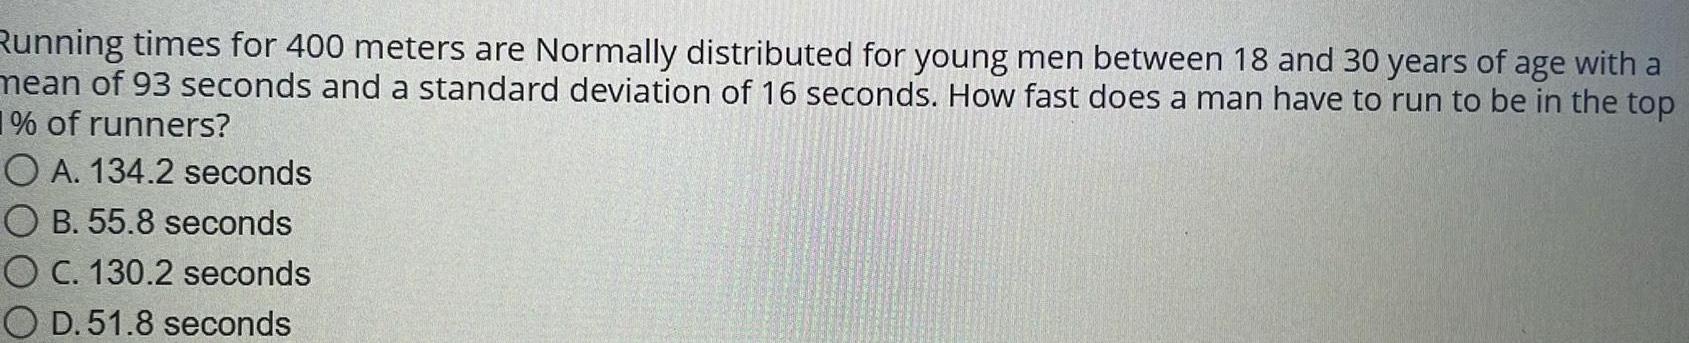
ProbabilityRunning times for 400 meters are Normally distributed for young men between 18 and 30 years of age with a mean of 93 seconds and a standard deviation of 16 seconds How fast does a man have to run to be in the top 1 of runners OA 134 2 seconds OB 55 8 seconds O C 130 2 seconds O D 51 8 seconds

Statistics
StatisticsThe time in number of days until maturity of a certain variety of tomato plant is Normally distributed with mean and standard deviation o 2 4 I select a simple random sample of four plants of this variety and measure the time until maturity The sample yields 65 You read on the package of seeds that these tomatoes reach maturity on average in 61 days You want to test to see if your seeds are reaching maturity later than expected which might indicate that your package of seeds is too old The appropriate hypotheses are O A Ho 61 Ha 61 O B Ho 65 Ha 65 O C Ho 61 Ha H 61 O D Ho 65 Ha 65

Statistics
StatisticsIn a test of statistical hypotheses the P value tells us O A if the null hypothesis is true O B the smallest level of significance at which the null hypothesis can be rejecte O C the largest level of significance at which the null hypothesis can be rejected O D if the alternative hypothesis is true
Statistics
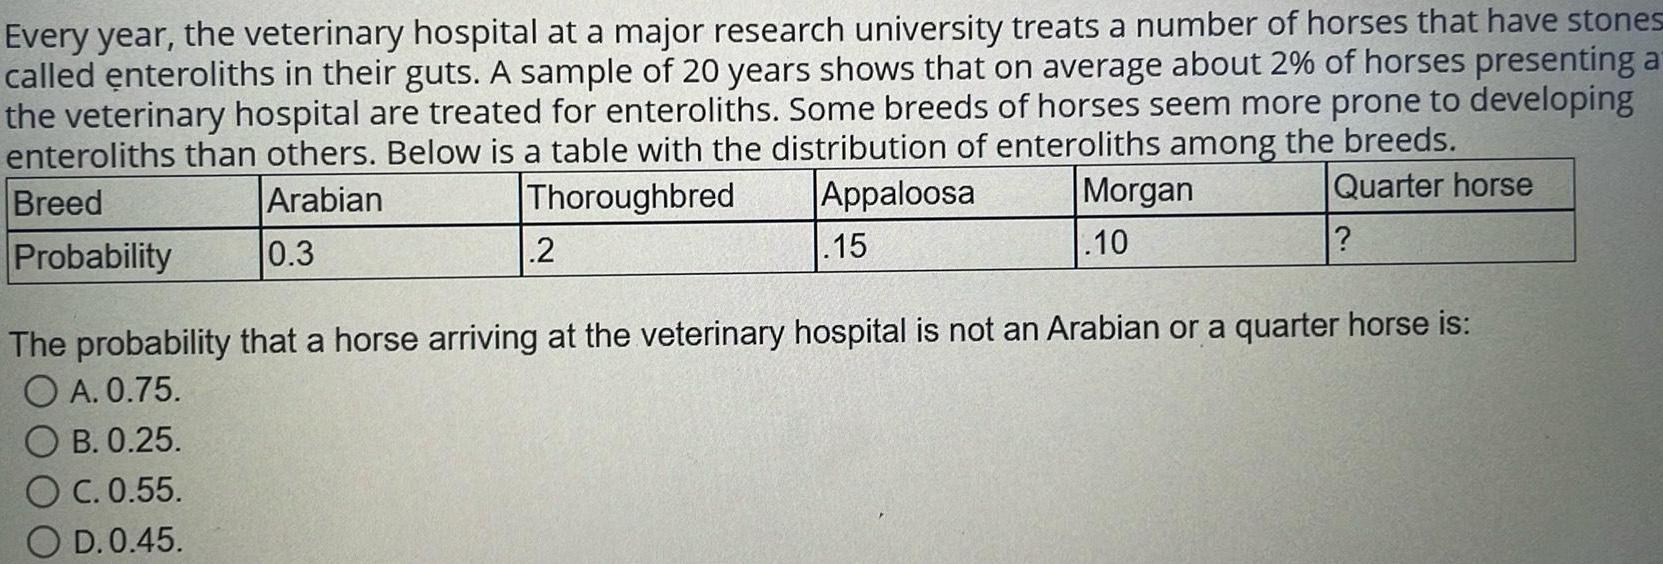
ProbabilityEvery year the veterinary hospital at a major research university treats a number of horses that have stones called enteroliths in their guts A sample of 20 years shows that on average about 2 of horses presenting a the veterinary hospital are treated for enteroliths Some breeds of horses seem more prone to developing enteroliths than others Below is a table with the distribution of enteroliths among the breeds Breed Arabian Thoroughbred Appaloosa 15 Quarter horse Probability 0 3 2 Morgan 10 The probability that a horse arriving at the veterinary hospital is not an Arabian or a quarter horse is O A 0 75 B 0 25 C 0 55 D 0 45

Statistics
StatisticsThe Survey of Study Habits and Attitudes SSHA is a psychological test that measures the motivation attitudes and study habits of college students Scores range from 0 to 200 and follow approximately a Normal distribution with mean of 110 and standard deviation o 20 You suspect that incoming freshman have a mean u which is different from 110 because they are often excited yet anxious about entering college To verify your suspicion you test the hypotheses Ho H 110 Ha 110 You give the SSHA to 50 students who are incoming freshman and find their mean score If you observe a sample mean of x 115 35 what is the corresponding P value OA 0 058 B 0 029 C 0 787 OD None of the above

Statistics
StatisticsConsider the following scatterplot which depicts the tread depth measured in mils where 1 mil 0 001 inch versus the number of miles driven on the tire measured in thousands of mile 350 300 250 200 150 0 5 10 15 Miles x 1000 20 25 30 The correlation between x and y O A is approximately 0 97 B cannot be computed because the trend is curved

Statistics
StatisticsOne hundred sixty people who suffer from painful diabetic neuropathy have volunteered to participate in a study Eighty are selected at random and are given the drug gabapentin which although originally intended to prevent epileptic seizures has properties that may make it useful to alleviate neuropathy The remaining participants are given a placebo A neurologist evaluates the symptoms of all volunteers after two months to determine if there has been substantial improvement in the severity of the symptoms Does the use of volunteers make this study invalid O A no because blocking was used O B no because the subjects are randomly assigned to treatment groups O C yes because there is no way to determine the effect of gabapentin on people that do not have symptoms of neuropathy O D yes because of volunteer bias

Statistics
StatisticsRunning times for 400 meters are Normally distributed for young men between 18 and 30 years of age with a mean of 93 seconds and a standard deviation of 16 seconds Thus 99 7 of running times are approximately between O A 45 and 141 seconds O B 61 and 125 seconds O C 77 and 109 seconds O D None of the answer options is correct

Statistics
StatisticsEnteroliths are calcifications that form in the gut of a horse The stones can cause considerable morbidity a mortality A study was conducted to investigate factors such as diet and environment that may be related t the formation of enteroliths The study contained seven stallions with their ages in years as follows 10 20 4 13 21 16 16 The youngest stallion at 4 years old is OA an outlier because it is the minimum B not an outlier because it is a positive value O C not an outlier because it is less than 15 years below the lower quartile D an outlier because it is more than 15 years below the lower quartile

Statistics
StatisticsCompute and use the least squares regression line of orc attacks on spider attacks Compute m five places after the decimal Compute b five places after the decimal For a year in which there were 10 spider attacks we predict that there were orc attacks round to nearest whole number For a year in which there were 14 spider attacks we predict that there were orc attacks round to nearest whole number For a year in which there were 7 spider attacks we predict that there were orc attacks round to nearest whole number

Statistics
Statistics2 3 5 P6 7 8 beoco on a State the null hypothesis Ho and the alternate hypothesis H HO H 0 b Determine the type of test statistic to use 10 Perform a one tailed test Then complete the parts below Carry your intermediate computations to three or more decimal places If necessary consult a list of formulas Lake Martin and Lake Fields are two large local lakes inhabited by white sturgeon A while back there was an environmental disaster at Lake Martin Yoko is an ecologist who wants to see if the mean weight in kg of adult white sturgeon now living in Lake Martin is less than the mean weight in kg of adult white sturgeon now living in Lake Fields The ecologist catches a random sample of 10 adult white sturgeon at Lake Martin and a random sample of 12 adult white sturgeon at Lake Fields These samples are chosen independently Each fish has its weight in kg recorded The white sturgeon caught at Lake Martin have a sample mean weight of 78 78 with a sample variance of 26 58 The white sturgeon caught at Lake Fields have a sample mean weight of 92 88 with a sample variance of 393 58 x Assume that the two populations of weights are approximately normally distributed Can the ecologist conclude at the 0 05 level of significance that the population mean of the weights of adult white sturgeon now living in Lake Martin is less than the population mean of the weights of adult white sturgeon now living in Lake Fields X a S P 11 Q 12 DO 13 D 0 OSO 020 14

Statistics
StatisticsAn automobile manufacturer finds that 1 in every 2000 automobiles produced has a particular manufacturing defect a Use a binomial distribution to find the probability of finding 4 cars with the defect in a random sample of 5500 cars b The Poisson distribution can be used to approximate the binomial distribution for large values of n and small values of p Repeat a using a Poisson distribution and compare the results a The probability using the binomial distribution is Round to five decimal places as needed b The probability using the Poisson distribution is Round to five decimal places as needed Compare the results Choose the correct answer below OA The probability calculated using the Poisson distribution is much larger B The two probabilities are approximately the same O The probability calculated using the binomial distribution is much ger
Statistics
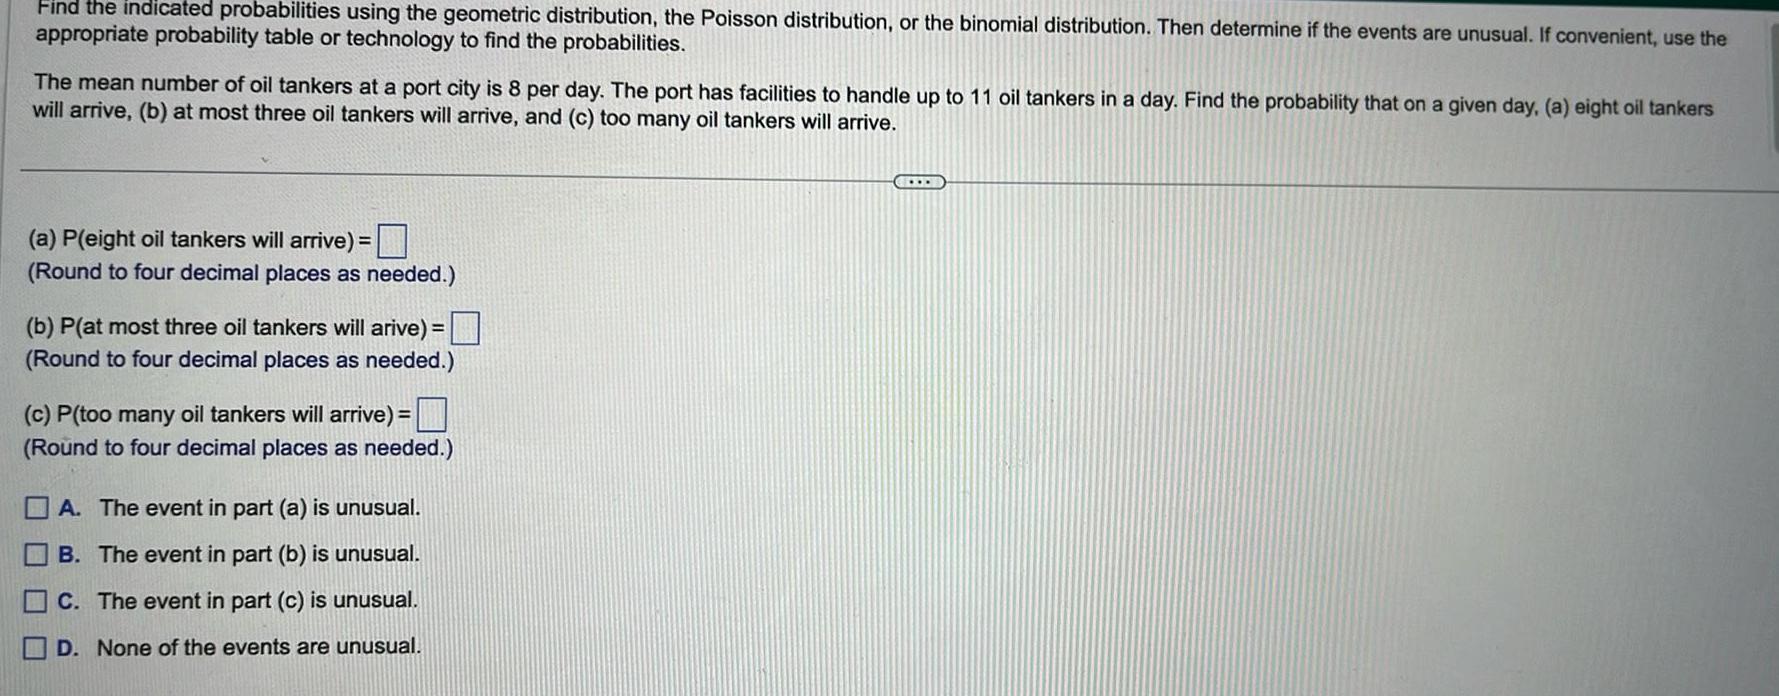
ProbabilityFind the indicated probabilities using the geometric distribution the Poisson distribution or the binomial distribution Then determine if the events are unusual If convenient use the appropriate probability table or technology to find the probabilities The mean number of oil tankers at a port city is 8 per day The port has facilities to handle up to 11 oil tankers in a day Find the probability that on a given day a eight oil tankers will arrive b at most three oil tankers will arrive and c too many oil tankers will arrive a P eight oil tankers will arrive Round to four decimal places as needed b P at most three oil tankers will arive Round to four decimal places as needed c P too many oil tankers will arrive Round to four decimal places as needed A The event in part a is unusual B The event in part b is unusual C The event in part c is unusual D None of the events are unusual

Statistics
StatisticsYou wish to test the claim that the first population mean is not equal to the second population mean at a significance level of a 0 005 Ho 1 2 Ha 12 You obtain the following two samples of data Sample 1 Sample 2 73 9 102 0 41 0 75 5 79 8 47 8 107 1 59 1 30 3 50 7 66 8 38 6 49 0 34 5 51 3 72 0 48 6 81 3 93 1 75 0 68 1 95 1 a What is the test statistic for this sample test statistic p value b What is the p value for this sample Round to 3 decimal places c The p value is Use Technology Round to 4 decimal places O less than or equal to a O greater than a

Statistics
StatisticsShow all work If a calculator function is used write out the input commands i e invNorm 0 01 0 1 A SRS of 42 students are polled and asked if their average speed exceeded the speed limit on 19th avenue From the sample 30 admit to exceeding the speed limit Using alpha a 0 05 test the claim that the proportion of students who admitted to exceeding the speed limit is less than 75 In space provided answer the following a Write the null and alternative hypothesis b State the test statistic c Show the work or state the calculator inputs to find the p value d State the conclusion in words Do not use symbols

Statistics
StatisticsYou decide to test the claim that the mean Age of TCC students is less than 30 at the 05 significance level From your sample of 89 students the mean age was 27 4 with a standard deviation of 9 2 years The alternative hypothesis is O Ha OH 30 30 O Ha p 30 The Test Statistic is The p value is Our conclusion is Ha 30 O Ha p 30 Round to 2 decimal places Round to 4 decimal places O Fail to reject our hypothesis O Reject our hypothesis O Fail to reject the null hypothesis O Reject the null hypothesis

Statistics
StatisticsGlenBluss Community College has a population mean GPA is 2 82 with population standard deviation of 1 07 for all students who have ever attended the college Find the probability a student at random will have a GPA over 3 24 Round to 4 decimal places If 5 students are chosen at random what is the probability their mean GPA will be more than 3 24 Round to the nearest whole percent

Statistics
StatisticsFrom National Testing data we find that College math class testing times are Normally distributed with 46 minutes and o 3 minutes A B C D E F G Using the 68 95 99 7 rule give the testing times for A B C D E F G One person is randomly selected from this population Using the 68 95 99 7 rule find the probability that their test time is BETWEEN 40 and 52 minutes

Statistics
StatisticsThe following data give the average price received by fishermen for several species of fish in 2000 and 2010 The price is in cents per pound Fish COD FLOUNDER HADDOCK MENHADEN PERCH CHINOOK COHO ALBACORE SOFT SHELLED CLAMS LOBSTERS AMERICAN SEA SCALLOPS SHRIMP Year 2000 Price x 13 1 15 3 25 8 1 8 4 9 55 4 39 3 26 7 47 5 94 7 135 6 47 6 a Create a regression equation for the data Year 2010 Price y 60 1 126 3 96 7 52 1 36 4 225 2 125 0 84 5 196 7 366 7 430 9 145 8 Round to 2 decimal places b What is the correlation coefficient between the 2000 and 2010 prices Round to 2 decimal places c If a type of fish was 41 3 cents per pound in 2000 how much would you expect to pay for it in 2010 c lbs Round to 1 decimal places

Statistics
StatisticsHere is a scatter plot for a set of bivariate data O O 8 c O LO O O 88 O What would you estimate the correlation coefficient to be 0 9 0 6 0 0 6 0 9
Statistics
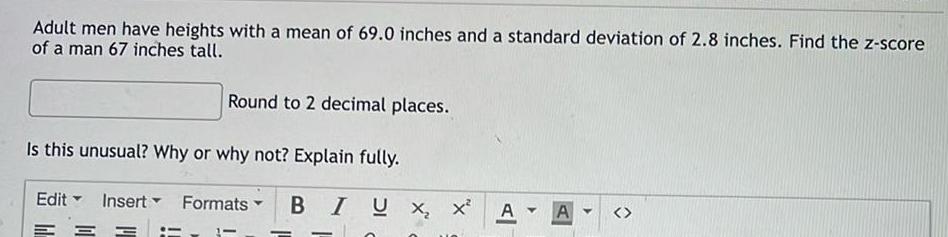
ProbabilityAdult men have heights with a mean of 69 0 inches and a standard deviation of 2 8 inches Find the z score of a man 67 inches tall Round to 2 decimal places Is this unusual Why or why not Explain fully Insert Formats Edit BIUX X A Y A

Statistics
Statisticsme 10 Find all the points on the curve x t 3t y t 3 where the tangent is horizontal or vertical xast I 200 Hoitoub 19W0 I I fst S 200 I S S 200 I S 15 200 I 1 faie 1S 200 I 1200 x fast 990919ia bas muz 200 x 2001 COA CORI se 2091 209 1 800 26C x 100 xaia x nie 1800 1 T Ast co2 1 A Co2 x 1 bbo nv 1 200 1 200 200 1209 I y 3 uie y x nie y 200 nie
