Statistics Questions
The best high school and college tutors are just a click away, 24×7! Pick a subject, ask a question, and get a detailed, handwritten solution personalized for you in minutes. We cover Math, Physics, Chemistry & Biology.

Statistics
StatisticsThe SAT Verbal Test in recent years followed approximately a normal distribution with a mean of 460 and a standard deviation of 110 The scores on the ACT English Test follow approximately a normal distribution with a mean of 17 and a standard deviation of 2 5 a Fill out the following curves for each distribution Be sure to label your set of numbers which is for which exam You can give your answers as a list of values Explain your values b What is the probability that a randomly selected student scored less than a 14 5 on the ACT English Test Explain c What is the probability that a randomly selected student scored more than a 650 on the SAT Verbal Test Explain d What is the probability that a randomly selected student scored between a 13 and a 20 on the ACT English Test Explain e Joey took the SAT Verbal Test and made a score of 550 Sarah took the ACT English Test and made a score of 18 Find the z score for each student to determine who made the score Explai
Statistics
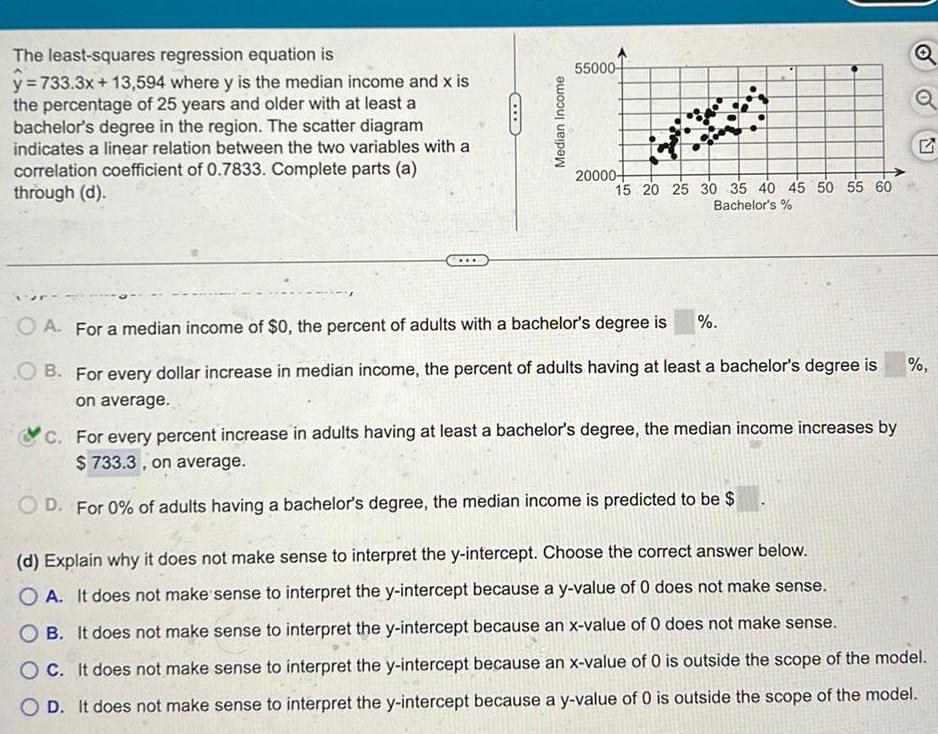
ProbabilityThe least squares regression equation is y 733 3x 13 594 where y is the median income and x is the percentage of 25 years and older with at least a bachelor s degree in the region The scatter diagram indicates a linear relation between the two variables with a correlation coefficient of 0 7833 Complete parts a through d Median Income 55000 20000 15 20 25 30 35 40 45 50 55 60 Bachelor s OA For a median income of 0 the percent of adults with a bachelor s degree is OB For every dollar increase in median income the percent of adults having at least a bachelor s degree is on average C For every percent increase in adults having at least a bachelor s degree the median income increases by 733 3 on average D For 0 of adults having a bachelor s degree the median income is predicted to be Q Q d Explain why it does not make sense to interpret the y intercept Choose the correct answer below OA It does not make sense to interpret the y intercept because a y value of 0 does not make sense OB It does not make sense to interpret the y intercept because an x value of 0 does not make sense OC It does not make sense to interpret the y intercept because an x value of 0 is outside the scope of the model D It does not make sense to interpret the y intercept because a y value of 0 is outside the scope of the model

Statistics
StatisticsExplain what each point on the least squares regression line represents Choose the correct answer below OA Each point on the least squares regression line represents the predicted y value at the corresponding value o X OB Each point on the least squares regression line represents the y values that would be considered ideal at that corresponding value of x OC Each point on the least squares regression line represents the y value of the data set at that corresponding value of x O D Each point on the least squares regression line represents one of the points in the data set

Statistics
Statisticsthere a relation between the age difference between husband wives and the percent of a country that is literate esearchers found the least squares regression between age difference husband age minus wife age y and litera ate percent of the population that is literate x is y 0 0574x 8 3 The model applied for 19 x 100 Complete arts a through e below Interpret the slope Select the correct choice below and fill in the answer box to complete your choice or every unit increase in falls by units on average ype an integer or decimal Do not round the literacy rate

Statistics
StatisticsWhat is a residual What does it mean when a residual is positive Choose the correct answer below OA A residual is the difference between an observed value of the response variable y and the predicted value of If it is positive then the observed value is greater than the predicted value OB A residual is the difference between an observed value of the response variable y and the average value of th response variable If it is positive then the response variable is greater than the mean OC A residual is the difference between an observed value of the response variable y and the value of the corresponding explanatory variable x If it is positive then the response variable is greater than the explanato variable OD A residual is a data point that does not fit the pattern of the rest of the data If it is positive then the data point should still be included in the data set

Statistics
StatisticsIf the linear correlation between two variables is negative what can be said about the slope of the regression line Choose the correct answer below O A Positive OB More information is needed C Negative

Statistics
Statisticsr 0 933 Choose the correct graph below OA Response Q Q OB Response to the scatter diagram N O C Response O Q OD Response

Statistics
ProbabilityMatch the linear correlation coefficient to the scatter diagram The scales on the x and y axis are the same for each scatter diagram a r 0 810 b r 1 c r 0 049 a Scatter diagram b Scatter diagram c Scatter diagram Response Response 3 Explanatory Explanatory

Statistics
ProbabilityThe linear correlation between violent crime rate and percentage of the population that has a cell phone is 0 918 for years since 1995 Do you believe that increasing the percentage of the population that has a cell phone will decrease the violent crime rate What might be a lurking variable between percentage of the population with a cell phone and violent crime rate Will increasing the percentage of the population that has a cell phone decrease the violent crime rate Choose the best option below O No O Yes

Statistics
StatisticsDetermine whether the scatter diagram indicates that a linear relation may exist between the two variables If the relation is linear determine whether it indicates a positive or negative association between the variables Use this information to answer the following Do the two variables have a linear relationship O A The data points do not have a linear relationship because they lie mainly in a straight line Response 400 300 200 100 0 0 N 2 4 6 Explanatory GO 8 10 G B The data points have a linear relationship becaus they do not lie mainly in a straight line OC The data points have a linear relationship because OD The data points do not have a linear relationship they lie mainly in a straight line because they do not lie mainly in a straight line

Statistics
StatisticsWhat is the difference between univariate data and bivariate data Choose the correct answer below OA In univariate data there is one mean In bivariate data there are two means OB In univariate data a single variable is measured on each individual In bivariate data two variables are measured on each individual OC In univariate data there are only positive values and zeros In bivariate data there are positive values ne values and zeros D In univariate data the data are qualitative In bivariate data the data are quantitative

Statistics
ProbabilityIn a sample of 900 U S adults 189 think that most celebrities are good role models Two U S adults are selected from this sample without replacement Complete parts a through c a Find the probability that both adults think most celebrities are good role models The probability that both adults think most celebrities are good role models is 0 044 Round to three decimal places as needed b Find the probability that neither adult thinks most celebrities are good role models The probability that neither adult thinks most celebrities are good role models is 0 624 Round to three decimal places as needed c Find the probability that at least one of the two adults thinks most celebrities are good role models The probability that at least one of the two adults thinks most celebrities are good role models is Round to three decimal places as needed

Statistics
StatisticsBased on a poll among adults who regret getting tattoos 21 say that they were too young when they got their tattoos Assume that seven adults who regret getting tattoos are randomly selected and find the indicated probability Complete parts a through d below a Find the probability that none of the selected adults say that they were too young to get tattoos Round to four decimal places as needed b Find the probability that exactly one of the selected adults says that he or she was too young to get tattoos Round to four decimal places as needed c Find the probability that the number of selected adults saying they were too young is 0 or 1 Round to four decimal places as needed d If we randomly select seven adults is 1 a significantly low number who say that they were too young to get tattoos because the probability that 0 05 www greater than of the selected adults say that they were too young is

Statistics
ProbabilityIf np 25 and nq 25 estimate P fewer than 6 with n 13 and p 0 5 by using the normal distribution as an approximation to the binomial distribution if np 5 or nq 5 then state that the normal approximation is not suital Select the correct choice below and if necessary fill in the answer box to complete your choice OA P fewer than 6 Round to four decimal places as needed OB The normal approximation is not suitable

Statistics
ProbabilityIn a genetics experiment on peas one sample of offspring contained 444 green peas and 29 yellow peas Based o those results estimate the probability of getting an offspring pea that is green Is the result reasonably close to the value of that was expected 3 4 The probability of getting a green pea is approximately Type an integer or decimal rounded to three decimal places as needed Is this probability reasonably close to COC OA No it is not reasonably close OB Yes it is reasonably close 3 2 Choose the correct answer below

Statistics
ProbabilityLet event A subject is telling the truth and event B polygraph test indicates that the subject is lying Use your own words to translate the notation P BIA into a verbal statement Choose the correct option below OA The probability that the polygraph indicates lying given that the subject is actually lying OB The probability that the polygraph indicates truthfulness given that the subject is actually lying OC The probability that the polygraph indicates truthfulness given that the subject is actually telling the truth OD The probability that the polygraph indicates lying given that the subject is actually telling the truth

Statistics
StatisticsUse the Applying the Multiplication Rule flow chart interactive to answer the following question Two different days of the week are randomly selected without replacement Let W be the event of selecting Wednesday on the first selection and let F be the event of selecting Friday on the second selection When finding th probability that events W and F both occur which formula applies Choose the correct answer below O A P A and B P A P B O B P A and B P A P B A OC P A and B P A P B O D P A and B P A P BIA 9

Statistics
ProbabilityMy courses My Media Event Land on pink Landing on pink and 3 Landing on a pink or yellow Landing on a yellow or an odd number Landing of blue and odd Use B for blue P for pink Y for yellow You can use words for or and and Use a space between letters and conjunctions A 11 11 Probability Enter as reduced fraction Probability Enter as reduced fraction

Statistics
ProbabilityThe amount of time adults spend watching television is closely monitored by firms because this helps to determine advertising pricing for commercials Complete parts a through d a Do you think the variable weekly time spent watching television would be normally distributed If not what shape would you expect the variable to have A The variable weekly time spent watching television is likely uniform not normally distributed B The variable weekly time spent watching television is likely symmetric but not normally distributed OC The variable weekly time spent watching television is likely normally distributed D The variable weekly time spent watching television is likely skewed right not normally distributed E The variable weekly time spent watching television is likely skewed left not normally distributed b According to a certain survey adults spend 2 45 hours per day watching television on a weekday Assume that the standard deviation for time spent watching television on a weekday is 1 93 hours If a random sample of 40 adults is obtained describe the sampling distribution of x the mean amount of time spent watching television on a weekday x is approximately normal with Hx 2 45 and ox 0 305160 Round to six decimal places as needed c Determine the probability that a random sample of 40 adults results in a mean time watching television on a weekday of between 2 and 3 hours The probability is 0 8941 Round to four decimal places as needed d One consequence of the popularity of the Internet is that it is thought to reduce television watching Suppose that a random sample of 35 individuals who consider themselves to be avid Internet users results in a mean time of 2 03 hours watching television on a weekday Determine the likelihood of obtaining a sample mean of 2 03 hours or less from a population whose mean is presumed to be 2 45 hours

Statistics
ProbabilityProbability The value of n is 5 Type an integer or a decimal Do not round ased on a survey assume that 46 of consumers are comfortable having drones deliver their purchases consumers are randomly selected exactly three of them are comfortable with delivery by drones Identify the values of n x p The value of x is 3 Type an integer or a decimal Do not round The value of pis Part integer or a decimal Do not round COLLE

Statistics
ProbabilityBased on a survey assume that 46 of consumers are comfortable having drones deliver their purchases Suppose that we want to find the probability that when five consumers are randomly selected exactly three of them are comfortable with delivery by drones Identify the values of n x p and q The value of n is 5 Type an integer or a decimal Do not round The value of x is Type an integer or a decimal Do not round

Statistics
Probability40 3 of consumers believe that cash will be obsolete in the next 20 years Assume that 6 consumers are randomly selected Find the probability that fewer than 3 a the selected consumers believe that cash will be obsolete in the next 20 years pints 0 of 1 The probability is Round to three decimal places as needed Save

Statistics
StatisticsIl a procedure meets all of the conditions of a binomial distribution except the number of trials is not fixed then the geometric distribution can be used The probability of getting the first success on the xth trial is given by P x p 1 p 1 where p is the probability of success on any one trial Subjects are randomly selected for a health survey The probability that someone is a universal donor with group O and type Rh negative blood is 0 09 Find the probability that the first subject to be a universal blow donor is the eighth person selected The probability is Round to four decimal places as needed 0 of 1 Save

Statistics
Probability39 596 of consumers believe that cash will be obsolete in the next 20 years Assume that 6 consumers are randomly selected Find the probability that fewer thar selected consumers believe that cash will be obsolete in the next 20 years The probability is Round to three decimal places as needed Qus HW Score 38 46 5 of 13 points O Points 0 of 1

Statistics
StatisticsO Points 0 of 1 Ilom a small finite population without replacement the binomial distribution should not be used because the events are not independent If sampling is without replacement and the outcomes belong to one of two types we can use the hypergeometric distribution If a population has A objects of one type while the re B objects are of the other type and if n objects are sampled without replacement then the probability of getting x objects of type A and n x objects of type B under t hypergeometric distribution is given by the following formula In a lottery game a bettor selects four numbers from 1 to 50 without repetition and a winning four num combination is later randomly selected Find the probabilities of getting exactly two winning numbers with one ticket Hint Use A 4 B 46 n 4 and x 2 P x A BI A B A x x B n x n x A B n n P 2 Round to four decimal places as needed SID points

Statistics
Statistics1 Use the following data set to answer the following question 18 21 24 27 33 36 48 50 52 54 57 76 82 85 88 91 Find the interquartile range of the data Interquartile range

Statistics
Statistics15 What are the quartiles of the data X XXX X X 58 O 60 5 72 O 66 O 60 5 66 72 60 62 64 X X X 66 68 70 72

Statistics
StatisticsThe following table gives the annual revenue for two different companies in billions of dollars for a 10 year pe What is the five number summary for Company A Year Company A Company B 2007 2008 2009 2010 2011 2012 2013 2014 2015 2016 109 95 103 102 110 105 99 70 74 99 86 77 48 58 55 75 75 90 85 84 What is the five number summary for company A Min Q Type integers or decimals Q2 Q3 Max

Statistics
Statistics11 Use the following data set to answer the following question 34 37 39 41 43 46 48 51 58 61 63 65 67 70 72 75 Find any outliers 34 and 75 O 75 O 72 O 34 34 and 37 O There are no outliers

Statistics
Statistics5 Find the critical z values Assume that the normal distribution applies a Two tailed test a 0 03 b Two tailed test a 0 02 c Right tailed test a 0 03 d Left tailed test a 0 02 e a 0 10 H is p 0 17 f a 0 01 H is p 0 18 g a 0 04 H is p 0 19 h a 0 005 H is p 0 20 6 Use the given information to find the P value a The test statistic in a right tailed test is z 1 00 b The test statistic in a left tailed test is z 2 00 c The test statistic in a two tailed test is z 1 96 0 d The test statistic in a two tailed test is z 0 50 e With H p 0 333 the test statistic is z 1 50 0 f With H p 0 6667 the test statistic is z 2 05 0 g With H p 1 4 the test statistic is z 1 75 0 h With H p 2 3 the test statistic is z 0 45 0

Statistics
Statistics12 The following are the low temperatures in Colorado for several cities across the state 73 63 48 58 53 48 43 73 63 38 78 43 28 58 88 63 Find any outliers 28 and 88 O 28 78 and 88 O 88 28 and 38 O There are no outliers

Statistics
Statistics9 The following are the low temperatures in Iowa for several cities across the state 74 64 52 62 60 52 50 74 64 48 76 50 38 62 86 64 Find the mean median and mode for the temperatures Mean Median Mode x

Statistics
Statistics3 The following are the low temperatures in Idaho for several citi across the state 72 63 53 62 61 53 52 72 63 51 73 52 42 62 82 63 Find the quartiles for the temperatures Lower quartile Median Upper quartile x

Statistics
Statistics2 The following are the low temperatures in Ohio for several cities across the state 73 62 48 59 56 48 45 73 62 42 76 45 31 59 87 62 Find the range and interquartile range of the low temperatures Range Interquartile Range

Statistics
Statistics13 What is the standard deviation of the data set 18 30 48 36 30 18 O 10 89 O 13 39 O 10 39

Statistics
Statistics14 What is the outlier of the data 73 XXXXXX O 57 73 and 57 58 60 62 None X 64 66 68 70 72 X

Statistics
StatisticsAssume that the distribution of starting salaries for accounting majors is normally distributed with mean 45 000 standard deviation 3 300 What is the probability that an individual will start at a salary above 52 000 Click here for page 1 of the Areas under the Normal Curve Table Click here for page 2 of the Areas under the Normal Curve Table The probability that an individual will start at a salary above 52 000 is Round to four decimal places as needed

Statistics
Statistics4 Use the stem and leaf plot below to answer the following question Stem 2 3 4 5 6 Leaves 1778 249 3775 1112 56 Find the mode of the data Mode

Statistics
Statistics10 Use the following data set to answer the question 15 20 39 27 33 15 23 28 Find the mean of the data

Statistics
Probability7 Use the stem and leaf plot below to answer the following question Stem Leaves 2 3 4 5 6 3566 01 25 578 23334 Find the mean of the data Round the answer to the nearest tenth Mean

Statistics
Statistics5 Use the following data set to answer the question 55 37 52 27 29 16 24 32 Find each difference between the data entries and the mean

Statistics
Statistics8 Use the following data set to answer the following question 42 44 46 48 52 54 58 59 61 62 64 71 75 77 79 81 Find the range of the data Range

Statistics
ProbabilityThe acc mpanying table shows the numbers of male and female students in a particular country who received bachelor s degrees in business in a recent year Complete parts a and b below Click the icon to view the data on business degrees a Find the probability that a randomly selected student is male given that the student received a business degree The probability that a randomly selected student is male given that the student received a business degree is Round to three decimal places as needed Business Graduates Male Female Total Business degrees Nonbusiness degrees 187 599 613 528 173 574 864 512 361 173 1 478 040 Total 801 127 1 038 086 1 839 213 X K

Statistics
StatisticsMonica a chef at a 5 star restaurant makes eight different desserts She wants to see if the customers prefer any specific dessert to another She keeps a record of desserts ordered over the course of several weeks and the results are located under Dessert Preference data file Complete the following table istrier Dessert Chocolate Mousse Baked Alaska Orange Cheesecake Caramel Flan Banana Broulee Mississippi Mud Pie Ricotta Cannoli French Walnut Torte Total 7 3 4 What is the test value Frequency Observed Value 25 12 23 32 40 20 38 34 224 I Frequency Expected Value 28 28 28 28 28 28 28 28 28 1 In order to see if the orders are equally distributed what type of test you need to conduct 2 What is the H alternate hypothesis What is critical value for 0 01 significant levels 5 What is your decision 6 Can we conclude that orders are equally distributed Is there any type of dessert significantly more preferred than others Relative Frequency Cumulative Frequency

Statistics
StatisticsK The data given below show the number of overtime hours worked in one week per employee Use the data to complete parts a and b Overtime hours 1 3 4 5 Employees 13 53 46 26 a Construct a probability distribution b Graph the probability distribution using a histogram and describe its shape a Construct the probability distribution by completing the table below X P x O A Probability 0 8 0 0 042 0 4 0 3 02 0 1 0 2 28 b Choose the correct graph of the probability distribution 0123456 Overtime Hours 1 2 3 4 5 0 135 0 068 0 146 0 276 0 240 Round to three decimal places as needed k O B Probability 0 4 0 3 0 2 0 1 0 6 0 094 6 18 0123456 Overtime Hours C C O C Probability 0 4 0 3 02 0 1 0 0123456 Overtime Hours OD 0 4 0 3 0 2 a 0 1 0 Probability 0123456 Overtime Hours
Statistics
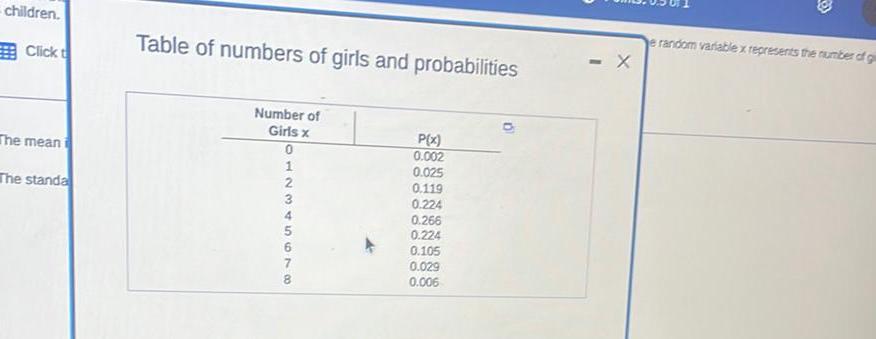
Probabilitychildren Click t The mean The standa Table of numbers of girls and probabilities Number of Girls x 0 12345678 P x 0 002 0 025 0 119 0 224 0 266 0 224 0 105 0 029 0 006 X e random variable x represents the number of g

Statistics
StatisticsYoung s modulus is a quantitative measure of stiffness of an elastic material Suppose that for aluminum alloy sheets of a particular type its mean value and standard deviation are 70 GPa and 1 6 GPa respectively values given in the article Influence of Material Properties Variability on Springback and Thinning in Sheet Stamping Processes A Stochastic Analysis Intl J of Advanced Manuf Tech 2010 117 134 a If X is the sample mean Young s modulus for a random sample of n 64 sheets where is the sampling distribution of X centered and what is the standard deviation of the X distribution E X GPa GPa 0x b Answer the questions posed in part a for a sample size of n 256 sheets E X ox GPa GPa c For which of the two random samples the one of part a or the one of part b is X more likely to be within 1 GPa of 70 GPa Explain your reasoning OX is more likely to be within 1 GPa of the mean in part a This is due to the decreased variability of X that comes with a smaller sample size OX is more likely to be within 1 GPa of the mean in part b This is due to the decreased variability of X that comes with a larger sample size X is more likely to be within 1 GPa of the mean in part b This is due to the increased variability of X that comes with a larger sample size OX is more likely to be within 1 GPa of the mean in part a This is due to the increased variability of X that comes with a smaller sample size
Statistics
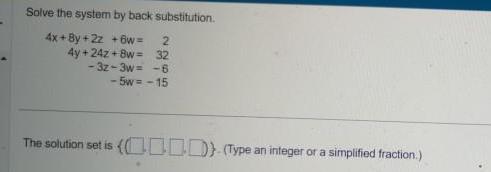
ProbabilitySolve the system by back substitution 4x By 2z 6w 2 4y 24z 8w 32 32 3w 6 5w 15 The solution set is 0 Type an integer or a simplified fraction

Statistics
Probabilityatch the histograms on the right to the summary statistics given I 11 IV a b c d Mean 60 65 60 60 Median 60 65 60 60 Standard Deviation 1 6 12 9 20 Frequency Frequency Frequency ncy 20 10 0 30 40 50 60 70 80 90 a 20 10 0 F 55 57 20 59 61 b 10 63 65 0 40 50 60 70 80 90 c Q 2 Q N O G O O

Statistics
StatisticsMatch the histograms on the right to the summary statistics given IV Mean 59 69 59 59 a AR b d Median 59 69 59 59 Standard Deviation 2 2 11 10 19 Frequency Frequency Frequency ncy 54 56 58 60 62 64 a 10 29 39 49 59 69 79 89 b 20 10 44 10 54 64 74 c 84 94 Q Q 5 O