Statistics Questions
The best high school and college tutors are just a click away, 24×7! Pick a subject, ask a question, and get a detailed, handwritten solution personalized for you in minutes. We cover Math, Physics, Chemistry & Biology.

Statistics
ProbabilityThere is a 0 99968 probability that a randomly selected 22 year old female lives through the year An insurance company wants to offer her a one year policy with a death benefit of 1 000 000 How much should the company charge for this policy if it wants an expected return of 400 from all similar policies The company should charge Round to the nearest dollar

Statistics
Statisticsto the ren Click t mean i Table of numbers of girls and probabilities Number of Girls x 0 12345678 P x 0 002 0 025 0 119 0 224 0 266 0 224 0 105 0 029 0 006 X e random variable x represents the number of

Statistics
ProbabilityIn a survey cell phone users were asked which ear they use to hear their cell phone and the table is based on their responses Determine whether a probably distribution is given It a probability distribution is given find its mean and standard deviation it a probability distribution is not givent identity the requirements that are not satisfiedk Find the mean of the random variable x Select the correct choice below and it necessary fill in the answer box to complete your choice OA Ha WITH Round to one decimal place as needed B The table does not show a probability distribution Find the standard deviation of the random variablex Select the correct choice below and it necessary fill in the answer box to complete your choice OA GE Round to one decimal place as needed OB The table does not show a probability distribution Leit Right No preference F 08 0 30 0 08
Statistics
ProbabilityIn a state s lottery you can bet 3 by selecting three digits each between 0 and 9 inclusive If the same three numbers are 600 Complete parts a through e a How many different selections are possible 1000 b What is the probability of winning Simplify your answer

Statistics
Probabilitypanying table which describes the number of adults in groups of five who reported sleepwalking Find the mean and standard deviation for the numbers eepwalkers in groups of five Click t Table of numbers of sleepwalkers and probabilities he mean 1244TOX 0 3 5 P x 0 184 0 359 0 296 0 128 0 031 0 002 X

Statistics
ProbabilitySuppose that textbook weights are normally distributed You measure 44 textbooks weights and find they have a mean weight of 63 ounces Assume the population standard deviation is 2 2 ounces Based on this construct a 95 confidence interval for the true population mean textbook weight Round answers to 2 decimal places Select an answer Select an answer 0

Statistics
ProbabilityA corporation must appoint a president chief executive officer CEO chief operating officer COO and chief financial officer CFO It must also appoint a planning committee with five different members There are 13 qualified candidates and officers can also serve on the committee Complete parts a through c below a How many different ways can the officers be appointed There are 17160 different ways to appoint the officers b How many different ways can the committee be appointed There are 1287 different ways to appoint the committee c What is the probability of randomly selecting the committee members and getting the five youngest of the qualified candidates P getting the five youngest of the qualified candidates Type an integer or a simplified fraction

Statistics
StatisticsAfter giving a statistics exam Professor Dang determined the following five number summary for her class results 55 63 73 86 95 Use this information to draw a boxplot of the exam scores Choose the correct graph below OA 60 Scores 80 Percent 100 5 O B 60 Scores 80 Percent 100 Q Q O C 60 Scores 80 Percent 100 Q 2

Statistics
StatisticsOne year Todd had the lowest ERA earned run average mean number of runs yielded per nine innings pitched of an male pitcher at his school with an ERA of 3 25 Also Betty had the lowest ERA of any female pitcher at the school with an ERA of 3 24 For the males the mean ERA was 3 928 and the standard deviation was 0 964 For the females the mean ERA was 3 882 and the standard deviation was 0 776 Find their respective z scores Which player had the bette year relative to their peers Todd or Betty Note In general the lower the ERA the better the pitcher Todd had an ERA with a z score of Betty had an ERA with a z score of Round to two decimal places as needed Which player had a better year in comparison with their peers OA Todd had a better year because of a lower z score OB Todd had a better year because of a higher z score OC Betty had a better year because of a higher z score OD Betty had a better year because of a lower z score

Statistics
StatisticsIn a rugby match a tie at the end of two overtime periods leads to a shootout with five kicks taken by each team from the center of the 22 meter line Each kick must be taken by a different player How many ways can 5 players be selected from the 15 eligible players For the 5 selected players how many ways can they be designated a first second third fourth and fifth 5 players can be selected from the 15 eligible players in first second third fourth and fifth in different ways Type whole numbers CEED different ways Out of those 5 players that are selected they can be designated as

Statistics
StatisticsComplete the paragraph The standard deviation is used in conjunction with the The distribution measures the center of the distribution while the standard deviation measures the Choose the correct answers below The standard deviation is used in conjunction with the shaped The of the distribution to numerically describe distributions that are bell shaped of the XXXS to numerically describe distributions that are bell measures the center of the distribution while the standard deviation measures the

Statistics
StatisticsWhat does the symbol I represent The five starting players of an NBA basketball team can stand in a line 51 different ways so what is the actual number of ways that the tive players can stand in a line ED What does the symbol I represent A The symbol I is the factorial symbol It represents the product of decreasing positive whole numbers OB The symbol I is the symbol for the multiplication counting rule It is used to find the total number of possibilities from some sequence of events OC The symbol I is the permutation symbol It represents items as arrangements in which different sequences of the same items are counted separately OD The symbol I is the combinations symbol It represents items as arrangements in which different sequences of the same items are counted as being the same The five starting players of an NBA basketball team can stand in a line 51 different ways so what is the actual number of ways that the five players can stand in a line 51 Type a whole number

Statistics
ProbabilityA Social Security number consists of nine digits in a particular order and repetition of digits is allowed After seeing the last four digits printed on a receipt if you randomly select the other digits what is the probability of getting the correct Social Security number of the person who was given the receipt The probability is Type an integer or a simplified fraction

Statistics
Statistics65 The data represent the age of world leaders on their day of inauguration Find the five number summary and construct a boxplot for the data Comment on the shape of 68 the distribution 48 52 The five number summary is Use ascending order Choose the correct boxplot of the data below O A 30 40 50 60 70 80 90 5 O B TTT 30 40 50 60 70 80 90 2 Choose the correct description of the shape of the distribution O A The distribution is roughly symmetric OB The distribution is skewed to the left OC The distribution is skewed to the right D The shape of the distribution cannot be determined from the boxplot O C 43 69 53 65 62 67 57 67 T 30 40 50 60 70 80 90 44 54 61 Q Q

Statistics
StatisticsIn 1994 major league baseball players went on strike At the time the average salary was 1 049 589 and the median salary was 337 500 If you were representing the owners which summary would you use to convince the public that a strike was not needed If you were a player which would you use Why was there such a large discrepancy between the mean and median salaries Explain Select the correct answers below If you were representing the owners you would use the needed If you were a player you would use the average and median salaries differ so greatly because to convince the public that a strike was not to convince the public that a strike was needed The the distribution of salaries is skewed right the distribution of salaries is skewed left the mean is resistant to outliers but the median is not

Statistics
StatisticsExplain the meaning of the following percentiles in parts a and b a The 10th percentile of the weight of males 36 months of age in a certain city is 11 0 kg b The 90th percentile of the length of newborn females in a certain city is 54 3 cm a Choose the correct answer below OA 10 of males weigh 11 0 kg or less and 90 of 36 month old males weigh more than 11 0 kg OB 10 of 36 month old males weigh 11 0 kg or more and 90 of 36 month old males weigh less than 11 0 kg O C 10 of males weigh 11 0 kg or more and 90 of 36 month old males weigh less than 11 0 kg OD 10 of 36 month old males weigh 11 0 kg or less and 90 of 36 month old males weigh more than 11 0 kg b Choose the correct answer below OA 90 of females have a length of 54 3 cm or less and 10 of newborn females have a length that is more tha 54 3 cm OB 90 of newborn females have a length of 54 3 cm or less and 10 of newborn females have a length that is more than 54 3 cm OC 90 of newborn females have a length of 54 3 cm or more and 10 of newborn females have a length that is less than 54 3 cm OD 90 of females have a length of 54 3 cm or more and 10 of newborn females have a length that is less than 54 3 cm
Statistics
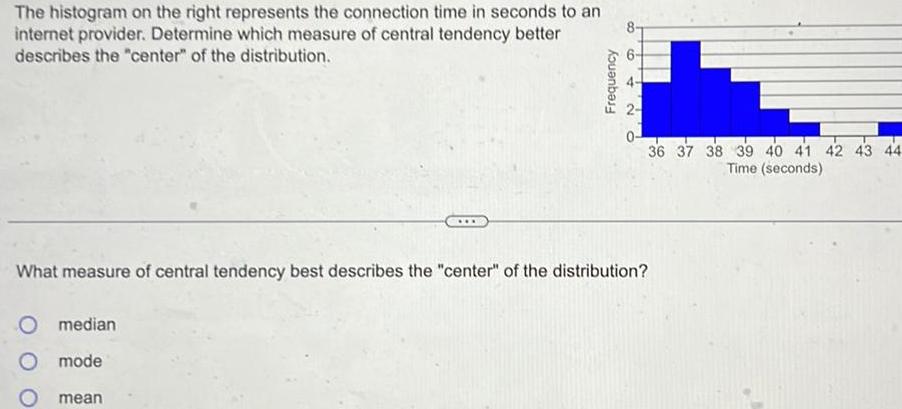
StatisticsThe histogram on the right represents the connection time in seconds to an internet provider Determine which measure of central tendency better describes the center of the distribution CO mean Frequency NA 0 36 37 38 39 40 41 42 43 44 Time seconds What measure of central tendency best describes the center of the distribution O median mode

Statistics
Statistics58 The data represent the age of world leaders on their day of inauguration Find the five number summary and construct a boxplot for the data Comment on the shape of 63 the distribution 48 55 The five number summary is 46 48 55 61 64 Choose the correct boxplot of the data below O A OB 40 50 60 70 Q 40 50 60 70 Q O C 40 50 64 61 46 49 62 50 47 55 60 70 56 52 48 Q Q

Statistics
StatisticsWhich of the accompanying boxplots likely has the data with the larger standard deviation Why Click the icon to view the boxplots Choose the correct answer below OA Boxplot I likely has the data with the larger standard deviation because the values associated with Boxplot I are larger than the values associated with Boxplot II which likely results in a larger standard deviation O B Boxplot I likely has the data with the larger standard deviation because the IQR is smaller than that of Boxplot II which likely results in a larger standard deviation OC Boxplot II likely has the data with the larger standard deviation because the boxplot appears to have a greater spread which likely results in a larger standard deviation O D Boxplot II likely has the data with the larger standard deviation because the median is less than the median of Boxplot I which likely results in a larger standard deviation

Statistics
Statisticsa Identify the shape of the distribution and b determine the five number summary Assume that each number in the five number summary is an integer 10 20 a Choose the correct answer below for the shape of the distribution OA The distribution is skewed right B The distribution is skewed left C The distribution is roughly symmetric D The shape of the distribution cannot be determined from the boxplot
Statistics
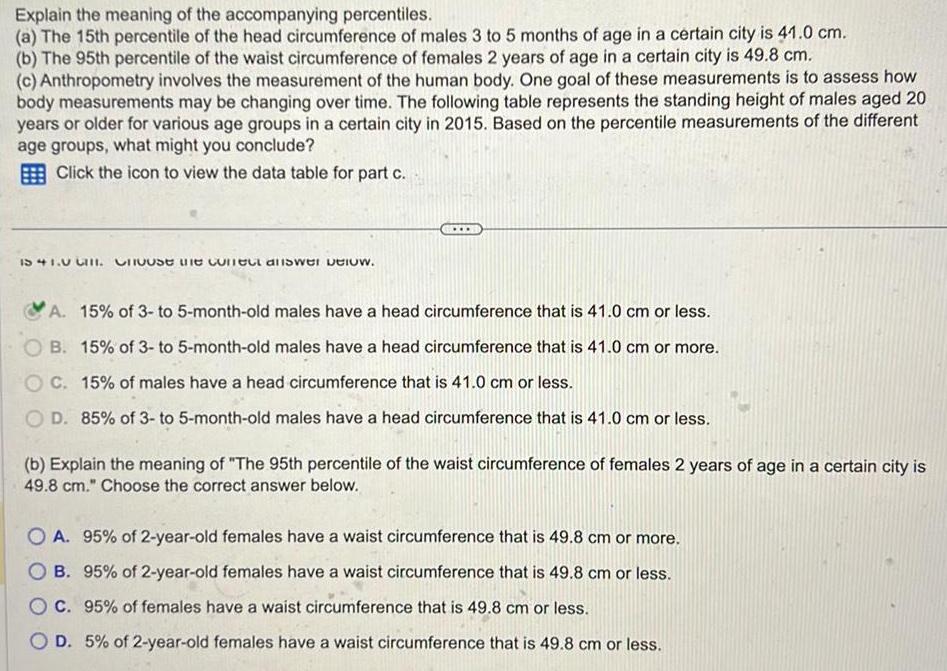
StatisticsExplain the meaning of the accompanying percentiles a The 15th percentile of the head circumference of males 3 to 5 months of age in a certain city is 41 0 cm b The 95th percentile of the waist circumference of females 2 years of age in a certain city is 49 8 cm c Anthropometry involves the measurement of the human body One goal of these measurements is to assess how body measurements may be changing over time The following table represents the standing height of males aged 20 years or older for various age groups in a certain city in 2015 Based on the percentile measurements of the different age groups what might you conclude Click the icon to view the data table for part c IS 41 G Choose the correct answer below A 15 of 3 to 5 month old males have a head circumference that is 41 0 cm or less OB 15 of 3 to 5 month old males have a head circumference that is 41 0 cm or more C 15 of males have a head circumference that is 41 0 cm or less OD 85 of 3 to 5 month old males have a head circumference that is 41 0 cm or less b Explain the meaning of The 95th percentile of the waist circumference of females 2 years of age in a certain city is 49 8 cm Choose the correct answer below OA 95 of 2 year old females have a waist circumference that is 49 8 cm or more B 95 of 2 year old females have a waist circumference that is 49 8 cm or less OC 95 of females have a waist circumference that is 49 8 cm or less OD 5 of 2 year old females have a waist circumference that is 49 8 cm or less

Statistics
StatisticsThe following graph is an ogive of a standardized test s scores The vertical axis in an ogive is the cumulative relative frequency and can also be interpreted as a percentile Complete parts a through c Percentile 100 80 60 40 20 Percentile Ranks of Test Scores 0 90 110 130 150 170 190 Test Score Q Q a Find and interpret the percentile rank of a test score with a value of 140 A test score of 140 corresponds to the th percentile rank since this percentage of test scores a test score with a are value of 140

Statistics
StatisticsExplain the circumstances for which the interquartile range is the preferred measure of dispersion What is an advantage that the standard deviation has over the interquartile range Choose the correct answer below O A The interquartile range is preferred when the distribution is symmetric An advantage of the standard deviation is that it is resistant to extreme values O B The interquartile range is preferred when the data are bell shaped An advantage of the standard deviation is that it increases as the dispersion of the data increases OC The interquartile range is preferred when the data are bell shaped An advantage of the standard deviation is that it is resistant to extreme values OD The interquartile range is preferred when the data are not skewed or no have outliers An advantage of the standard deviation is that it uses all the observations in its computation O E The interquartile range is preferred when the distribution is symmetric An advantage of the standard deviation is that it increases as the dispersion of the data increases O F The interquartile range is preferred when the data are skewed or have outliers An advantage of the standard deviation is that it uses all the observations in its computation

Statistics
StatisticsA manufacturer of bolts has a quality control policy that requires it to destroy any bolts that are more than 2 standard deviations from the mean The quality control engineer knows that the bolts coming off the assembly line have mean length of 14 cm with a standard deviation of 0 05 cm For what lengths will a bolt be destroyed Select the correct choice below and fill in the answer box es to complete your choice Round to one decimal place as needed OA A bolt will be destroyed if the length is less than OB A bolt will be destroyed if the length is greater than OC A bolt will be destroyed if the length is less than OD A bolt will be destroyed if the length is between cm or greater than cm cm cm and cm cm

Statistics
Probability16 The ages of clients seen in a local healthcare clinic is given in the following data set 37 38 45 47 48 51 54 54 58 60 62 63 63 65 69 71 74 75 78 78 80 84 86 89 92 94 96 What is the age range of the lower quartile O 37 51 O 59 O 65 Question navigation 14

Statistics
StatisticsWhat is meant by the phrase degrees of freedom as it pertains to the computation of the sample standard deviation Choose the correct answer below C A There are n 1 degrees of freedom in the computation of s because an unknown parameter is estimated by x For each parameter estimated 1 degree of freedom is lost OB The degrees of freedom refers to the number of observations that must be taken into account when computing the sample standard deviation s in order to ensure that the sum of the deviations about the mean is equal to zero OC There are n 1 degrees of freedom in the computation of the sample standard deviation s because it is obtained by dividing by n 1 OD There are n 1 degrees of freedom because the first n 1 observations have to be certain values in order for the nth value to have the freedom to be any value such that the sum of the deviations about the mean is equal to zero

Statistics
ProbabilityPart 1 of 4 The table below shows the results of a survey that asked 2853 people whether they are involved in any type of charity work A person is selected at random from the sample Complete parts a through d Total Frequently 224 Occasionally 453 430 Not at all 799 745 1476 202 1377 883 426 1544 2853 Male Female Total O a Find the probability that the person is frequently or occasionally involved in charity work P being frequently involved or being occasionally involved Round to the nearest thousandth as needed E

Statistics
ProbabilityA physics class has 50 students Of these 17 students are physics majors and 16 students are female Of the physics majors seven are female Find the probability that a randomly selected student is female physics major The probability that a randomly selected student is female or a physics major is Round to three decimal places as needed

Statistics
StatisticsChoose the three formulas that can be used to describe complementary events Select the three formulas that can be used to describe complementary events A P E 1 P E B P E 1 P E c P E P E 1 D P E P E 1 E P E OF P E P E G P E 1 P E 1 P E 1

Statistics
ProbabilityClassify the following statement as an example of classical probability empirical probability or subjective probability Explain your reasoning According to company records the probability that a washing machine will need repairs during an eight year period is 0 26 This is an example of probability since C the stated probability is calculated based on observations from the company records each washing machine has an equal chance of needing repairs during the period a washing machine is as likely to need repairs as it is to not need repairs it deals with a continuous period rather than a fixed number of trials tuition an educated guess or an estimate

Statistics
ProbabilityThirty of the 200 digital video recorders DVRs in an inventory are known to be defective What is the probability you randomly select a DVR that is not defective The probability is Type an integer or a decimal Do not round

Statistics
ProbabilityYou randomly select an integer from 0 to 39 inclusively and then randomly select an integer from 0 to 49 inclusively What is the probability of selecting a 37 both The probability is Type an integer or a decimal Do not round

Statistics
StatisticsIt is found that the home team was victorious in 70 games out of a sample of 120 games in the FA premier league a football soccer league in Great Britain We wish to investigate the proportion p of all games won by the home team in this league Click here to access StatKey Your answer is incorrect b State the null and alternative hypotheses for a test to see if there is evidence that the proportion is different from 0 5 f 41 A 42 p A Pi A P2 0 5 p iz E

Statistics
ProbabilityHypotheses for a statistical test are given followed by several possible confidence intervals for different samples In each case confidence interval to state a conclusion of the test for that sample and give the significance level used a 95 confidence interval for p 0 74 to 0 84 Conclusion Do not reject Significance level b 95 confidenc Conclusion Significance level c 99 confidenc 95 Conclusion 1 10 99 Conclusion 90 Significance level 5 Significance level Ho Hypotheses Ho p 0 8 vs Ha p 0 8 for p 0 97 to 1 18 Ho b 95 confidence interval for p 0 97 to 1 18 for p 0 78 to 0 81 V Ho c 99 confidence interval for p 0 78 to 0 81 Ho

Statistics
StatisticsImpact of Arts Education A randomized controlled experiment involving over 10 000 students enrolled in 4th to 8th grade in Texas examined the impact of arts education on a wide variety of outcomes Arts education included visual arts music dance and theater Six different outcomes were measured over 12 different groups for a total of 72 different hypothesis tests conducted to examine evidence for a positive impact from additional arts education Bowen D and Kisida B Investigating Causal Effects of Arts Education Experimental Evidence from Houston s Arts Access Initiative Research Report Kinder Institute for Urban Research February 12 2019 ii The other 24 tests were in the areas of discipline and writing For these 24 tests 15 were significant at the 5 level and 6 were significant at the 1 level At the 5 level Expected just by random chance i 2 7 Number of significant tests observed 15 At the 1 level Expected just by random chance i 0 54 Number of significant tests observed 6 Does increased arts education appear to have a statistically significant impact in these areas

Statistics
StatisticsThe dataset DecemberFlights contains the difference between actual and scheduled arrival time from 1000 randomly sample December flights for two of the major North American airlines Delta Air Lines and United Air Lines A negative difference indica flight arrived early Suppose that we are only interested in the proportion of flights arriving more than 30 minutes after the sc time Of the 1000 Delta flights 67 arrived more than 30 minutes late and of the 1000 United flights 160 arrived more than 30 late We are testing to see if this provides evidence to conclude that the proportion of flights that are over 30 minutes late is d between flying United or Delta Let group 1 be Delta flights and group 2 be United flights 4 Click here for the dataset associated with this question Use the second edition If using StatKey the data needed is preloaded as Late Arrival 2e Delta vs United 2014 Click here to access StatKey b What statistic will be recorded for each of the simulated samples to create the randomization distribution Statistic P H P2 a State the null and alternative hypotheses p x2 1 1 A p 42 2 A Pi p p A P P1 P1 r P2 P2 H p p HE I1

Statistics
ProbabilityA confidence interval for a sample is given followed by several hypotheses to test using that sample In each case use the confidence interval to give a conclusion of the test if possible and also state the significance level you are using a Ho p 0 5 vs Ha p0 5 Conclusion Significance level b Ho p 0 78 Conclusion Significance level Conclusion 90 5 10 Conclusion 1 99 95 Significance level Ho b Ho p 0 78 vs Ha p 0 78 0 78 Significance level Ho A95 confidence interval for p 0 47 to 0 72 c Ho p 0 32 vs Ha p 0 32 Ho Ho

Statistics
Probability16 The life time of bulbs is as follows Can we accept the hypothesis that the average life is 4 hours Item 1 2 3 4 5 6 7 8 9 10 Life hours 4 2 4 6 3 9 5 2 3 8 3 9 4 3 4 4 5 6 4 1

Statistics
StatisticsFind the standard error of mean 39 49 59 69 79 89 2 3 11 20 32 25 a Marks No of students 99 7

Statistics
Probability12 Show that for distribution with n d f mean deviation about mean is given by n r n nr m 2 2

Statistics
StatisticsSuppose that a customer is purchasing a car He conducts an experiment in which he puts 10 gallons of gas in the car and drives it until it runs out of gas He conducts this experiment 15 times on each car and records the number of miles driven 219 253 259 244 162 260 237 268 257 240 201 304 Car 1 223 251 279 Car 2 233 296 324 215 296 252 Full data set 245 154 283 225 242 264 251 288 295 decimal place as needed Range for Car 2 R 170 mi 10 gal Type an integer or decimal rounded to one decimal place as needed Sample standard deviation for Car 1 s 23 0 mi 10 gal Type an integer or decimal rounded to one decimal place as needed Sample standard deviation for Car 2 s 49 9 mi 10 gal Type an integer or decimal rounded to one decimal place as needed Which car would the customer buy and why OA Car 1 because it has a lower sample standard deviation hence more predictable gas mileage O B Car 2 because it has a larger range of gas mileage O C Car 2 because it has a lower mean gas mileage

Statistics
StatisticsAr A soap manufacturing company was distributing a particular brand of soap through a large number of retail shops Before a heavy advertisement compaign the mean sales per week per shop was 140 dozens After the campaign a sample of 26 shops was taken and the mean sales was found to be 147 dozens with standard deviation 16 Can you consider the advertisement effective MUGLL 660 LOUD

Statistics
StatisticsWhich theory approaches medicine and health as health and the healthcare system are valuable resources that are unequally shared in society Structural Functionalist Conflict Theory O Symbolic interactionists O None of the Above

Statistics
StatisticsWhich theory approaches social institutions with the idea that social institutions represent the interests of those in power and thus create and maintain inequalities in society Structural Functionalist Conflict Theory O Symbolic interactionist None of the Above

Statistics
Statisticsapproaches religion focus on how religious meaning is constructed in interaction and how religion is incorporated into everyday life of individuals and groups Symbolic interactionism Conflict Theory Structural Functionalist O None of the Above
Statistics
StatisticsWhich theory approaches social change with the idea that social change involves changes in the meaning of things as well as changes in laws culture and social behavior O Conflict Theory Structural Functionalist Symbolic interactionism O No answer text provided

Statistics
ProbabilityWhich theory approaches medicine and health as disease being a threat to social order and sick individuals cannot fulfill their roles and contribute to society Structural Functionalist O Conflict Theory Symbolic interactionism O None of the Above

Statistics
StatisticsWhich theory approaches the natural environment with the notion that not all groups or individuals benefit equally from society s use of the natural environment Conflict Theory Structural Functionalist O Symbolic interactionism O None of the Above

Statistics
Statisticsviews outsourcing as exploiting poor and developing nation and laid off local workers all while enriching corporations Conflict Theory Structural Functionalist Symbolic interactionists None of the Above

Statistics
StatisticsWhich histogram depicts a higher standard deviation Frequency 10 8 6 0 30 40 50 60 70 a Choose the correct answer below Frequency 10 8 2 0 40 44 48 52 56 60 b Q Q Q OA Histogram a depicts the higher standard deviation B Histogram b depicts the higher standard deviation since it is more bell shaped because the distribution has more dispersion OC Histogram b depicts the higher standard deviation O D Histogram a depicts the higher standard deviatio because the bars are higher than the average bar because the distribution has more dispersion in a