Statistics Questions
The best high school and college tutors are just a click away, 24×7! Pick a subject, ask a question, and get a detailed, handwritten solution personalized for you in minutes. We cover Math, Physics, Chemistry & Biology.
![True or False When comparing two populations the larger the standard deviation the more dispersion the distribution has provided that the variable of interest from the two populations has the same unit of measure Choose the correct answer below C O A True because the standard deviation describes how far on average each observation is from the typical value A larger standard deviation means that observations are more distant from the typical value and therefore more dispersed OB False because the standard deviation measures the spread of the distribution not the dispersion of the distribution OC False because the larger the standard deviation is the less dispersion the distribution has OD True because the standard deviation is the difference between the largest and smallest observation When the standard deviation is larger there is more distance between the largest and smallest observation and therefore more dispersion in the distribution](https://media.kunduz.com/media/sug-question-candidate/20230625041528643265-4832772.jpg?w=256)
Statistics
StatisticsTrue or False When comparing two populations the larger the standard deviation the more dispersion the distribution has provided that the variable of interest from the two populations has the same unit of measure Choose the correct answer below C O A True because the standard deviation describes how far on average each observation is from the typical value A larger standard deviation means that observations are more distant from the typical value and therefore more dispersed OB False because the standard deviation measures the spread of the distribution not the dispersion of the distribution OC False because the larger the standard deviation is the less dispersion the distribution has OD True because the standard deviation is the difference between the largest and smallest observation When the standard deviation is larger there is more distance between the largest and smallest observation and therefore more dispersion in the distribution
![Find the payment necessary to amortize a 12 loan of 2100 compounded quarterly with 17 quarterly payments The payment size is Round to the nearest cent www](https://media.kunduz.com/media/sug-question-candidate/20230625035811533151-5638505.jpg?w=256)
Statistics
ProbabilityFind the payment necessary to amortize a 12 loan of 2100 compounded quarterly with 17 quarterly payments The payment size is Round to the nearest cent www
![If the variance of a variable is 36 what is the standard deviation This is a reading assessment question Be certain of your answer because you only get one attempt on this question The standard deviation is Type an integer or decimal rounded to two decimal places as needed](https://media.kunduz.com/media/sug-question-candidate/20230625042017747318-4832772.jpg?w=256)
Statistics
ProbabilityIf the variance of a variable is 36 what is the standard deviation This is a reading assessment question Be certain of your answer because you only get one attempt on this question The standard deviation is Type an integer or decimal rounded to two decimal places as needed
![What can be said about a set of data with a standard deviation of 0 This is a reading assessment question Be certain of your answer because you only get one attempt on this question Choose the correct answer below O A For every positive value there is a corresponding negative value as in 4 and 4 6 and 6 OB All the observations are the same value OC All the observations are 0](https://media.kunduz.com/media/sug-question-candidate/20230625041900225403-4832772.jpg?w=256)
Statistics
ProbabilityWhat can be said about a set of data with a standard deviation of 0 This is a reading assessment question Be certain of your answer because you only get one attempt on this question Choose the correct answer below O A For every positive value there is a corresponding negative value as in 4 and 4 6 and 6 OB All the observations are the same value OC All the observations are 0
![Identify the given statement as either true or false The standard deviation can be negative This is a reading assessment question Be certain of your answer because you only get one attempt on this question Choose the correct answer below False O True](https://media.kunduz.com/media/sug-question-candidate/20230625041926766130-4832772.jpg?w=256)
Statistics
ProbabilityIdentify the given statement as either true or false The standard deviation can be negative This is a reading assessment question Be certain of your answer because you only get one attempt on this question Choose the correct answer below False O True
![True or False Chebyshev s inequality applies to all distributions regardless of shape but the empirical rule holds only for distributions that are bell shaped Choose the correct answer below O A True Chebyshev s inequality is less precise than the empirical rule but will work for any distribution while the empirical rule only works for bell shaped distributions OB False both Chebyshev s inequality and the empirical rule will only work for bell shaped distributions OC False both Chebyshev s inequality and the empirical rule will work for any distribution O D False the empirical rule is less precise than Chebyshev s inequality but will work for any distribution while Chebyshev s inequality only works for bell shaped distributions](https://media.kunduz.com/media/sug-question-candidate/20230625041559884908-4832772.jpg?w=256)
Statistics
StatisticsTrue or False Chebyshev s inequality applies to all distributions regardless of shape but the empirical rule holds only for distributions that are bell shaped Choose the correct answer below O A True Chebyshev s inequality is less precise than the empirical rule but will work for any distribution while the empirical rule only works for bell shaped distributions OB False both Chebyshev s inequality and the empirical rule will only work for bell shaped distributions OC False both Chebyshev s inequality and the empirical rule will work for any distribution O D False the empirical rule is less precise than Chebyshev s inequality but will work for any distribution while Chebyshev s inequality only works for bell shaped distributions
![Let be the number of packages being mailed by a randomly selected customer at a certain shipping facility Suppose the distribution of X is as follows 2 3 4 p x 0 2 0 4 0 1 0 3 X X a Consider a random sample of size n 2 two customers and let X be the sample mean number of packages shipped Obtain the probability distribution of X 1 1 5 2 2 5 3 3 5 P X 0 04 1 0 6 0 16 b Refer to part a and calculate P X 2 5 0 3 0 2 0 28 0 2 2 c Again consider a random sample of size n 2 but now focus on the statistic R the sample range difference between the largest and smallest values in the sample Obtain the distribution of R Hint Calculate the value of R for each outcome and use the probabilities from part a R 0 1 3 P R 0 3 0 25 0 12 0 06 0 09 4 d If a random sample of size n 4 is selected what is P X 1 5 Hint You should not have to list all possible outcomes only those for which x 1 5](https://media.kunduz.com/media/sug-question-candidate/20230625041050664192-5005644.jpg?w=256)
Statistics
StatisticsLet be the number of packages being mailed by a randomly selected customer at a certain shipping facility Suppose the distribution of X is as follows 2 3 4 p x 0 2 0 4 0 1 0 3 X X a Consider a random sample of size n 2 two customers and let X be the sample mean number of packages shipped Obtain the probability distribution of X 1 1 5 2 2 5 3 3 5 P X 0 04 1 0 6 0 16 b Refer to part a and calculate P X 2 5 0 3 0 2 0 28 0 2 2 c Again consider a random sample of size n 2 but now focus on the statistic R the sample range difference between the largest and smallest values in the sample Obtain the distribution of R Hint Calculate the value of R for each outcome and use the probabilities from part a R 0 1 3 P R 0 3 0 25 0 12 0 06 0 09 4 d If a random sample of size n 4 is selected what is P X 1 5 Hint You should not have to list all possible outcomes only those for which x 1 5
![Find the amount necessary to fund the given withdrawals Quarterly withdrawals of 600 for 6 years interest rate is 4 7 compounded quarterly The amount necessary to fund the given withdrawals is Round to the nearest cent as needed www](https://media.kunduz.com/media/sug-question-candidate/20230625035956758534-5638505.jpg?w=256)
Statistics
StatisticsFind the amount necessary to fund the given withdrawals Quarterly withdrawals of 600 for 6 years interest rate is 4 7 compounded quarterly The amount necessary to fund the given withdrawals is Round to the nearest cent as needed www
![The annual profits of five large corporations in a certain area are given below Which measure of central tendency should be used 206 000 214 000 234 000 204 000 1 284 000 OA mean B midrange C median OD mode](https://media.kunduz.com/media/sug-question-candidate/20230625031458218930-4832772.jpg?w=256)
Statistics
StatisticsThe annual profits of five large corporations in a certain area are given below Which measure of central tendency should be used 206 000 214 000 234 000 204 000 1 284 000 OA mean B midrange C median OD mode
![K The table below shows a random sample of 30 quantitative SAT scores of first year students admitted at a university Make an appropriate graph of distribution of the data and describe the distribution 655 559 734 653 651 541 672 666 688 641 577 732 679 616 557 535 665 727 669 610 530 708 732 793 0 688 676 624 600 652 723 C The distribution appears to be left skewed D The distribution cannot be determined Identify any outlier s Select the correct answer below and if necessary fill in any answer box to complete your choice OA There is more than one outlier They are scores of Use a comma to separate answers as needed OB There is one outlier It is a score of OC There are no outliers in the data set](https://media.kunduz.com/media/sug-question-candidate/20230625030630475773-5366129.jpg?w=256)
Statistics
StatisticsK The table below shows a random sample of 30 quantitative SAT scores of first year students admitted at a university Make an appropriate graph of distribution of the data and describe the distribution 655 559 734 653 651 541 672 666 688 641 577 732 679 616 557 535 665 727 669 610 530 708 732 793 0 688 676 624 600 652 723 C The distribution appears to be left skewed D The distribution cannot be determined Identify any outlier s Select the correct answer below and if necessary fill in any answer box to complete your choice OA There is more than one outlier They are scores of Use a comma to separate answers as needed OB There is one outlier It is a score of OC There are no outliers in the data set
![Provide an appropriate response In interpreting a boxplot of a data set we note that the median is to the left of the center of the box and the right line is longer than the left line We can conclude that OA The data is skewed right B The data is skewed left C The data is symmetric D Skewner mot](https://media.kunduz.com/media/sug-question-candidate/20230625031516061768-4832772.jpg?w=256)
Statistics
StatisticsProvide an appropriate response In interpreting a boxplot of a data set we note that the median is to the left of the center of the box and the right line is longer than the left line We can conclude that OA The data is skewed right B The data is skewed left C The data is symmetric D Skewner mot
![Construct a frequency distribution for the data using five classes Describe the shape of the distribution The data set Pick Three Lottery Outcomes for 10 Consecutive Weeks 3 676061784 1 5 7 5 9 1 5399 2230884024 OA bell shaped B uniform C skewed to the left D skewed to the right](https://media.kunduz.com/media/sug-question-candidate/20230625030246456250-4832772.jpg?w=256)
Statistics
StatisticsConstruct a frequency distribution for the data using five classes Describe the shape of the distribution The data set Pick Three Lottery Outcomes for 10 Consecutive Weeks 3 676061784 1 5 7 5 9 1 5399 2230884024 OA bell shaped B uniform C skewed to the left D skewed to the right
![F According to an organization there are five leading causes of preventable death in a region They are shown in the graph to the right where HBP is High Blood Pressure TU is Tobacco Use HBG is High Blood Glucose PA is Physical Activity and OO and Overweight and Obesity Use the graph to complete parts a through e a Estimate how many preventable deaths result from high blood pressure Approximately million preventable deaths in one year result from high blood pressure Round to one decimal place as needed Millions in One Year PIN WAGON HBP TU HB](https://media.kunduz.com/media/sug-question-candidate/20230625025133608390-5366129.jpg?w=256)
Statistics
StatisticsF According to an organization there are five leading causes of preventable death in a region They are shown in the graph to the right where HBP is High Blood Pressure TU is Tobacco Use HBG is High Blood Glucose PA is Physical Activity and OO and Overweight and Obesity Use the graph to complete parts a through e a Estimate how many preventable deaths result from high blood pressure Approximately million preventable deaths in one year result from high blood pressure Round to one decimal place as needed Millions in One Year PIN WAGON HBP TU HB
![SAS was used to compare the high school dropout rates for the 30 school districts in one city in 2010 and 2012 The box plots generated for these dropout rates are shown below Compare the center of the distributions and the variation of the distributions for the two years 49 25 36 9375 24 625 12 3125 0 Variable RATE n](https://media.kunduz.com/media/sug-question-candidate/20230625022211754171-4832772.jpg?w=256)
Statistics
StatisticsSAS was used to compare the high school dropout rates for the 30 school districts in one city in 2010 and 2012 The box plots generated for these dropout rates are shown below Compare the center of the distributions and the variation of the distributions for the two years 49 25 36 9375 24 625 12 3125 0 Variable RATE n
![The bar graph below shows the political party affiliation of 1000 registered U S voters What percentage of the 1000 registered U S voters belonged to one of the traditional two parties Democratic and Republican Percentage 40 30 20 10 0 Democrat Republican Independent Other Party Affiliation OA 40](https://media.kunduz.com/media/sug-question-candidate/20230625022734631338-4832772.jpg?w=256)
Statistics
StatisticsThe bar graph below shows the political party affiliation of 1000 registered U S voters What percentage of the 1000 registered U S voters belonged to one of the traditional two parties Democratic and Republican Percentage 40 30 20 10 0 Democrat Republican Independent Other Party Affiliation OA 40
![A farmer wishes to test the effects of a new fertilizer on her corn yield She has four equal sized plots of land one with sandy soil one with rocky soil one with clay rich soil and one with average soil She divides each of the four plots into three equal sized portions and randomly labels them A B and C The four A portions of land are treated with her old fertilizer The four B portions are treated with the new fertilizer and the four C s are treated with no fertilizer At harvest time the corn yield is recorded for each section of land What is the response variable in this experiment OA the four types of soil B the type of fertilizer old new or none OC the section of land A B or C D the corn vield recorded for each section of land](https://media.kunduz.com/media/sug-question-candidate/20230625022014092095-4832772.jpg?w=256)
Statistics
StatisticsA farmer wishes to test the effects of a new fertilizer on her corn yield She has four equal sized plots of land one with sandy soil one with rocky soil one with clay rich soil and one with average soil She divides each of the four plots into three equal sized portions and randomly labels them A B and C The four A portions of land are treated with her old fertilizer The four B portions are treated with the new fertilizer and the four C s are treated with no fertilizer At harvest time the corn yield is recorded for each section of land What is the response variable in this experiment OA the four types of soil B the type of fertilizer old new or none OC the section of land A B or C D the corn vield recorded for each section of land
![Explain what is misleading about the graphic The volume of our sales has doubled OA The length of a side has doubled but the area has been multiplied by 4 B The graphic is not misleading C The length of a side has doubled but the area has been unchanged D The length of a side has doubled but the area has been multiplied by 8](https://media.kunduz.com/media/sug-question-candidate/20230625022604495997-4832772.jpg?w=256)
Statistics
StatisticsExplain what is misleading about the graphic The volume of our sales has doubled OA The length of a side has doubled but the area has been multiplied by 4 B The graphic is not misleading C The length of a side has doubled but the area has been unchanged D The length of a side has doubled but the area has been multiplied by 8
![Provide an appropriate response Given the following five number summary find Q3 2 9 5 7 10 0 13 2 21 1 OA 21 1 OB 13 2 C 10 0 D 57](https://media.kunduz.com/media/sug-question-candidate/20230625022052832960-4832772.jpg?w=256)
Statistics
StatisticsProvide an appropriate response Given the following five number summary find Q3 2 9 5 7 10 0 13 2 21 1 OA 21 1 OB 13 2 C 10 0 D 57
![of 1 Macmillan Learning Use the Statistical Applet The Reasoning of a Statistical Test to answer the question Click NEW SHOOTER then have the new shooter take 5 shots Observe the percentage of hits Now have the same shooter take 10 more shots for a total of 15 Again observe the percentage of hits Finally have the same shooter take at least 35 more shots for a total of 50 or more Observe the percentage of hits Click the Show true probability checkbox to reveal the true probability of hitting a free throw for this shooter Do you feel that the evidence you have seen here allows you to reject the null hypothesis that the shooter makes 80 of all his free throws Do you think it is better to make this decision after seeing 5 15 or 50 shots Select the true statements T It is certainly better to make a decision after seeing 5 shots than after seeing 15 or 50 shots One thing this applet demonstrates is that even after many many observations it is still impossible to know for sure whether or not a null hypothesis should be rejected It is certainly better to make a decision after seeing 15 shots than after seeing 5 or 50 shots It is certainly better to make a decision after seeing 50 shots than after seeing 5 or 15 shots The less shots we see the shooter take the larger the sample size we have to estimate the shooter s true underlying](https://media.kunduz.com/media/sug-question-candidate/20230625014437423091-5691435.jpg?w=256)
Statistics
Statisticsof 1 Macmillan Learning Use the Statistical Applet The Reasoning of a Statistical Test to answer the question Click NEW SHOOTER then have the new shooter take 5 shots Observe the percentage of hits Now have the same shooter take 10 more shots for a total of 15 Again observe the percentage of hits Finally have the same shooter take at least 35 more shots for a total of 50 or more Observe the percentage of hits Click the Show true probability checkbox to reveal the true probability of hitting a free throw for this shooter Do you feel that the evidence you have seen here allows you to reject the null hypothesis that the shooter makes 80 of all his free throws Do you think it is better to make this decision after seeing 5 15 or 50 shots Select the true statements T It is certainly better to make a decision after seeing 5 shots than after seeing 15 or 50 shots One thing this applet demonstrates is that even after many many observations it is still impossible to know for sure whether or not a null hypothesis should be rejected It is certainly better to make a decision after seeing 15 shots than after seeing 5 or 50 shots It is certainly better to make a decision after seeing 50 shots than after seeing 5 or 15 shots The less shots we see the shooter take the larger the sample size we have to estimate the shooter s true underlying
![Provide an appropriate response Over the fast 10 years four mutual funds all had the same mean rate of return 12 These mutual funds had different standard deviations as follows Mutual Money 8 Co joined Investments 6 Together Fund 4 All for One Fund 9 Which mutual fund investment is the most consistent in rate of return OA Co joined Investments B All for One Fund C Together Fund D Mutual Money](https://media.kunduz.com/media/sug-question-candidate/20230625022637295065-4832772.jpg?w=256)
Statistics
StatisticsProvide an appropriate response Over the fast 10 years four mutual funds all had the same mean rate of return 12 These mutual funds had different standard deviations as follows Mutual Money 8 Co joined Investments 6 Together Fund 4 All for One Fund 9 Which mutual fund investment is the most consistent in rate of return OA Co joined Investments B All for One Fund C Together Fund D Mutual Money
![Describe the shape of the distribution Relative Frequency OA skewed to the right B uniform OC skewed to the left](https://media.kunduz.com/media/sug-question-candidate/20230625022539452777-4832772.jpg?w=256)
Statistics
ProbabilityDescribe the shape of the distribution Relative Frequency OA skewed to the right B uniform OC skewed to the left
![You are asked to compare three data sets Without calculating determine which data set has the greatest sample standard deviation and which has the least sample standard deviatio Click here to view the data sets OA Greatest sample standard deviation 1 Least sample standard deviation iii OB Greatest sample standard deviation ii Least sample standard deviation i OC Greatest sample standard deviation i Least sample standard deviation ii OD Greatest sample standard deviation i Least sample standard deviation ii Data Sets 0 14 15 11 H 14 iii 15 16 17 18 19 16 17 18 19 4](https://media.kunduz.com/media/sug-question-candidate/20230625021252462095-5366129.jpg?w=256)
Statistics
StatisticsYou are asked to compare three data sets Without calculating determine which data set has the greatest sample standard deviation and which has the least sample standard deviatio Click here to view the data sets OA Greatest sample standard deviation 1 Least sample standard deviation iii OB Greatest sample standard deviation ii Least sample standard deviation i OC Greatest sample standard deviation i Least sample standard deviation ii OD Greatest sample standard deviation i Least sample standard deviation ii Data Sets 0 14 15 11 H 14 iii 15 16 17 18 19 16 17 18 19 4
![If nothing is known about the shape of a distribution what percentage of the observations fall within 2 standard deviations of the mean OA approximately 5 OB at most 25 OC C approximately 95 D at least 75](https://media.kunduz.com/media/sug-question-candidate/20230625021609945576-4832772.jpg?w=256)
Statistics
StatisticsIf nothing is known about the shape of a distribution what percentage of the observations fall within 2 standard deviations of the mean OA approximately 5 OB at most 25 OC C approximately 95 D at least 75
![K Match the description of the sample with the correct plot Time in minutes it takes a sample of employees to drive to work O A Key 09 0 9 0 9 1 49 2 3678 3 01568 4 OC 5 0 10 15 20 25 30 35 40 45 D O B Key 7 2 72 6 89 7 8 9 OD 0233678 2456778 0115 200 205 210 215](https://media.kunduz.com/media/sug-question-candidate/20230625021149139696-5366129.jpg?w=256)
Statistics
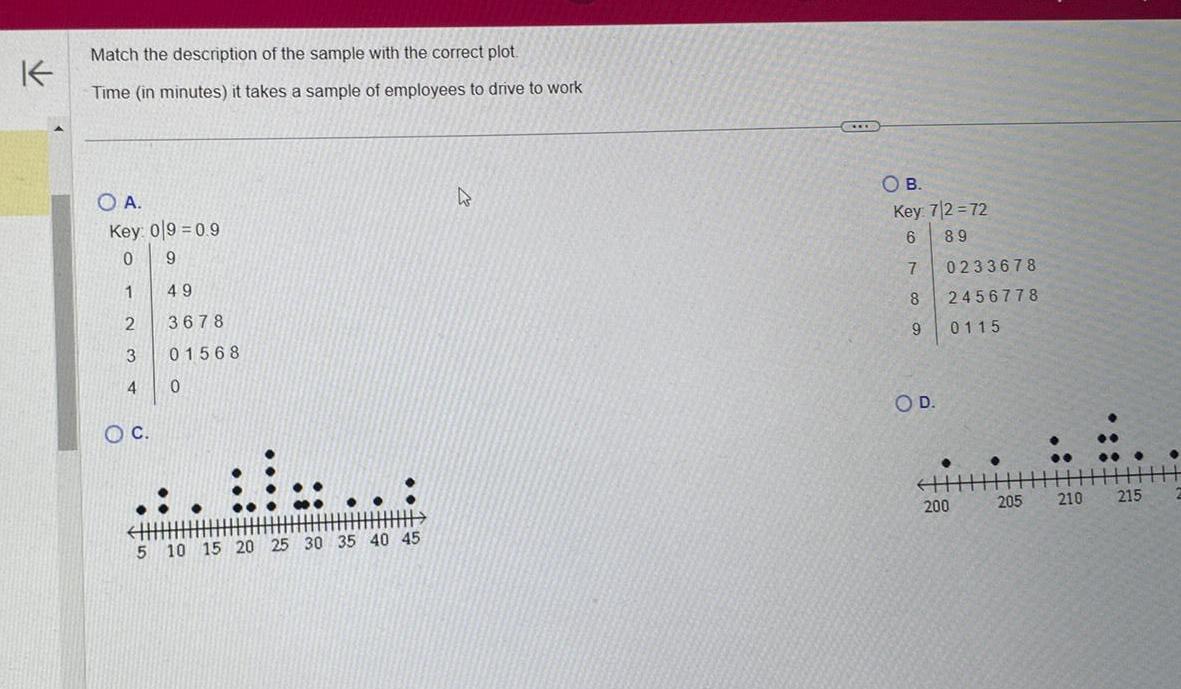
StatisticsK Match the description of the sample with the correct plot Time in minutes it takes a sample of employees to drive to work O A Key 09 0 9 0 9 1 49 2 3678 3 01568 4 OC 5 0 10 15 20 25 30 35 40 45 D O B Key 7 2 72 6 89 7 8 9 OD 0233678 2456778 0115 200 205 210 215
![The Excel frequency bar graph below describes the employment status of a random sample of U S adults What is the percentage of those having no job sets or no job 2 part time jobs 1 part time job 1 full time job A 40 B 15 0 Frequency Bar Graph 5 6 8 10 10 15 16 20](https://media.kunduz.com/media/sug-question-candidate/20230625021710601509-4832772.jpg?w=256)
Statistics
StatisticsThe Excel frequency bar graph below describes the employment status of a random sample of U S adults What is the percentage of those having no job sets or no job 2 part time jobs 1 part time job 1 full time job A 40 B 15 0 Frequency Bar Graph 5 6 8 10 10 15 16 20
![The February utility bills in dollars for ten residents of a large city are listed below Find the mode amount 71 67 67 72 76 72 73 68 72 72 OA 76 OB 73 C 67 D 72](https://media.kunduz.com/media/sug-question-candidate/20230625021428019330-4832772.jpg?w=256)
Statistics
StatisticsThe February utility bills in dollars for ten residents of a large city are listed below Find the mode amount 71 67 67 72 76 72 73 68 72 72 OA 76 OB 73 C 67 D 72
![Provide an appropriate response The government of a town needs to determine if the city s residents will support the construction of a new town hall The government decides to conduct a survey of a sample of the city s residents Which one of the following procedures would be most appropriate for obtaining a sample of the town s residents A Survey every 8th person who walks into city hall on a given day B Survey a random sample of employees at the old city hall C Survey a random sample of persons within each geographic region of the city D Survey the first 300 people listed in the town s telephone directory](https://media.kunduz.com/media/sug-question-candidate/20230625021552707818-4832772.jpg?w=256)
Statistics
StatisticsProvide an appropriate response The government of a town needs to determine if the city s residents will support the construction of a new town hall The government decides to conduct a survey of a sample of the city s residents Which one of the following procedures would be most appropriate for obtaining a sample of the town s residents A Survey every 8th person who walks into city hall on a given day B Survey a random sample of employees at the old city hall C Survey a random sample of persons within each geographic region of the city D Survey the first 300 people listed in the town s telephone directory
![Approximate the mean of the grouped data Round to the nearest whole number Phone calls per day Frequency 8 11 12 15 16 19 20 23 24 27 46 51355 11 43 OOO OO OA B](https://media.kunduz.com/media/sug-question-candidate/20230625021207184814-5366129.jpg?w=256)
Statistics
StatisticsApproximate the mean of the grouped data Round to the nearest whole number Phone calls per day Frequency 8 11 12 15 16 19 20 23 24 27 46 51355 11 43 OOO OO OA B
![QUESTION 49 1 POINT Lexie gets 2 3 likes per day on average on a Facebook ad she pays for with a standard deviation of 0 7 She decided to see if using a new ad would decrease her average She used the new ad for 15 days For those 15 days Lexie got an average 1 9 likes She wants to know if the new ad reduced her number of likes each day Lexie conducts a one mean hypothesis at the 10 significance level to test if the new ad helped her get more likes each day Ho p 2 3 H p 2 3 which is a left tailed test Determine the test statistic rounded to two decimal places Provide your answer below test statistic](https://media.kunduz.com/media/sug-question-candidate/20220623053244026621-4536923.jpg?w=256)
Statistics
StatisticsQUESTION 49 1 POINT Lexie gets 2 3 likes per day on average on a Facebook ad she pays for with a standard deviation of 0 7 She decided to see if using a new ad would decrease her average She used the new ad for 15 days For those 15 days Lexie got an average 1 9 likes She wants to know if the new ad reduced her number of likes each day Lexie conducts a one mean hypothesis at the 10 significance level to test if the new ad helped her get more likes each day Ho p 2 3 H p 2 3 which is a left tailed test Determine the test statistic rounded to two decimal places Provide your answer below test statistic
![The amount of coffee that people drink per day is normally distributed with a mean of 15 ounces andra standard deviation of 5 ounces 33 randomly selected people are surveyed Round all answers to 4 decimal places where possible a What is the distribution of X X N b What is the distribution of N c What is the probability that one randomly selected person drinks between 14 5 and 15 3 ounces of coffee per day d For the 33 people find the probability that the average coffee consumption is between 14 5 and 15 3 ounces of coffee per day e For part d is the assumption that the distribution is normal necessary Yes No](https://media.kunduz.com/media/sug-question-candidate/20230625013044570639-5729169.jpg?w=256)
Statistics
StatisticsThe amount of coffee that people drink per day is normally distributed with a mean of 15 ounces andra standard deviation of 5 ounces 33 randomly selected people are surveyed Round all answers to 4 decimal places where possible a What is the distribution of X X N b What is the distribution of N c What is the probability that one randomly selected person drinks between 14 5 and 15 3 ounces of coffee per day d For the 33 people find the probability that the average coffee consumption is between 14 5 and 15 3 ounces of coffee per day e For part d is the assumption that the distribution is normal necessary Yes No
![at is the most common trick to mislead readers of bar graphs pose the correct answer below A Change the color of the bars to make some categories appear more important than others B Change the width of the bars to make some categories appear more important than others C Change the scale of the vertical axis so that it does not start at 0 D Change the scale of the horizontal axis so that it does not start at 0](https://media.kunduz.com/media/sug-question-candidate/20230625011750616054-5366129.jpg?w=256)
Statistics
Statisticsat is the most common trick to mislead readers of bar graphs pose the correct answer below A Change the color of the bars to make some categories appear more important than others B Change the width of the bars to make some categories appear more important than others C Change the scale of the vertical axis so that it does not start at 0 D Change the scale of the horizontal axis so that it does not start at 0
![hat are two commonly used graphs to display the distribution of a sample of cate hoose the correct answer below Histograms and dotplots O Bar graph and pie chart O Dotplots and bar graphs Bar graph and stemplot](https://media.kunduz.com/media/sug-question-candidate/20230625011806918425-5366129.jpg?w=256)
Statistics
Statisticshat are two commonly used graphs to display the distribution of a sample of cate hoose the correct answer below Histograms and dotplots O Bar graph and pie chart O Dotplots and bar graphs Bar graph and stemplot
![A fitness instructor measured the heart rates of the participants in a yoga class at the conclusion of the class The data is summarized in the histogram to the right There were fifteen people who participated in the class between the ages of 25 and 45 Use the histogram to answer the question How many participants had a heart rate between 120 and 120 bpm OA 4 OB 5 OC 2 OD 3 point s pos 90 100 110 129 130 140 150](https://media.kunduz.com/media/sug-question-candidate/20230625011734557385-5366129.jpg?w=256)
Statistics
StatisticsA fitness instructor measured the heart rates of the participants in a yoga class at the conclusion of the class The data is summarized in the histogram to the right There were fifteen people who participated in the class between the ages of 25 and 45 Use the histogram to answer the question How many participants had a heart rate between 120 and 120 bpm OA 4 OB 5 OC 2 OD 3 point s pos 90 100 110 129 130 140 150
![The average number of miles in thousands that a car s tire will function before needing replacement is 72 and the standard deviation is 10 Suppose that 12 randomly selected tires are tested Round all answers to 4 decimal places where possible and assume a normal distribution a What is the distribution of X X N b What is the distribution of a N c If a randomly selected individual tire is tested find the probability that the number of miles in thousands before it will need replacement is between 76 and 79 3 d For the 12 tires tested find the probability that the average miles in thousands before need of replacement is between 76 and 79 3 e For part d is the assumption that the distribution is normal necessary Yes No](https://media.kunduz.com/media/sug-question-candidate/20230625011205531048-5729169.jpg?w=256)
Statistics
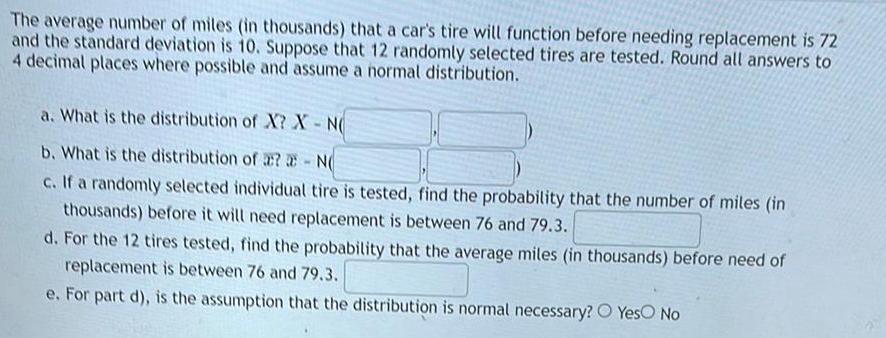
StatisticsThe average number of miles in thousands that a car s tire will function before needing replacement is 72 and the standard deviation is 10 Suppose that 12 randomly selected tires are tested Round all answers to 4 decimal places where possible and assume a normal distribution a What is the distribution of X X N b What is the distribution of a N c If a randomly selected individual tire is tested find the probability that the number of miles in thousands before it will need replacement is between 76 and 79 3 d For the 12 tires tested find the probability that the average miles in thousands before need of replacement is between 76 and 79 3 e For part d is the assumption that the distribution is normal necessary Yes No
![This question 1 point s possible K A student receives test scores of 62 83 and 91 The student s final exam score is 88 and homework score is 76 Each test is worth 20 of the final grade the final exam is 25 of the final grade and the homework grade is 15 of the final grade What is the student s final grade in the class A 90 6 OB 85 6 O C 76 6 OD 80 6 CHIB Submit](https://media.kunduz.com/media/sug-question-candidate/20230625011401351821-5366129.jpg?w=256)
Statistics
ProbabilityThis question 1 point s possible K A student receives test scores of 62 83 and 91 The student s final exam score is 88 and homework score is 76 Each test is worth 20 of the final grade the final exam is 25 of the final grade and the homework grade is 15 of the final grade What is the student s final grade in the class A 90 6 OB 85 6 O C 76 6 OD 80 6 CHIB Submit
![The graph below is an ogive of scores on a math test The vertical axis in an ogive is the cumulative relative frequency and can also be interpreted as a percentile Use the graph to approximate the percentile rank of an individual whose test score is 45 Q Percentile Ranks of Math Test Scores 100 90 80 70 60 50 40 30 20 104 0 0 10 20 30 40 50 60 70 80 90 100 Question 14 of 21 G EXIB This This OA 65 OB 60 O C 19 OD 14](https://media.kunduz.com/media/sug-question-candidate/20230625011556915871-5366129.jpg?w=256)
Statistics
ProbabilityThe graph below is an ogive of scores on a math test The vertical axis in an ogive is the cumulative relative frequency and can also be interpreted as a percentile Use the graph to approximate the percentile rank of an individual whose test score is 45 Q Percentile Ranks of Math Test Scores 100 90 80 70 60 50 40 30 20 104 0 0 10 20 30 40 50 60 70 80 90 100 Question 14 of 21 G EXIB This This OA 65 OB 60 O C 19 OD 14
![K The birth weights for twins are normally distributed with a mean of 2353 grams and a standard deviation of 647 grams Use z scores to determine which birth weight could be considered unusu O A 2000 g OB 1200 g OC 3647 g OD 2353 g](https://media.kunduz.com/media/sug-question-candidate/20230625011720756125-5366129.jpg?w=256)
Statistics
ProbabilityK The birth weights for twins are normally distributed with a mean of 2353 grams and a standard deviation of 647 grams Use z scores to determine which birth weight could be considered unusu O A 2000 g OB 1200 g OC 3647 g OD 2353 g
![K uestion Find the z score for the value 90 when the mean is 59 and the standard deviation is 4 OA Z 7 50 OB z 7 75 OC z 1 46 OD z 1 46](https://media.kunduz.com/media/sug-question-candidate/20230625011640916910-5366129.jpg?w=256)
Statistics
StatisticsK uestion Find the z score for the value 90 when the mean is 59 and the standard deviation is 4 OA Z 7 50 OB z 7 75 OC z 1 46 OD z 1 46
![This question 1 point s possible Many firms use on the job training to teach their employees computer programming Suppose you work in the personnel department of a firm that just finished training a group of its en you have been requested to review the performance of one of the trainees on the final test that was given to all trainees The mean and standard deviation of the test scores are 70 ar distribution of scores is bell shaped and symmetric Suppose the trainee in question received a score of 67 Compute the trainee s z score OA Z 1 50 OB Z 0 93 OC z 0 93 OD z 1 5 MIXE](https://media.kunduz.com/media/sug-question-candidate/20230625011700574072-5366129.jpg?w=256)
Statistics
ProbabilityThis question 1 point s possible Many firms use on the job training to teach their employees computer programming Suppose you work in the personnel department of a firm that just finished training a group of its en you have been requested to review the performance of one of the trainees on the final test that was given to all trainees The mean and standard deviation of the test scores are 70 ar distribution of scores is bell shaped and symmetric Suppose the trainee in question received a score of 67 Compute the trainee s z score OA Z 1 50 OB Z 0 93 OC z 0 93 OD z 1 5 MIXE
![Percentile The graph below is an ogive of scores on a math test The vertical axis in an ogive is the cumulative relative frequency and can also be interpreted as a percentile Use the graph to approximate the test score that corresponds to the 40th percentile Percentile Ranks of Math Test Scores 100 90 80 70 60 50 40 30 20 10 0 0 10 20 30 40 50 60 70 80 90 100 Test Sccore Q a Question 15 of 21 E This quiz 21 This questio OA 15 OB 10 OC 62 OD 56](https://media.kunduz.com/media/sug-question-candidate/20230625011625172690-5366129.jpg?w=256)
Statistics
ProbabilityPercentile The graph below is an ogive of scores on a math test The vertical axis in an ogive is the cumulative relative frequency and can also be interpreted as a percentile Use the graph to approximate the test score that corresponds to the 40th percentile Percentile Ranks of Math Test Scores 100 90 80 70 60 50 40 30 20 10 0 0 10 20 30 40 50 60 70 80 90 100 Test Sccore Q a Question 15 of 21 E This quiz 21 This questio OA 15 OB 10 OC 62 OD 56
![The mean score of a competency test is 80 with a standard deviation of 5 Use the empirical rule to find the percentage of scores between 75 and 85 Assume the data set has a bell shape OA 99 7 OB 95 OC 50 D 68 OOO](https://media.kunduz.com/media/sug-question-candidate/20230625011542714926-5366129.jpg?w=256)
Statistics
ProbabilityThe mean score of a competency test is 80 with a standard deviation of 5 Use the empirical rule to find the percentage of scores between 75 and 85 Assume the data set has a bell shape OA 99 7 OB 95 OC 50 D 68 OOO
![The heights in inches of 10 adult males are listed below Find the sample standard deviation Round to the nearest hundreth 70 72 71 70 69 73 69 68 70 71 OA 2 38 O B 70 O C 3 OD 1 49](https://media.kunduz.com/media/sug-question-candidate/20230625011442274726-5366129.jpg?w=256)
Statistics
StatisticsThe heights in inches of 10 adult males are listed below Find the sample standard deviation Round to the nearest hundreth 70 72 71 70 69 73 69 68 70 71 OA 2 38 O B 70 O C 3 OD 1 49
![K The mean IQ score of adults is 100 with a standard deviation of 15 Use the empirical rule to find the percentage of adults with scores between 70 and 130 Assume the data set has a bell sham distribution OA 68 OB 100 OC 99 7 OD 95](https://media.kunduz.com/media/sug-question-candidate/20230625011511834031-5366129.jpg?w=256)
Statistics
ProbabilityK The mean IQ score of adults is 100 with a standard deviation of 15 Use the empirical rule to find the percentage of adults with scores between 70 and 130 Assume the data set has a bell sham distribution OA 68 OB 100 OC 99 7 OD 95
![K Determine whether the approximate shape of the distribution in the histogram is symmetric uniform skewed left skewed right or none of these 20 18 16 14 12 10 8 6 4 2 L 25 000 45 000 65 000 85 000 This question 1 OA symmetric OB skewed right OC uniform OD skewed left](https://media.kunduz.com/media/sug-question-candidate/20230625011301431461-5366129.jpg?w=256)
Statistics
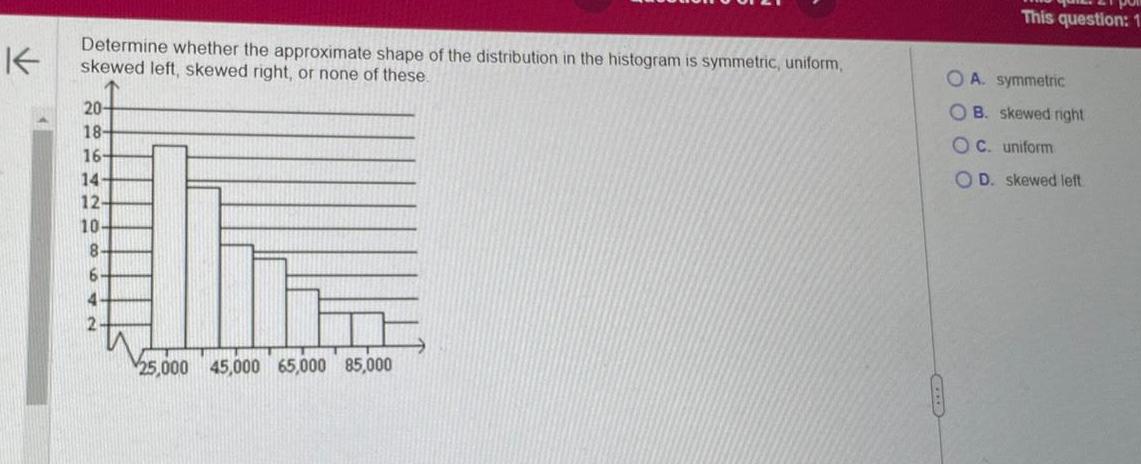
ProbabilityK Determine whether the approximate shape of the distribution in the histogram is symmetric uniform skewed left skewed right or none of these 20 18 16 14 12 10 8 6 4 2 L 25 000 45 000 65 000 85 000 This question 1 OA symmetric OB skewed right OC uniform OD skewed left
![Use the ogive to the right to approximate the sample size O A 100 OB 341 O C 80 GILB This question 1 point s possible Aanba n mber of students 828898 Number of s 9882 Submit Leisure Time of College Students 95 14 5 19 5 24 5 25 Number of hou](https://media.kunduz.com/media/sug-question-candidate/20230625011218693341-5366129.jpg?w=256)
Statistics
StatisticsUse the ogive to the right to approximate the sample size O A 100 OB 341 O C 80 GILB This question 1 point s possible Aanba n mber of students 828898 Number of s 9882 Submit Leisure Time of College Students 95 14 5 19 5 24 5 25 Number of hou
![4 Suppose X is a discrete random variable with possible values X 0 1 2 or 3 Suppose P X 0 0 08 P X 1 0 22 P X 2 0 36 and P X 3 0 34 Find the mean of X Do not round your answer Answer Continue Reset answer](https://media.kunduz.com/media/sug-question-candidate/20230624232818118154-5755666.jpg?w=256)
Statistics
Statistics4 Suppose X is a discrete random variable with possible values X 0 1 2 or 3 Suppose P X 0 0 08 P X 1 0 22 P X 2 0 36 and P X 3 0 34 Find the mean of X Do not round your answer Answer Continue Reset answer
![Determine the original set of data 11 4 6 6 7 12 0 4 6 8 899 13 3 4 4 6 899 14 0 2 3 4 5 15 2 6 Legend 512 represents 5 2 Choose the correct answer below OA 11 4667 12 0468899 13 3446899 14 02345 15 26 OB 11 4 11 6 11 6 11 7 12 0 12 4 12 6 12 8 12 8 12 9 12 9 13 3 13 4 13 4 13 6 13 8 13 9 13 9 14 2 14 3 14 4 14 5 15 2 15 6 OC 114 116 116 117 120 124 126 128 128 129 129 133 134 134 136 138 139 139 140 142 1 145 152 156 OD 11 11 11 11 12 12 12 12 12 12 12 13 13 13 13 13 13 13 14 14 14 14 14 15 15](https://media.kunduz.com/media/sug-question-candidate/20230624231010640351-4832772.jpg?w=256)
Statistics
StatisticsDetermine the original set of data 11 4 6 6 7 12 0 4 6 8 899 13 3 4 4 6 899 14 0 2 3 4 5 15 2 6 Legend 512 represents 5 2 Choose the correct answer below OA 11 4667 12 0468899 13 3446899 14 02345 15 26 OB 11 4 11 6 11 6 11 7 12 0 12 4 12 6 12 8 12 8 12 9 12 9 13 3 13 4 13 4 13 6 13 8 13 9 13 9 14 2 14 3 14 4 14 5 15 2 15 6 OC 114 116 116 117 120 124 126 128 128 129 129 133 134 134 136 138 139 139 140 142 1 145 152 156 OD 11 11 11 11 12 12 12 12 12 12 12 13 13 13 13 13 13 13 14 14 14 14 14 15 15
![researcher wanted to determine the number of televisions in households He conducts a survey of 40 randomly elected households and obtains the data in the accompanying table Complete parts a through h below Click the icon to view the table of television counts Type an integer or a decimal Do not round Construct a frequency histogram of the data Choose the correct graph below A c Frequency Frequency 2 3 Number of Televisions 53 AL 2 Number of Televisions 15 U Q N B O D Frequency Frequency 16 16 0 1 2 3 4 Number of Televisions 2 3 Number of Televisions 5 4 5 Q Q N](https://media.kunduz.com/media/sug-question-candidate/20230624231227482687-4832772.jpg?w=256)
Statistics
Statisticsresearcher wanted to determine the number of televisions in households He conducts a survey of 40 randomly elected households and obtains the data in the accompanying table Complete parts a through h below Click the icon to view the table of television counts Type an integer or a decimal Do not round Construct a frequency histogram of the data Choose the correct graph below A c Frequency Frequency 2 3 Number of Televisions 53 AL 2 Number of Televisions 15 U Q N B O D Frequency Frequency 16 16 0 1 2 3 4 Number of Televisions 2 3 Number of Televisions 5 4 5 Q Q N
![In a poll a random sample of 2163 adults aged 18 and over was asked When you see an ad emphasizing that a product is made in your country are you more likely to buy it less likely to buy it or neither more nor less likely to buy It The results of the survey are presented in the side by side graph Complete parts a through d below Likelihood to Buy When Made in Home Country Q Relative Frequency 0 8 0 6 0 4 0 24 0 63 0 32 2 05 18 34 yrs 0 53 0 38 0 09 35 44 yrs 0 5 0 42 0 08 45 54 yrs 0 33 0 58 0 09 55 yrs 1 More likely Less likely Neither c Which age group has a majority of respondents who are less likely to buy when made in their country OA 55 yrs OB 45 54 yrs OC 35 44 yrs OD 18 34 yrs d What is the apparent association between age and likelihood to buy when made in their country OA As age decreases likelihood to buy homegrown increases OB As age increases so does likelihood to buy homegrown](https://media.kunduz.com/media/sug-question-candidate/20230624230522830062-4832772.jpg?w=256)
Statistics
StatisticsIn a poll a random sample of 2163 adults aged 18 and over was asked When you see an ad emphasizing that a product is made in your country are you more likely to buy it less likely to buy it or neither more nor less likely to buy It The results of the survey are presented in the side by side graph Complete parts a through d below Likelihood to Buy When Made in Home Country Q Relative Frequency 0 8 0 6 0 4 0 24 0 63 0 32 2 05 18 34 yrs 0 53 0 38 0 09 35 44 yrs 0 5 0 42 0 08 45 54 yrs 0 33 0 58 0 09 55 yrs 1 More likely Less likely Neither c Which age group has a majority of respondents who are less likely to buy when made in their country OA 55 yrs OB 45 54 yrs OC 35 44 yrs OD 18 34 yrs d What is the apparent association between age and likelihood to buy when made in their country OA As age decreases likelihood to buy homegrown increases OB As age increases so does likelihood to buy homegrown
![n a poll a random sample of 2163 adults aged 18 and over was asked When you see an ad emphasizing that a product is made in your country are you more likely to buy it less likely to buy it or neither more nor less likely to buy t The results of the survey are presented in the side by side graph Complete parts a through d below Likelihood to Buy When Made in Home Country Relative Frequency 0 8 0 6 0 4 0 2 0 63 0 32 0 05 18 34 yrs 0 53 0 38 0 09 35 44 yrs 0 5 0 42 0 08 45 54 yrs The proportion of 18 to 34 year old respondents is The proportion of 35 to 44 year old respondents is 0 33 0 58 0 09 55 yrs Q More likely Less likely Neither a What proportion of 18 to 34 year old respondents are more likely to buy when made in their country What proportion of 35 to 44 year old respondents are more likely to buy when made in their country b What age group has the greatest proportion who are more likely to buy when made in their country OA 55 yrs OB 45 54 yrs OC 18 34 yrs 35 44 yrs](https://media.kunduz.com/media/sug-question-candidate/20230624230502890138-4832772.jpg?w=256)
Statistics
Statisticsn a poll a random sample of 2163 adults aged 18 and over was asked When you see an ad emphasizing that a product is made in your country are you more likely to buy it less likely to buy it or neither more nor less likely to buy t The results of the survey are presented in the side by side graph Complete parts a through d below Likelihood to Buy When Made in Home Country Relative Frequency 0 8 0 6 0 4 0 2 0 63 0 32 0 05 18 34 yrs 0 53 0 38 0 09 35 44 yrs 0 5 0 42 0 08 45 54 yrs The proportion of 18 to 34 year old respondents is The proportion of 35 to 44 year old respondents is 0 33 0 58 0 09 55 yrs Q More likely Less likely Neither a What proportion of 18 to 34 year old respondents are more likely to buy when made in their country What proportion of 35 to 44 year old respondents are more likely to buy when made in their country b What age group has the greatest proportion who are more likely to buy when made in their country OA 55 yrs OB 45 54 yrs OC 18 34 yrs 35 44 yrs