Statistics Questions
The best high school and college tutors are just a click away, 24×7! Pick a subject, ask a question, and get a detailed, handwritten solution personalized for you in minutes. We cover Math, Physics, Chemistry & Biology.

Statistics
Statisticsa Marital status c Pain level scale of 0 to 10 intake form Identify the level of measurement of the data a What is the level of measurement for Marital status O Nominal O Ratio O Interval O Ordinal b What is the level of measurement for Year of birth O Ordinal O Nominal O Interval O Ratio c What is the level of measurement for Pain level scale of 0 to 10 O Ratio O Ordinal O Interval O Nominal d What is the level of measurement for Height O Nominal O Interval O Ordinal UP b Year of birth d Height

Statistics
StatisticsIdentify the sampling technique used A researcher for an airline interviews all of the passengers on five randomly selected flights A random B cluster C stratified D systematic O E convenience

Statistics
StatisticsComplete the table Grade Relative frequency A 0 0833 B 11 0 3055 C 15 0 4166 D 4 0 1111 F 3 0 083 Round to two decimal places as needed Frequency 3 One or more of your responses is incorrect At least one of your answers is incorrect The relative frequency of any category is the fraction or percentage of the data values that fall in that category The formula for relative frequency as a percentage is given below frequency in category total frequency x 100 The sum of the percentages should be 100 with a small discrepancy allowed for rounding errors so a sum such as 99 or 101 is acceptable

Statistics
ProbabilitySimple Event Enter fractions in reduced form using a for the fraction bar Do not use any spaces in your answer except for the Outcome of Interest G R Y marbles and one blue marble respectively Outcome of Interest Choose a marble that is not green Choose a marble that is not red roles three green marbles two yellow Choose a marble that is not blue Choose a marble that is not yellow 1 P x where x is the probability of choosing the color 1 1 1 2 19 P x where I is the simple event P G 7 10 P R P Y

Statistics
ProbabilityA modified roulette wheel has 36 slots One slot is 0 another is 00 and the others are numbered 1 through 34 respectively You are placing a bet that the outcome is an odd number In roulette 0 and 00 are neither odd nor even a What is your probability of winning 17 36 The probability of winning is Type an integer or a simplified fraction b What are the actual odds against winning The actual odds against winning are 19 17 c When you bet that the outcome is an odd number the payoff odds are 1 1 How much profit do you make if you bet 14 and win If you win the payoff is s

Statistics
Statisticsmodified roulette wheel has 36 slots One slot is 0 another is 00 and the others are numbered 1 through 34 respectively You are placing a bet that the outcome is an odd Limber In roulette 0 and 00 are neither odd nor even a What is your probability of winning 17 36 The probability of winning is Type an integer or a simplified fraction b What are the actual odds against winning The actual odds against winning are

Statistics
ProbabilityA modified roulette wheel has 40 slots One slot is 0 another is 00 and the others are numbered 1 through 38 respectively You are placing a bet that the outcome is an even number In roulette 0 and 00 are neither odd nor even a What is your probability of winning 19 40 The probability of winning is Type an integer or a simplified fraction b What are the actual odds against winning The actual odds against winning are GEXED

Statistics
Statisticsause the mean is very sensitive to extreme values it is not a resistant measure of center By deleting some low values and high values the trimmed mean is more stant To find the 10 trimmed mean for a data set first arrange the data in order then delete the bottom 10 of the values and delete the top 10 of the values then culate the mean of the remaining values Use the axial loads pounds of aluminum cans listed below for cans that are 0 0111 in thick Identify any outliers then compare median mean 10 trimmed mean and 20 trimmed mean 248 259 267 273 277 279 281 283 284 284 287 288 288 290 294 295 296 298 308 505 Type an integer or decimal rounded to one decimal place as needed Compare the values Choose the correct answer below ID OA The median untrimmed mean and 20 trimmed mean are close to each other However the 10 trimmed mean is significantly different from those values OB The untrimmed mean 10 trimmed mean and 20 trimmed mean are close to each other However the median is significantly different from those values OC The median untrimmed mean and 10 trimmed mean are close to each other However the 20 trimmed mean is significantly different from those values OD The median 10 trimmed mean and 20 trimmed mean are close to each other However the untrimmed mean is significantly different from those values OE All of the values are close to each other

Statistics
Statisticsgiven data to construct a boxplot and identify the 5 number summary 146 135 143 125 OA 148 Which boxplot below represents the data O C second year medical students at a hospital measured the blood pressure of the same person The systolic readings mm Hg are listed below Use the 120 120 130 140 Blood Pressure mm Hg 130 140 150 150 o OU Q Q 120 126 130 ITS OB OD 138 120 120 Points 0 33 of 1 130 143 130 140 Blood Pressure mm Hg 138 140 150 140 Q of 14 points 139 150 C Save

Statistics
StatisticsFor which of the following scenarios would it be appropriate to use a one sample z test choose one or more Comparing the average weight of newborns in Hospital A to the average weight of newborns in Hospital B Comparing the results of Likert scale patient satisfaction scores of patients at the VA against the Likert scale patient satisfaction scores of the overall population of patients Comparing political affiliation scores ranging from 0 20 of ASU students against the political affiliation scores of all college students Comparing the number of packs of cigarettes smoked per day by a sample of rural residents with the number of cigarettes smoked per day by all persons in the USA

Statistics
StatisticsWhich of the following IS ARE true about measures of effect choose one or more they aid in the interpretation of statistical results there are many different types of measures of effect They are affected by sample size You can compare measures of effects from different studies with the same outcome measure

Statistics
StatisticsThe purpose of the one sample test is choose one or more To examine the difference between one sample and a population To compare a test statistic to alpha Compare a sample and population on a variable that is interval ratio in measure bility that o comple and population are the same with respect to a particular

Statistics
StatisticsWhen would you use the confidence interval formula for a proportion choose one or more You do not know the standard deviation You have summary information as a percentage or survey sample data To determine if the groups are significantly different Your sample size is under 30

Statistics
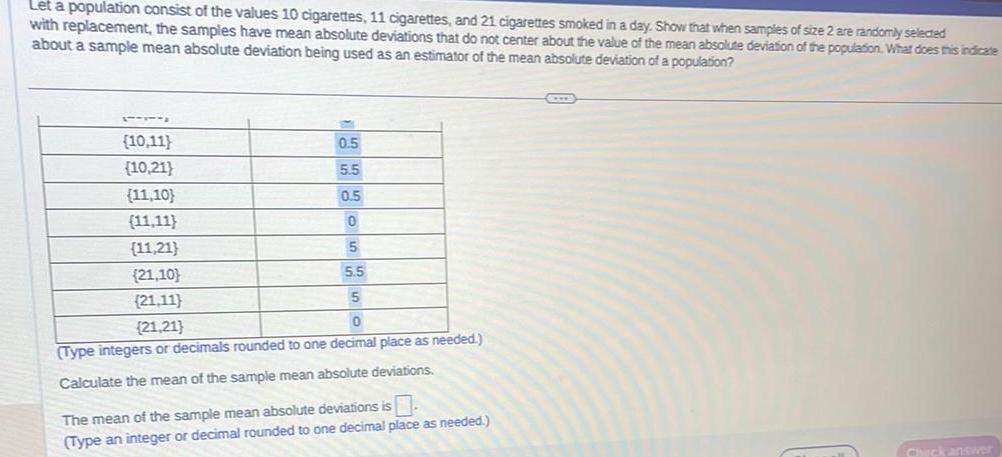
StatisticsLet population consist of the values 10 cigarettes 11 cigarettes and 21 cigarettes smoked in a day Show that when samples of size 2 are randomly selected with replacement the samples have mean absolute deviations that do not center about the value of the mean absolute deviation of the population What does this in about a sample mean absolute deviation being used as an estimator of the mean absolute deviation of a population 21 10 21 11 C 5 5 5 21 21 0 Type integers or decimals rounded to one decimal place as needed Calculate the mean of the sample mean absolute deviations The mean of the sample mean absolute deviations is 2 4 Type an integer or decimal rounded to one decimal place as needed Calculate the population mean absolute deviation The population mean absolute deviation is Type an integer or decimal rounded to one decimal place as needed Points 0 75 of 1 porns

Statistics
StatisticsPoints 0 75 of 1 population consist of the values 10 cigarettes 11 cigarettes and 21 cigarettes smoked in a day Show that when samples of size 2 are randomly selected with replacement the samples have mean absolute deviations that do not center about the value of the mean absolute deviation of the population What does this indicate about a sample mean absolute deviation being used as an estimator of the mean absolute deviation of a population 11 11 11 21 21 10 21 11 0 5 5 5 5 21 21 0 Type integers or decimals rounded to one decimal place as needed Calculate the mean of the sample mean absolute deviations The mean of the sample mean absolute deviations is 2 4 Type an integer or decimal rounded to one decimal place as needed Calculate the population mean absolute deviation The population mean absolute deviation is Type an integer or decimal rounded to one decimal place as needed Save
Statistics
StatisticsLet a population consist of the values 10 cigarettes 11 cigarettes and 21 cigarettes smoked in a day Show that when samples of size 2 are randomly selected with replacement the samples have mean absolute deviations that do not center about the value of the mean absolute deviation of the population What does this indicate about a sample mean absolute deviation being used as an estimator of the mean absolute deviation of a population 11 10 11 0 5 10 21 5 5 11 10 0 5 11 11 0 11 21 5 21 10 5 5 5 21 11 0 21 21 Type integers or decimals rounded to one decimal place as needed Calculate the mean of the sample mean absolute deviations The mean of the sample mean absolute deviations is Type an integer or decimal rounded to one decimal place as needed Chick answer

Statistics
StatisticsFind the standard deviation s of sample data summarized in the frequency distributor represents the class frequency and n represents the total number of sample values Also compare the computed standard deviation to the standard deviation obtained from the original list of data values 11 1 S 1 x x n n 1 Interval Frequency 20 29 30 39 3 40 49 6 OA The computed value is significantly less than the given value B The computed value is significantly greater than the given value OC The computed value is not significantly different from the given value 50 59 4 60 69 11 70 79 32 80 89 29 Standard deviation 14 4 Round to one decimal place as needed Consider a difference of 20 between two values of a standard deviation to be significant How does this computed value compare with the given standard deviation 11 1

Statistics
StatisticsSample data for the arrival delay times in minutes of airlines flights is given below Determine whether they appear to be from a population with a normal distribution Assume that this requirement is loose in the sense that the population distribution need not be exactly normal but it must be a distribution that is roughly bell shaped Click the icon to view the data set Is the requirement of a normal distribution satisfied OA No because the histogram of the data is not bell shaped there is more than one outlier and the points in the normal quantile plot do not lie reasonably close to a straight line OB No because the histogram of the data is bell shaped there are less than two outliers and the points in the normal quantile plot lie reasonably close to a straight line OC Yes because the histogram of the data is not bell shaped there is more than one outlier and the points in the normal quantile plot do not lie reasonably close to a straight line OD Yes because the histogram of the data is bell shaped there are less than two outliers and the points in the normal quantile plot lie reasonably close to a straight line Arrival delay times minutes 35 5 28 12 10 95 29 1 24 38 45 36 Arrival delay times minutes 32 33 26 10 30 15 9 19 28 45 109 28 16 31 16 2 34 29 37 38 39 12 4 10 12 27 25 5 X st in ed rism c er he

Statistics
Statisticsa Find the mean number of births per day b Find the probability that in a single day there are 19 births c Find the probability that in a single day there are no births Would 0 births in a single day be a significantly low number of births a The mean number of births per day is Round to one decimal place as needed b The probability that in a day there are 19 births is Do not round until the final answer Then round to four decim places as needed c The probability that in a day there are no births is Round to four decimal places as needed Would 0 births in a single day be a significantly low number of births No because the probability is greater than 0 05 Yes because the probability is 0 05 or less OYes because the probability is greater than 0 05 O No because the probability is 0 05 or less

Statistics
StatisticsAssume that a randomly selected subject is given a bone density test Those test scores are normally distributed with a mean of 0 and a standard deviation of 1 Draw a graph and find the probability of a bone density test score greater than 1 54 Sketch the region Choose the correct graph below OA 1 54 1 54 OB The probability is Round to four decimal places as needed 1 54 O C A 1 54 O D 1 54

Statistics
ProbabilityAn airliner carries 250 passengers and has doors with a height of 70 in Heights of men are normally distributed with a mean of 69 0 in and a standard deviation of 2 8 in Complete parts a through d The probability is Round to four decimal places as needed b If half of the 250 passengers are men find the probability that the mean height of the 125 men is less than 70 in The probability is Round to four decimal places as needed c When considering the comfort and safety of passengers which result is more relevant the probability from part a or the probability from part b Why OA The probability from part b is more relevant because it shows the proportion of flights where the mean height of the male be less than the door height passengers will B The probability from part b is more relevant because it shows the proportion of male passengers that will not need to bend OC The probability from part a is more relevant because it shows the proportion of flights where the mean height of the male passengers will be less than the door height OD The probability from part a is more relevant because it shows the proportion of male passengers that will not need to bend d When considering the comfort and safety of passengers why are women ignored in this case OA There is no adequate reason to ignore women A separate statistical analysis should be carried out for the case of women un

Statistics
StatisticsEach of two parents has the genotype blond red which consists of the pair of alleles that determine hair color and each parent contributes one of those alleles to a child Assume that if the child has at least one blond allele that color will dominate and the child s hair color will be blond a List the different possible outcomes Assume that these outcomes are equally likely b What is the probability that a child of these parents will have the red red genotype c What is the probability that the child will have blond hair color a List the possible outcomes OA blond blond blond red and red red OB blond blond and red red OC blond red and red blond OD blond blond blond red red blond and red red b The probability that a child of these parents will have the red red genotype is Round to two decimal places as needed c The probability that the child will have blond hair color is Round to two decimal places as needed in

Statistics
Statisticsthe arrival delay times in minutes of airlines flights is given below Determine whether they appear to be from a population a normal distribution Assume that this requirement is loose in the sense that the population distribution need not be exactly normal but it m be a distribution that is roughly bell shaped Click the icon to view the data set Is the requirement of a normal distribution satisfied O A No because the histogram of the data is not bell shaped there is more than one outlier and the points in the normal quantile plot do not lie reasonably close to a straight line OB No because the histogram of the data is bell shaped there are less than two outliers and the points in the normal quantile plot lie reasonably close to a straight line OC Yes because the histogram of the data is not bell shaped there is more than one outlier and the points in the normal quantile plot do not lie reasonably close to a straight line OD Yes because the histogram of the data is bell shaped there are less than two outliers and the points in the normal quantile plot lie reasonably close to a straight line Arrival delay times minutes 35 5 28 12 10 95 29 1 24 38 45 36 Arrival delay times minutes 28 45 109 28 16 31 16 2 32 33 26 9 10 30 15 19 34 29 37 38 39 12 4 10 12 27 25 5 C X 53 47 Nord

Statistics
Statisticswith replacement the samples have mean absolute deviations that do not center about the value of the mean absolute deviation of the population What does this indicate of the values 10 cigarettes 11 cigarettes and 21 cigarettes smoked in a day Show that when samples of size 2 are randomly selected about a sample mean absolute deviation being used as an estimator of the mean absolute deviation of a population 771775 10 11 0 5 10 21 5 5 11 10 0 5 11 11 0 11 21 5 21 10 5 5 21 11 5 21 21 0 Type integers or decimals rounded to one decimal place as needed Calculate the mean of the sample mean absolute deviations The mean of the sample mean absolute deviations is Type an integer or decimal rounded to one donimall CID Points 0 of 1 8 5 of 11 points Save

Statistics
Statisticset a population consist of the values 10 cigarettes 11 cigarettes and 21 cigarettes smoked in a day Show that when samples of size 2 are randomly selected with replacement the samples have mean absolute deviations that do not center about the value of the mean absolute deviation of the population What does this indica about a sample mean absolute deviation being used as an estimator of the mean absolute deviation of a population TILB Calculate the mean absolute deviation for each possible sample of size 2 from the population Mean Absolute Deviation Sample 10 10 10 11 10 21 11 10 11 11 11 21 21 10 21 11 21 21 Type integers or decimals rounded to one decimal place as needed Sa

Statistics
StatisticsIn an experiment college students were given either four quarters or a 1 bill and they could either keep the money or spend it on gum The results are summarized in th table Complete parts a through c below Students Given Four Quarters Students Given a 1 Bill Purchased Gum 31 13 Kept the Money 16 26 b Find the probability of randomly selecting a student who kept the money given that the student was given a 1 bill The probability is 0 667 Round to three decimal places as needed c What do the preceding results suggest OA A student given a 1 bill is more likely to have kept the money than a student given four quarters OB A student given a 1 bill is more likely to have kept the money OC A student given a 1 bill is more likely to have spent the money hill is more likely to have spent the money than a student given four quarters

Statistics
StatisticsVolumes cm of 20 brains have a mean of 1056 8 cm and a standard deviation of 124 6 cm Use the given standard deviation and the range rule of thumb t identify the limits separating values that are significantly low or significantly high For such data would a brain volume of 1286 0 cm be significantly high Significantly low values are 807 6 cm or lower Type an integer or a decimal Do not round Significantly high values are 1306 cm or higher Type an integer or a decimal Do not round Is 1286 0 cm significantly high O A No because it is between the limits separating values OB Yes because it is below the lower limit separating value O C No because it is above the upper limit separating value O D Yes because it is between the limits separating values O E No because it is below the lower limit separating value OF Yes because it is above the upper limit separating value

Statistics
StatisticsThe brain volumes cm of 20 brains have a mean of 1056 8 cm and a standard deviation of 124 6 cm Use the given standard deviation and the range rule of thur identify the limits separating values that are significantly low or significantly high For such data would a brain volume of 1286 0 cm be significantly high Significantly low values are 807 6 cm or lower Type an integer or a decimal Do not round Significantly high values are Type an integer or a decimal cm or higher Do not round EXTER

Statistics
ProbabilityAssume that there is a 11 rate of disk drive fallure in a year a If all your computer data is stored on a hard disk drive with a copy stored on a second hard disk drive what is the probability that during a year you can avold catastroph with at least one working drive b If coples of all your computer data are stored on three Independent hard disk drives what is the probability that during a year you can avoid catastrophe with at least on working drive a With two hard disk drives the probability that catastrophe can be avoided is Round to four decimal places as needed

Statistics
ProbabilityThe data represent the results for a test for a certain disease Assume one individual from the group is randomly selected Find the probability of getting someone who tested negative given that he or she had the disease The probability is approximately The individual actually had the disease Yes No 135 23 Positive Negative Round to three decimal places as needed www 10 132

Statistics
StatisticsBased on a poll 69 of Internet users are more careful about personal information when using a public Wi Fi hotspot What is the probability that among three randomly selected Internet users at least one is more careful about personal information when using a public Wi Fi hotspot How is the result affected by the additional information that the survey subjects volunteered to respond P The probability that at least one of them is careful about personal information is Round to three decimal places as needed

Statistics
ProbabilityIn an experiment college students were given elther four quarters or a 1 bill and they could elther keep the money or spend it on gum The results are summarized in the table Complete parts a through c below Students Given Four Quarters Students Given a 1 Bill Purchased Gum 31 16 Kept the Money 12 29 a Find the probability of randomly selecting a student who spent the money given that the student was given four quarters The probability is Round to three decimal places as needed

Statistics
ProbabilityIn a certain country the true probability of a baby being a boy is 0 515 Among the next nine randomly selected births in the country what is the probability that at least one of them is a girt The probability is Round to three decimal places as needed

Statistics
ProbabilityIf n 20 what constant do we use to calculate the 99 confidence interval of the mean O 2 861 O2 086 O 2 846

Statistics
StatisticsSuppose that 12 of all steel shafts produced by a certain process are nonconforming but can be reworked rather than having to be scrapped Consider a random sample of 200 shafts and let X denote the number among these that are nonconforming and can be reworked Round your answers to four decimal places USE SALT a What is the approximate probability that X is at most 30 b What is the approximate probability that X is less than 30 c What is the approximate probability that X is between 15 and 25 inclusive

Statistics
StatisticsWhy do we need confidence intervals choose one or more To express statistical uncertainty To give insight about the magnitude of the effect To accurately state a range of a population parameter To tell us the chance 95 of a particular outcome

Statistics
StatisticsTUI The accompanying table lists the ages of acting award winners matched by the years in which the awards were won Construct a scatterplot find the value of the linear correlation coefficient r and find the P value of r Determine whether there is sufficient evidence to support a claim of linear correlation between the two variables Should we expect that there would be a correlation Use a significance level of a 0 01 Click the icon to view the ages of the award winners Construct a scatterplot Choose the correct graph below OA 70 20 20 Q 70 TABLETE 70 Best Actress years B 70 20 20 70 Best Actress years OC The linear correlation coefficient is r Round to three decimal places as needed 4 20 20 70 Best Actress years OD Q 70 20 20 70 Best Actress years G 0 4

Statistics
StatisticsIf n 15 what constant do we use to calculate the 95 confidence interval of the mean O2 132 O2 145

Statistics
StatisticsFor a sample with df 5 what is the t score constant to calculate a confidence level of 99 4 032 O 2 015 2 571

Statistics
ProbabilityA college professor never finishes his lecture before the end of the hour and always finishes his lectures within 2 min after the hour Let X the time that elapses between the end of the hour and the end of the lecture and suppose the pdf of X is as follows kx 0 x 2 otherwise a Find the value of k Enter your answer to three decimal places Draw the corresponding density curve Hint Total area under the graph of f x is 1 f x f x 1 5 1 0 0 5 f x 1 5 1 0 0 5 0 5 0 5 1 0 1 0 1 5 1 5 2 0 2 0 X 1 5 3197633301 1 0 0 5 f x 1 5 1 0 0 5 0 5 0 5 1 0 1 0 1 5 1 5 2 0 2 0 b What is the probability that the lecture ends within 1 min of the end of the hour Enter your answer to three decimal places c What is the probability that the lecture continues beyond the hour for between 60 and 90 sec Round your answer to four decimal places X X Page 2 of 11

Statistics
StatisticsWhat affects the width of a confidence interval choose one or more O Variation within the population O Sample size O Median of the sample Our desired confidence level

Statistics
StatisticsIn order to determine whether or not you will reject the null hypothesis alpha should be compared to which of the following Obtained value Significance level O p value O Critical value

Statistics
StatisticsWhich of the following statements about the p value is true O A very small p value allows us to say there is enough evidence to accept the p value O The p value is the chance of getting an observed effect if the alternative hypothesis was true O The p value is the probability of the sample data arising by chance O The p value is the chance of getting an observed effect if the null hypothesis was true

Statistics
StatisticsSuppose 243 subjects are treated with a drug that is used to treat pain and 52 of them developed nausea Use a 0 10 significance level to test the claim that more than 20 of users develop nausea Identify the test statistic for this hypothesis test The test statistic for this hypothesis test is 0 55 Round to two decimal places as needed Identify the P value for this hypothesis test The P value for this hypothesis test is 0 291 Round to three decimal places as needed Identify the conclusion for this hypothesis test O A Reject Ho There is not sufficient evidence to warrant support of the claim that more than 20 of users develop nausea O B Fail to reject Ho There is not sufficient evidence to warrant support of the claim that more than 20 of users develop nausea OC Reject Ho There is sufficient evidence to warrant support of the claim that more than 20 of users develop nausea OD Fail to reject Ho There is sufficient evidence to warrant support of the claim that more than 20 of users 1 50 3 3

Statistics
StatisticsXO 0 1 2 3 P x 0 3 0 3 0 3 0 1 Find the standard deviation of this probability distribution Give your answer to at least 2 decimal 0 96 X Question Help Moreo

Statistics
Statisticse null and alternative hypothesis in symbols would be Ho p 0 6 H p 0 6 O Ho p 0 6 H p 0 6 Ho p 0 6 H 0 6 Ho p 0 6 H 0 6 Ho p 0 6 H p 0 6 Ho p 0 6 H 0 6 ne null hypothesis in words would be The proportion of all people that prefer Trydint gum is greater than 0 6 The proportion of people in a sample that prefer Trydint gum is not 0 6 O The proportion of all people that prefer Trydint gum is 0 6 16 tv The proportion of all people e preter Tyan and greater than OTOT The proportion of people in a sample that prefer Trydint gum is not 0 6 The proportion of all people that prefer Trydint gum is 0 6 The average of people that prefer Trydint gum is not 0 6 The proportion of all people that prefer Trydint gum is less than 0 6 The average of people that prefer Trydint gum is 0 6 The proportion of people in a sample that prefers Trydint gum is 0 6 The point estimate is 0 095 MacBook Air Based on a sample of 460 people 257 said they prefer Trydint gum to Eklypse x to 3 decimals The 95 confidence interval is 0513 0513 to 0604

Statistics
Statistics31 felled black cherry trees The diameter of the tree is measured 4 5 feet above the ground 9 Volume in cubic ft 1 70 40 10 D 70 30 F1 65 Volum 2 F2 10 000 8 75 Height in ft 2 16 DL Homepage MTH 243 22063 Statistics I 80 F3 D 12 A 0 a F4 0 0 tv 85 do L 2 F5 16 Diameter in inches a Describe the relationship between volume and height of these trees Oweak moderate positive A Impacts of Industria strong positive b Describe the relationship between volume and diameter of these trees MacBo A Volume in cubic ft esc 70 40 10000 8 Volum a Describe the relationship between volume and height of these trees Oweak moderate positive Ostrong positive b Describe the relationship between volume and diameter of these trees Oweak moderate positive Ostrong positive 0 F1 10000 8 Homepage MTH 243 22063 Statistics I 16 Diameter in inches F2 12 16 12 80 F3 4 a F4 16 Diameter in inches a Describe the relationship between volume and height of these trees weak moderate positive 0 strong positive b Describe the relationship between volume and diameter of these trees weak moderate positive tv 20 0 G F5 Apple Impacts of Industrial Agriculture 2 20 Ma Ostrong positive c Suppose you have height and diameter measurements for another black cherry tree Which of the variables would be preferable to ure

Statistics
StatisticsThe nut hypothesis in words would be The proportion of all people that prefer Trydint gam is greater than 0 The proportion of people is a sample that prefer t The proportion of all people that prefer Trium0 The average of people that prefer Trykt gum is not 0 6 The proportion of all people that prefer Trying than s The average of people that prefer Trygum 06 ese 1 ock 47 1 P Q A NB 000 2 N F W S 3 a E X 64 di R 20 C 5 D F Safari Fie Edit View History Bookmarks Window Help The average of people that prefer Trydint gum is not 0 6 The proportion of all people that prefer Trydint gan is less than 0 6 The average of people that prefer Trydint gumi 0 6 The proportion of people is a sample that prefers Trydint gun is 0 6 Based on a sample of 460 people 257 said they prefer Trydin punto The point estimate is to 3 decimals Mag MTH 243 22063 Statistic pacts of wa The proportion of people in a sample that prefer Trydint gum is not 0 6 The proportion of all people that prefer Trydingum s0 6 MacBook T 60 V S G Apple rtion of all people that prefer Trydint gumis 0 6 The average of people that prefer Tryding is not 0 6 The proportion of all people that prefer Trydint gum is less than 0 6 The average of people that prefer Trydingum 0 4 The proportion of people in a sample that prefers Trydnt guns 0 6 Based on a sample of 450 people 257 said they prefer Trydint qum to Eklyp The pointestinate i to 3 decimals The 95 confidence intervals Based on this we eject the null hype Fall to reject the nut hypothesis Question Help Message instructor Dotto forum 8005 esc 47 WT 2 3 140 19 to 4 di Safari File Edit View History Bookmarks Window Hip Hompage MTH 243 22083 States The proportion of people in a sample that prefer Trydiet gum is not 0 6 The proportion of all people that prefer Trydint gumis 0 6 The average of people that prefer Trydint gum is not 0 6 The proportion of all people that prefer Trydint gan is less than 0 6 The average of people that prefer Trydint gum in 0 6 The proportion of people in a sample that prefers Trydint gum is 0 6 to 3 decima Based on a sample of 440 people 257 said they prefer Trydint gum to typur The point estimate is to 3 decima 65 16 Arc Impacts of industrial Agr 4
Statistics
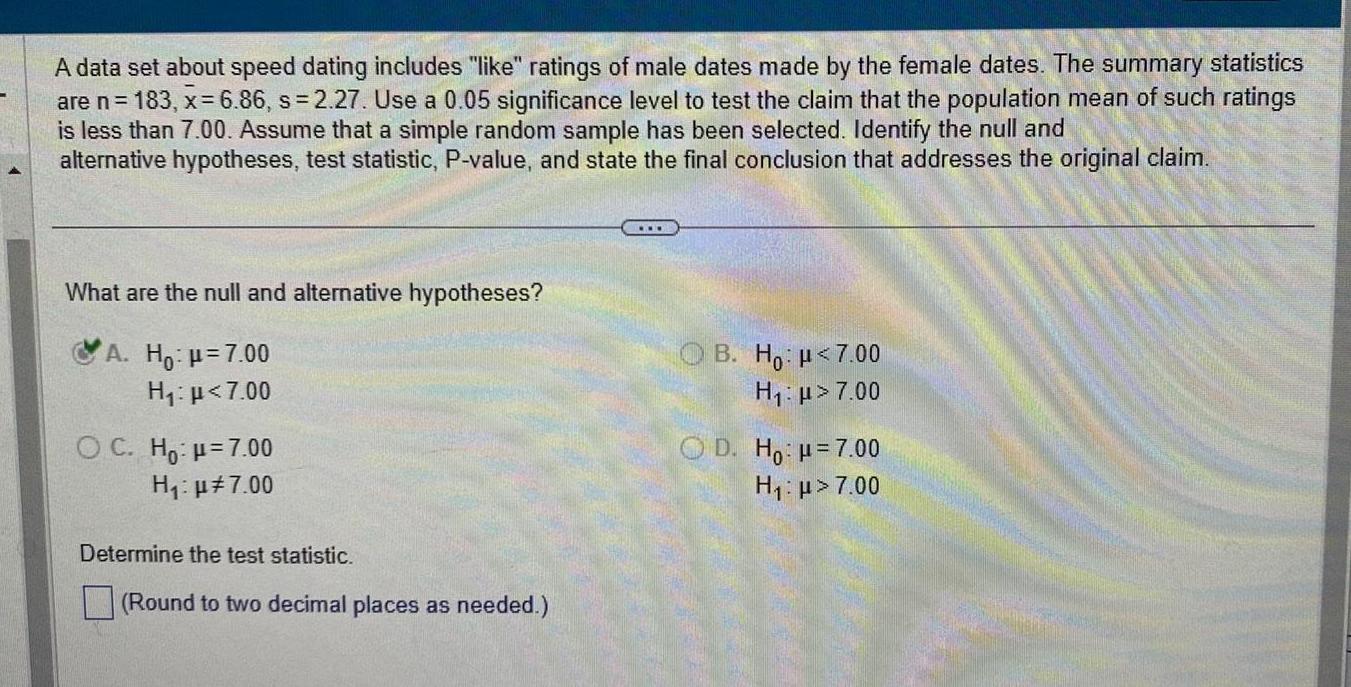
StatisticsA data set about speed dating includes like ratings of male dates made by the female dates The summary statistics are n 183 x 6 86 s 2 27 Use a 0 05 significance level to test the claim that the population mean of such ratings is less than 7 00 Assume that a simple random sample has been selected Identify the null and alternative hypotheses test statistic P value and state the final conclusion that addresses the original claim What are the null and alternative hypotheses A Ho p 7 00 H 7 00 OC Ho p 7 00 H 7 00 Determine the test statistic Round to two decimal places as needed OB Ho 7 00 H 7 00 D Ho H 7 00 H 7 00

Statistics
StatisticsIf z follows the standard normal distribution find P z 1 Remember that o from 1 to 1 is 0 68 Select the correct answer below O 0 68 O 0 32 O 0 2 O 0 16 FEEDBACK MORE INSTRUCT