Statistics Questions
The best high school and college tutors are just a click away, 24×7! Pick a subject, ask a question, and get a detailed, handwritten solution personalized for you in minutes. We cover Math, Physics, Chemistry & Biology.

Statistics
StatisticsF 10 r e 8 9 u6 e n 4 ACY y Question 2 10 20 30 40 50 60 70 80 Quiz Score 8 Choose the statement that best describes the distribution The median score is between 80 and 90 100 The median is smaller than the mean The distribution is mound shaped and symmetric Approximately 30 of the student quiz scores are lower than 60 1 F
Statistics
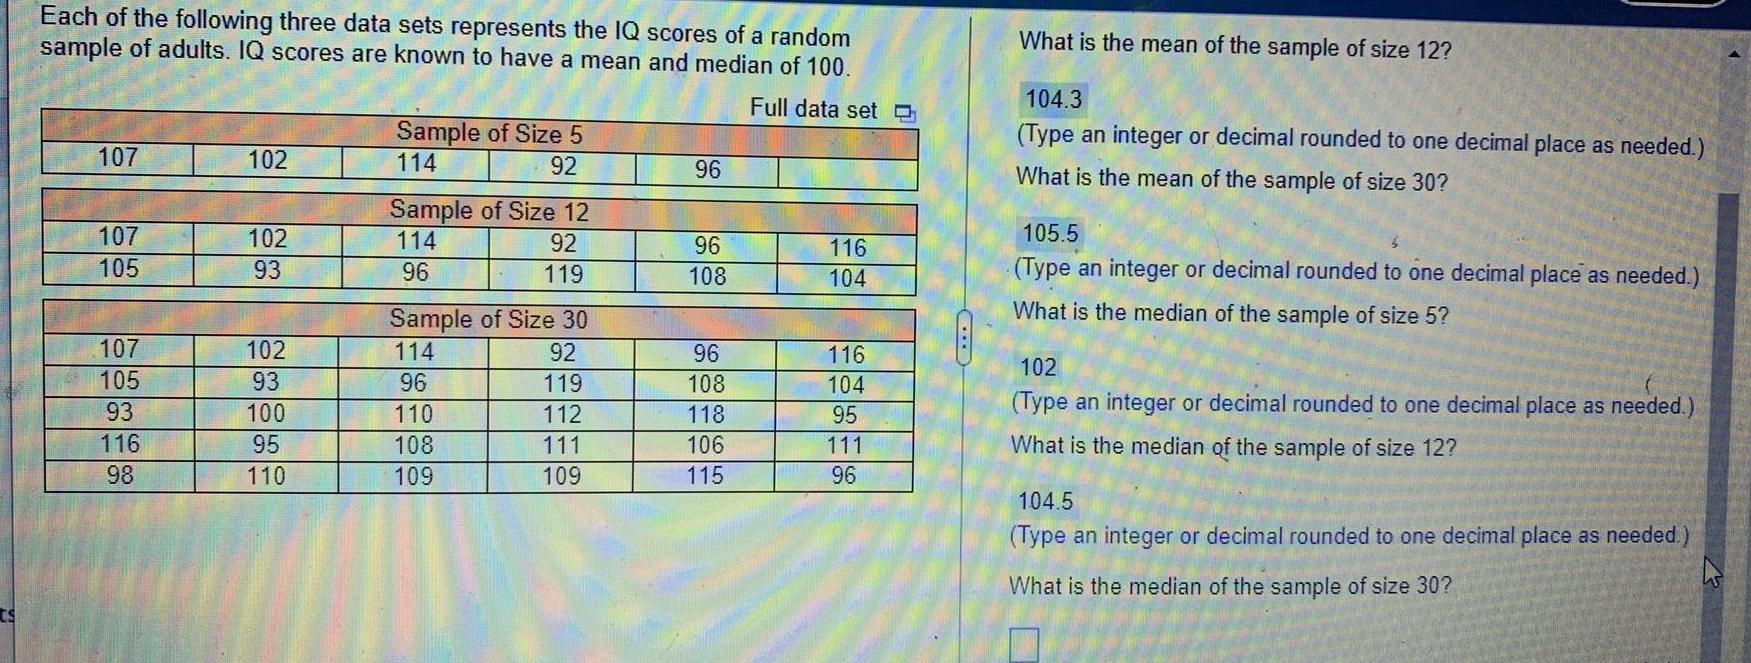
Statisticsts Each of the following three data sets represents the IQ scores of a random sample of adults IQ scores are known to have a mean and median of 100 Full data set 107 107 105 107 105 93 116 98 102 102 93 102 93 100 95 110 Sample of Size 5 92 114 Sample of Size 12 114 92 96 119 Sample of Size 30 114 92 96 119 110 112 108 111 109 109 96 96 108 96 108 118 106 115 116 104 116 104 95 111 96 What is the mean of the sample of size 12 104 3 Type an integer or decimal rounded to one decimal place as needed What is the mean of the sample of size 30 105 5 Type an integer or decimal rounded to one decimal place as needed What is the median of the sample of size 5 102 Type an integer or decimal rounded to one decimal place as needed What is the median of the sample of size 12 104 5 Type an integer or decimal rounded to one decimal place as needed What is the median of the sample of size 30 43
Statistics
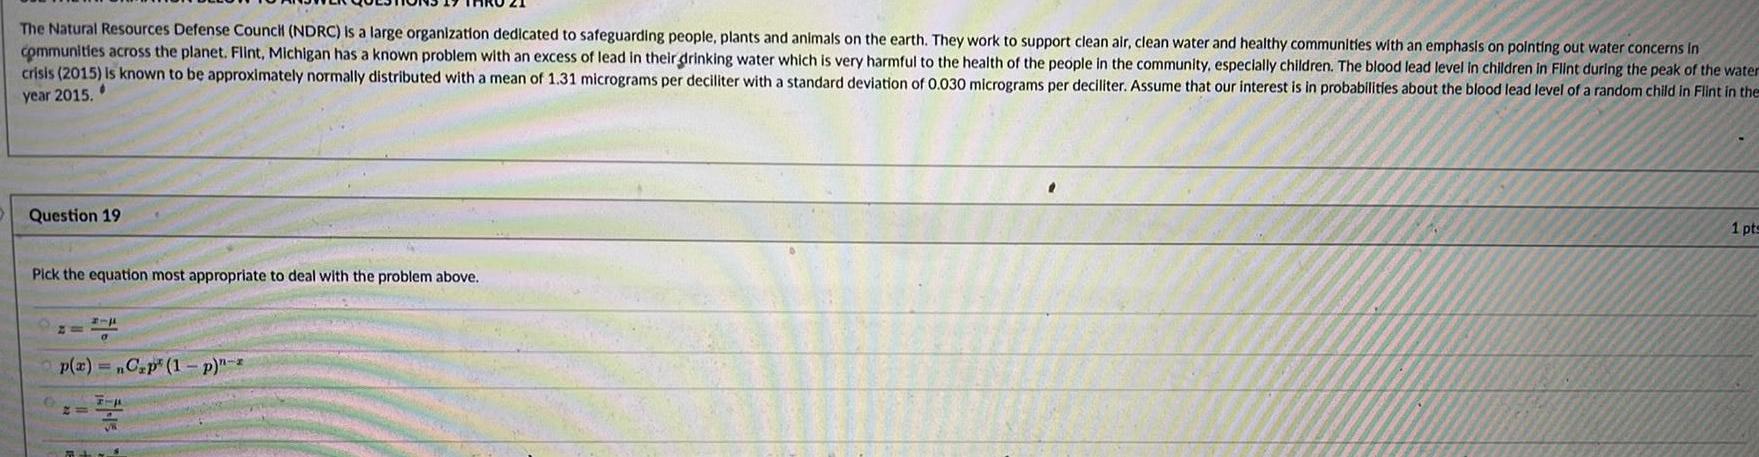
ProbabilityThe Natural Resources Defense Council NDRC is a large organization dedicated to safeguarding people plants and animals on the earth They work to support clean air clean water and healthy communities with an emphasis on pointing out water concerns in communities across the planet Flint Michigan has a known problem with an excess of lead in their drinking water which is very harmful to the health of the people in the community especially children The blood lead level in children in Flint during the peak of the water crisis 2015 is known to be approximately normally distributed with a mean of 1 31 micrograms per deciliter with a standard deviation of 0 030 micrograms per deciliter Assume that our interest is in probabilities about the blood lead level of a random child in Flint in the year 2015 Question 19 Pick the equation most appropriate to deal with the problem above 2 p x nCap 1 p FIA MS C 1 pts

Statistics
ProbabilityDo you carpool Let X represent the number of occupants in a randomly chosen car on a certain stretch of highway during morning commute hours A survey of cars showed that the probability distribution of X is as follows 1 P x 0 67 x Send data to Excel Part 1 of 7 a Find P 4 P 4 Part 2 of 7 2 0 14 Plaronter 3 0 12 b Find P greater than or equal to 2 4 5 0 04 0 03

Statistics
StatisticsWaiting times in minutes of customers in a bank where all customers enter a single waiting line and a bank where customers wait in individual lines at three different teller windows are listed below Find the mean and median for each of the two samples then compare the two sets of results Single Line Individual Lines 6 3 4 1 6 6 5 5 The mean waiting time for customers in a single line is 6 7 6 0 minutes 6 8 6 2 6 9 6 4 7 1 7 6 7 4 7 6 7 6 8 4 7 6 9 0 7 6 9 8 D

Statistics
StatisticsDistributions Identify the lower class limits upper class limits class width class midpoints and class boundaries for the given frequency distribution Also identify the number of individuals included in the summary Blood Platelet Count of Females 1000 cells L Frequency 100 199 26 91 200 299 300 399 28 400 499 1 500 599 3 Identify the lower class limits 100 200 300 400 500 Type integers or decimals Do not round Use ascending order Identify the upper class limits 199 299 399 499 599 Type integers or decimals Do not round Use ascending order Identify the class width Part 4 of 6 100 Type an integer or a decimal Do not round Identify the class midpoints 0 0 0 0 0 Type integers or decimals Do not round Use ascending order

Statistics
ProbabilityThe Masterfoods company says that before the introduction of purple the distribution of colors among plain M Ms was yellow 0 20 red 0 18 Prob brown Question 1 1 point Orange 0 08 Blue 0 20 Green 0 14 Brown Suppose you have a very large party bag with thousands of plain M M s The bag is so large that drawing one M M from the bag makes no real difference to the proportions of the M M s remaining in the bag You pick one M M at random from the bag

Statistics
ProbabilityAn automobile tire manufacturer collected the data in the table relating tire pressure x in pounds per square inch and mileage in thousands of miles Use quadratic regression on a graphing utility to find the quadratic function f x that best fits the data f x x x Round to three decimal places as needed x 28 30 32 34 36 Mileage 44 50 56 51 45

Statistics
StatisticsThe following plot is a sampling distribution for the average Hollywood Movie Budget from the early 2000 s in millions of dollars Sampling Dotplot of Mean Left Tail Two Tail Right Tail 50 40 30 20 10 0 35 40 IL 45 50 You should expect a majority of Hollywood movie budgets to be 60 55 65 51 127 Given this sampling distribution you should expect to obtain a mean sampling budget for Hollywood movies above 55 million roughly of the time samples 100 mean 51 127 std error 5 522 55 million

Statistics
StatisticsWhen survey data indicated that a coffee company needed to improve its package sealing process an experiment was conducted to determine the factors in the bag sealing equipment that might b affecting the ease of opening the bags without tearing the inner liner of the bag Data were collected on 19 bags and the plate gap on the bag sealing equipment was used to predict the tear rating a bag Complete parts a through c Click the icon to view the data table X a Construct a 90 confidence interval estimate of the mean tear rating for all bags of coffee when the plate gap is 0 3 HY X 0 35 S Type integers or decimals Round to three decimal places as needed Use ascending order Data table Bag 1 2 3 4 5 6 7 8 9 10 11 12 13 14 15 16 17 18 Plate gap X 0 3 0 30 2 10 2 10 0 30 0 30 0 00 0 00 0 30 1 80 1 80 3 00 1 50 0 30 3 00 1 80 1 50 1 50 Tear rating D Y 0 08 0 08 0 42 0 88 0 37 0 35 0 78 1 98 0 22 0 18 0 13 3 72 0 07 0 54 0 08 0 08 0 42 4 38

Statistics
StatisticsA magazine collected the ratings for food decor service and the cost per person for a sample of 97 restaurants They combined the ratings to create a summated rating and used that to predict cost of a restaurant meal The data are modeled by Y 17 162 0 9876X where X is the summated ratings and is meal cost For these data Syx 8 801 X 62 34 and h 0 043844 wi X 50 Complete parts a through c a Construct a 95 confidence interval estimate of the mean cost of a meal for restaurants that have a summated rating of 50 14 757 SHY X X 49 679 Type integers or decimals Round to three decimal places as needed Use ascending order

Statistics
StatisticsThe following data represent the calories and sugar in grams of various breakfast cereals Product Calories Sugar 210 6 0 230 2 1 270 14 0 340 20 4 380 16 5 ABCDEFG 420 480 Use the data above to complete parts a through d 16 1 16 2 a Compute the covariance Round to three decimal places as needed

Statistics
ProbabilityIn order to say that a distribution is negatively skewed which of the following must be true choose one or more O Right tail must be longer than the left O Right and left tails must be equal O Curve must be bell shaped Left tail must be longer than the right
Statistics
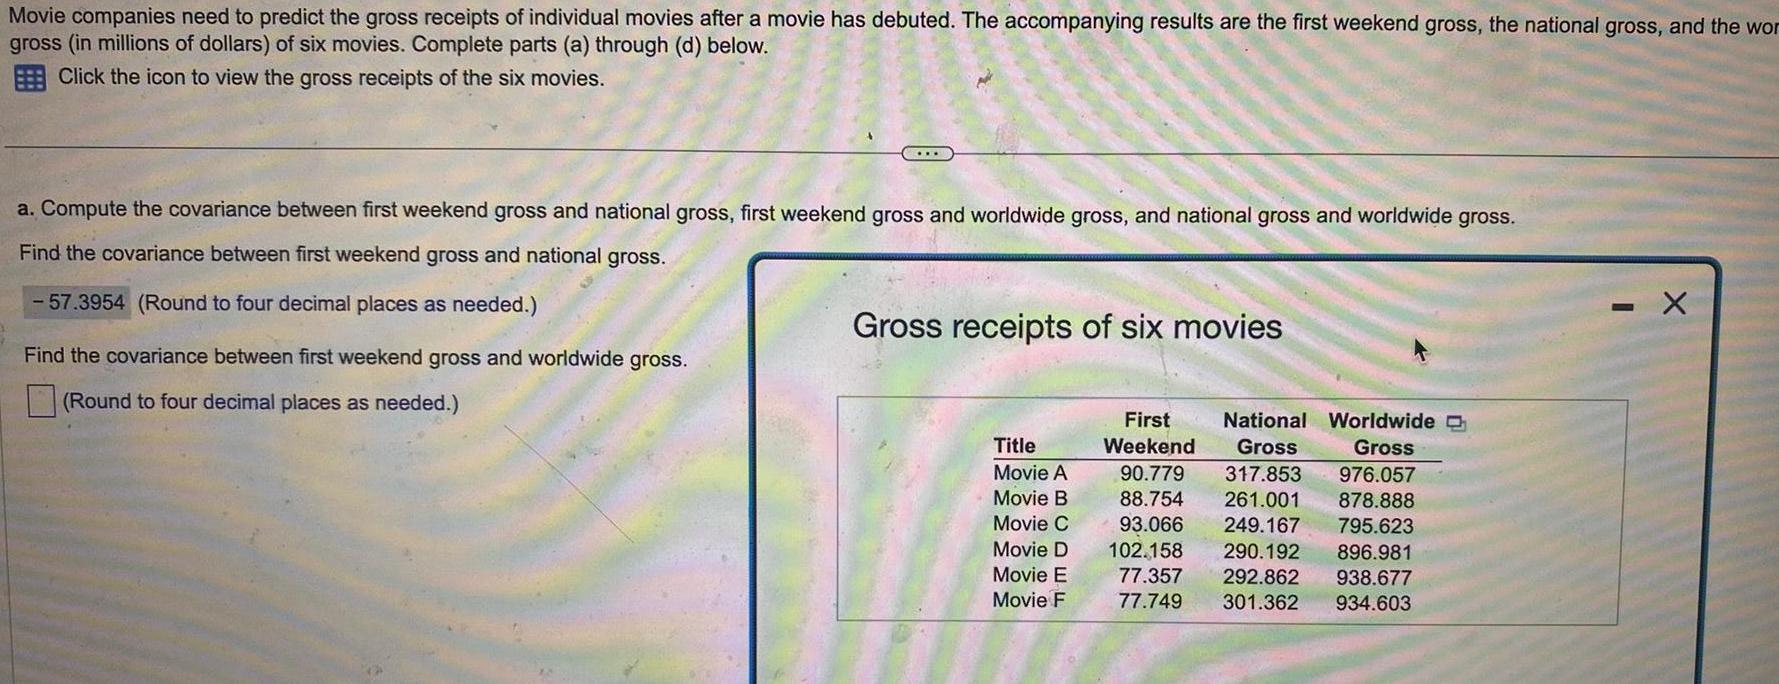
StatisticsMovie companies need to predict the gross receipts of individual movies after a movie has debuted The accompanying results are the first weekend gross the national gross and the wor gross in millions of dollars of six movies Complete parts a through d below Click the icon to view the gross receipts of the six movies a Compute the covariance between first weekend gross and national gross first weekend gross and worldwide gross and national gross and worldwide gross Find the covariance between first weekend gross and national gross 57 3954 Round to four decimal places as needed Find the covariance between first weekend gross and worldwide gross Round to four decimal places as needed Gross receipts of six movies Title Movie A Movie B Movie C Movie D Movie E Movie F First National Worldwide a Weekend Gross 90 779 317 853 88 754 261 001 93 066 102 158 Gross 976 057 878 888 249 167 795 623 290 192 896 981 77 357 292 862 938 677 77 749 301 362 934 603 X

Statistics
StatisticsGiven that the population of women s height has a mean of 63 6 inches and a standard deviation of 2 5 inches answer the following questions What is the z score corresponding to a height of 71 inches 2 96 0 70 O 1 34 O 2 56

Statistics
ProbabilityIf the kurtosis value is negative which of the following statements are true choose one or more The dstribution is platykurtic The distribution is leptokurtic The distribution is flat The distribution is peaked

Statistics
StatisticsWhich of the following represents a directional research hypothesis O H 1 2 O Ho 1 u2 O H M M2 O Ho

Statistics
StatisticsIf you want to calculate a z score for a test where your individual score was 26 what other information must you know choose one or more standard deviation median sample size mean

Statistics
Statisticsigarettes Do the cigarette filters appear to be effective Hint The filters reduce the amount of tar ingested by the smoker Click the icon to view the frequency distributions Complete the relative frequency table below Relative Frequency Filtered 1 Relative Frequency Tar mg Nonfiltered 3 7 1 8 12 13 17 18 22 23 27 28 32 33 37 Simplify your answers Do cigarette filters appear to be effective OA Yes because the relative frequency of the higher tar classes is greater for nonfiltered cigarettes OB No because the relative frequency of the higher tar classes is greater for filtered cigarettes OC No because the relative frequencies for each are not substantially different OD This cannot be determined Frequency Distributions Tar mg in Nonfiltered XLE Cigarettes Frequency 13 17 2 18 22 1 23 27 15 28 32 6 33 37 1 Tar mg in Filtered Cigarettes Frequency 3 7 1 8 12 3 13 17 6 18 22 15 D X

Statistics
StatisticsThe population of ages at inauguration of all U S Presidents who had professions in the military is 62 46 68 64 57 Why does it not make sense to const histogram for this data set Choose the correct answer below CHE OA There must be an even number of data values in the data set to create a histogram OB With a data set that is so small the true nature of the distribution cannot be seen with a histogram OC Adequate class boundaries for a histogram cannot be found with this data set OD This data set would yield a histogram that is not bell shaped

Statistics
StatisticsConstruct a scatterplot Choose the correct graph below OA 4 200 160 160 200 President s height VB Opponent s 200 160 de BETAL B 26 25 200 160 President s height 5 OC 200 160 160 President s height 200 Does there appear to be a correlation between the president s height and his opponent s height OA Yes there appears to be a correlation As the president s height increases his opponent s height decreases OB Yes there appears to be a correlation As the president s height increases his opponent s height increases OC Yes there appears to be a correlation The candidate with the highest height usually wins OD No there does not appear to be a correlation because there is no general pattern to the data 5 Opponent s height D 200 160 7 1 200 160 President s height Q
Statistics
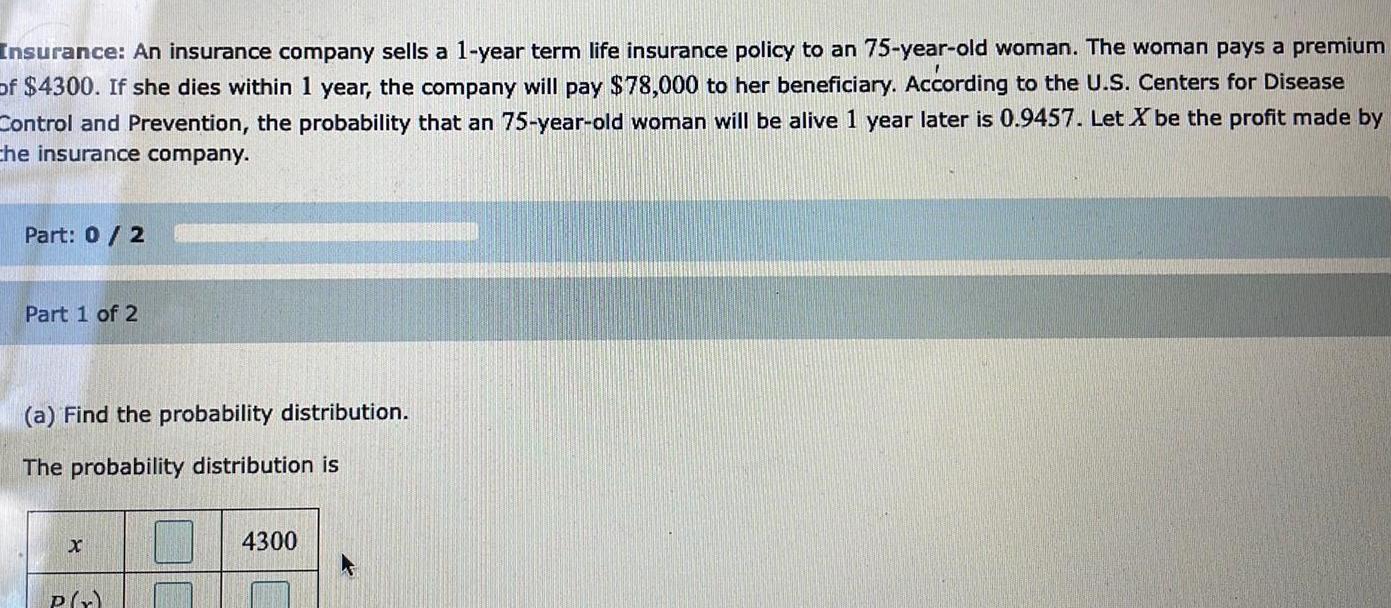
ProbabilityInsurance An insurance company sells a 1 year term life insurance policy to an 75 year old woman The woman pays a premium of 4300 If she dies within 1 year the company will pay 78 000 to her beneficiary According to the U S Centers for Disease Control and Prevention the probability that an 75 year old woman will be alive 1 year later is 0 9457 Let X be the profit made by the insurance company Part 0 2 Part 1 of 2 a Find the probability distribution The probability distribution is X P x 4300

Statistics
StatisticsClick the icon to view the data table for election heights Construct a scatterplot Choose the correct graph below OA Opponent s height 200 160 160 C 200 President s height Opponent s height B 200 160 160 Bo 7 200 President s height 7 ICCICH 196 176 174 172 185 182 177 Opponent s height 192 193 189 192 183 C 173 169 200 160 Data table for election heights 160 President s Opponent s President s Opponent s height cm height sm height cm height cm 200 President s height 16 175 181 171 193 192 171 182 Q 171 185 179 178 177 170 196 X O D Opponent s height 200 160 160 200 President s height

Statistics
ProbabilityPain A recent survey asked 825 people how many days they would wait to seek medical treatment if they were suffering pain that interfered with their ability to work The results are presented in the following table Number of Days 0 1 2 3 4 5 Total Send data to Excel Consider these 825 people to be a population Let X be the number of days for a person sampled at random from this population Part 0 5 Part 1 of 5 X Frequency 24 436 260 75 18 12 825 a Construct the probability distribution of X Round the answer to three decimal places 0 1 4 5 X 5 2 3 ola

Statistics
StatisticsThe data table to the right represents the volumes of a generic soda brand Complete parts a and b below a Which plot represents a dotplot of the data OA O C b Are there any outliers 50 50 1 60 70 80 90 Volumes of soda oz H 60 70 80 90 Volumes of soda oz Q Q Q OB 50 50 T Volumes of soda oz 65 70 70 65 50 60 70 80 90 Volumes of soda oz OA Yes the volume of 70 oz appears to be an outlier because many sodas had this as their volume OB Yes the volumes of 0 oz and 200 oz appear to be outliers because they are far away from the other temperatures OC Yes the volume of 50 oz appears to be an outlier because it is far away from the other volumes OD No there do not appear to be any outliers 1 60 70 80 90 Volumes of soda oz 4184558 75 80 75 75 Q 5 7C 80 70 70

Statistics
StatisticsThe graph to the right compares teaching salaries of women and men at private colleges and universities What impression does the graph create Does the graph depict the data fairly If not construct a graph that depicts the data fairly 80000 OA No because the data are two dimensional measurements OB Yes because the vertical scale is appropriate for the data OC No because the vertical scale does not start at zero OD Yes because the bars accurately represent each average 70000 60000 Salaries 5 50000 Women Men What impression does the graph create A The graph creates the impression that women have salaries that are slightly higher than that of men B The graph creates the impression that men have salaries that are more than twice the salaries of women C The graph creates the impression that men have salaries that are slightly higher than that of women OD The graph creates the impression that men and women have approximately the same salaries Does the graph depict the data fairly

Statistics
Statisticshigh school math team What is the class width What are the approximate lower and upper class limits of the first class Simplify your answer What are the approximate lower and upper class limits of the first class The approximate lower class limit is Hand in Frequency DON WAGO 0 E 105 115 125 135 145 155 165 175 Weight lbs

Statistics
StatisticsConstruct a frequency polygon using the data Choose the correct graph below A OB OC Frequency Frequency Frequency Frequency 30 30 30 In n h h F Scale F Scale F Scale F Scale 2 Does the graph suggest that the distribution is skewed If so how G OA The distribution does not appear to be skewed OB The distribution appears to be skewed to the left or negatively skewed OC The distribution appears to be skewed to the right or positively skewed The distribution appears to be skewed to both sides Q Q 2 C L

Statistics
StatisticsConstruct a scatter diagram using the data table to the right This data is from a study comparing the amount of tar and carbon monoxide CO in cigarettes Use tar for the horizontal scale and use carbon monoxide CO for the vertical scale Determine whether there appears to be a relationship between cigarette tar and CO Construct a scatter diagram OA ACO 20 16 12 8 4 0 Tar 0 4 8 12 16 20 OB ACO 20 16 12 8 4 Is there a relationship between cigarette tar and CO Tar 0 4 8 12 16 20 Q C ACO 20 16 12 8 43 0 4 OA Yes as the amount of tar increases the amount of carbon monoxide decreases OB No there appears to be no relationship OC Yes as the amount of tar increases the amount of carbon monoxide also increases Tar w 0 4 8 12 16 20 Q Tar 16 12 1 16 5 co 15 13 1 15 7 ACO 20 16 12 Tar 11 8 13 18 15 8 4 0 0 4 8 12 16 20 co 13 11 Tar 14 18 16 Full data se Tar 2 Q 11 6 17 11

Statistics
StatisticsThe weights in grams of 30 randomly selected apples from a large bin are shown below The mean weight is 112 grams and the standard deviation is 5 5 grams True or false The data appears to be normally distributed 103 116 104 108 115 114 123 111 112 101 112 120 106 98 110 119 109 111 109 114 110 112 110 107 110 105 106 102 111 108 True False

Statistics
StatisticsThe number of people who survived the Titanic based on class and gender is in the following table Suppose a person is picked at random from the survivors Class Female Male Total 133 58 191 95 24 119 79 57 136 307 139 446 1st 2nd 3rd Total a What is the probability that a survivor was female Round final answer to 3 decimal places 0 688 b What is the probability that a survivor was in the 2nd class Round final answer to 3 decimal places 0 267 c What is the probability that a survivor was a female given that the person was in 2nd class Round final answer to 3 decimal places

Statistics
ProbabilityTo help assess student learning in her developmental science courses a science professor at a university implemented pre and post tests for her developmental science students A knowledge gained score was obtained by taking the difference of the two test scores What type of experimental design is this Randomized block design Case control Completely randomized design Matched pair What is the response variable in this experiment O The score on the posttest O Difference in test scores O The score on the pretest O Total in test scores

Statistics
StatisticsA researcher has decided to test the effectivness of a drug meant to reduce high cholesterol through a completely randomized design She has obtained 9 volunteers with high cholesterol Amanda Brian Christine David Emily Fred George Heather and Ivan Number the volunteers 1 through 9 alphabetically Use the third row of digits in the randor number table below to randomly assign 3 of the volunteers to the experimental group ignore zeros The remaining volunteers will go into the control group List the individuals in each group Row 1 Row 2 Row 3 54105 06053 74943 What are the numbers of the three volunteers selected 03042 27367 78866 List the terms in the same order they appear in the original list 58811 11152 62684 41590 46533 23574

Statistics
Statistics1 38 In the game of roulette a player can place a 9 bet on the number 33 and have a probability of winning If the metal ball lands on 33 the player gets to keep the 9 paid to play the game and the player awarded an additional 315 Otherwise the player is awarded nothing and the casino takes the player s 9 What is the expected value of the game to the player If you played the game 1000 times how much would you expect to lose The expected value is Round to the nearest cent as needed The player would expect to lose about Round to the nearest cent as needed

Statistics
ProbabilityDetermine the required value of the missing probability to make the distribution a discrete probability distribution P 4 Type an integer or a decimal X 345 O 6 P x 0 35 0 37 0 07

Statistics
ProbabilityWhat is replication in an experiment Choose the correct answer below O A Replication is grouping together similar experimental units and then using random assignm B Replication is pairing up related experimental units O C Replication is applying each treatment to more than one experimental unit D Replication is randomly assigning each experimental unit to a treatment

Statistics
ProbabilityAccording to a poll about 19 of adults in a country bet on professional sports Data indicates that 48 4 of the adult population in this country is male Complete parts a through E a Are the events male and bet on professional sports mutually exclusive Explain OA Yes A person cannot be both male and bet on professional sports at the same time OB No A person cannot be male and bet on professional sports at the same time OC No A person can be both male and bet on professional sports at the same time D Yes A person can be both male and bet on professional sports at the same time b Assuming that betting is independent of gender compute the probability that an adult from this country selected at random is a male and bets on professional sports P male and bets on professional sports Type an integer or decimal rounded to four decimal places as needed c Using the result in part b compute the probability that an adult from this country selected at random is male or bets on professional sports P male or bets on professional sports Type an integer or decimal rounded to four decimal places as needed d The poll data indicated that 11 9 of adults in this country are males and bet on professional sports What does this indicate about the assumption in part b OA The assumption was correct and the events are independent OB The assumption was incorrect and the events are not independent e How will the information in part d affect the probability you computed in part c Select the correct choice below and fill in any answer boxes within your choice OA P males or bets on professional sports Type an integer or decimal rounded to four decimal places as needed B This information does not affect the probability computed in part c
Statistics
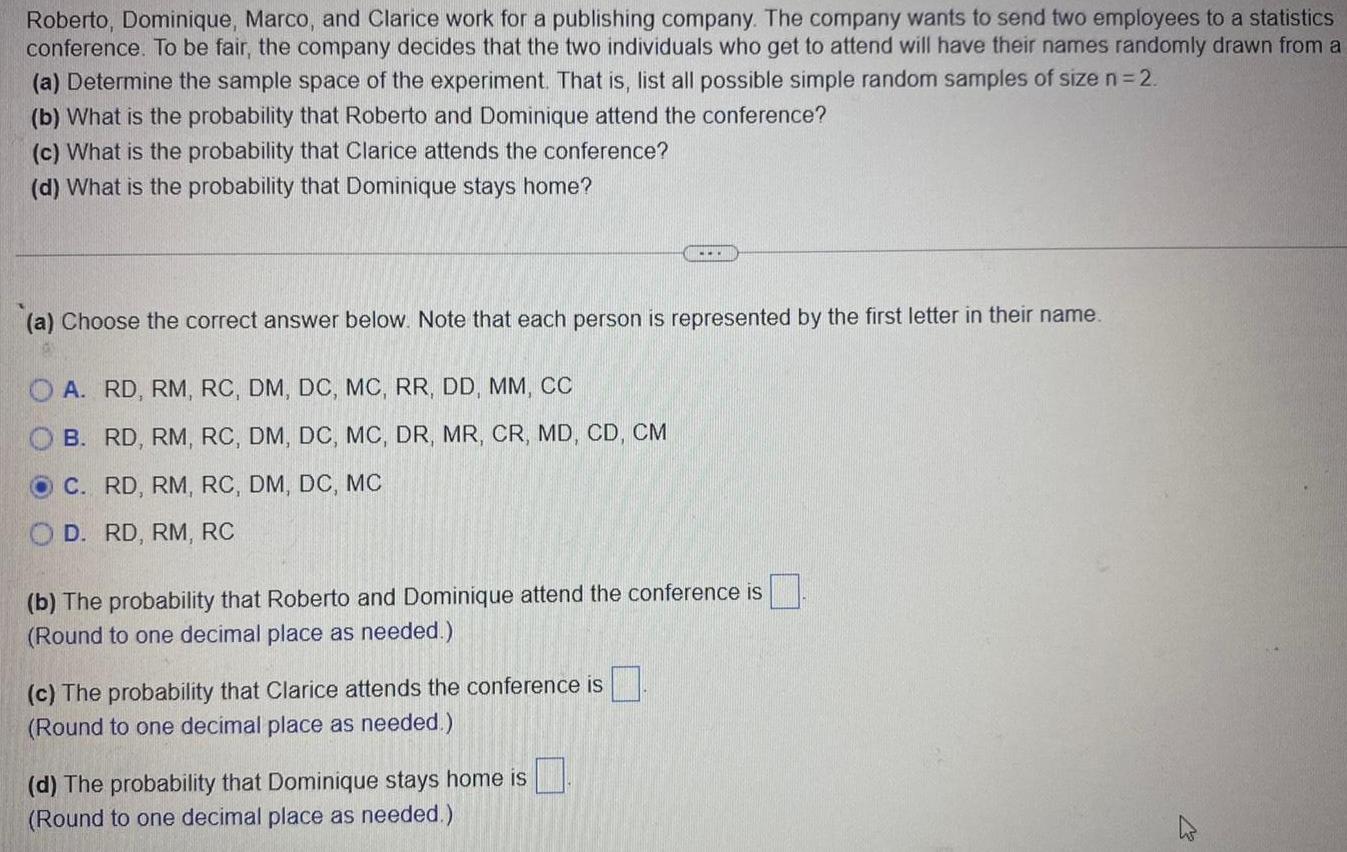
ProbabilityRoberto Dominique Marco and Clarice work for a publishing company The company wants to send two employees to a statistics conference To be fair the company decides that the two individuals who get to attend will have their names randomly drawn from a a Determine the sample space of the experiment That is list all possible simple random samples of size n 2 b What is the probability that Roberto and Dominique attend the conference c What is the probability that Clarice attends the conference d What is the probability that Dominique stays home a Choose the correct answer below Note that each person is represented by the first letter in their name A RD RM RC DM DC MC RR DD MM CC B RD RM RC DM DC MC DR MR CR MD CD CM C RD RM RC DM DC MC D RD RM RC b The probability that Roberto and Dominique attend the conference is Round to one decimal place as needed c The probability that Clarice attends the conference is Round to one decimal place as needed d The probability that Dominique stays home is Round to one decimal place as needed 2

Statistics
StatisticsDetermine whether the events and are independent of dependent Justly your answer a E A person attaining a position as a professor F The same person attaining a PhD A E and F are independent because attaining a PhD has no effect on the probability of a person attaining a position as a professor B E and F are independent because attaining a position as a professor has no effect on the probability of a person attaining a PhD OC E and F are dependent because attaining a position as a professor has no effect on the probability of a person attaining a PhD D E and F are dependent because attaining a PhD can affect the probability of a person attaining a position as a professor b E A randomly selected person at school A having a high GPA F A randomly selected person at school B having a low GPA A E can affect the probability of F even if the two people are randomly selected so the events are dependent B E can affect the probability of F because the people were randomly selected so the events are dependent OC E cannot affect F and vice versa because the people were randomly selected so the events are independent D E cannot affect F because person 1 at school A having a high GPA could never occur so the events are neither dependent nor independent c E The consumer demand for synthetic diamonds F The amount of research funding for diamond synthesis A The consumer demand for synthetic diamonds could affect the amount of research funding for diamond synthesis so E and F are dependent OB The amount of research funding for diamond synthesis could affect the consumer demand for synthetic diamonds so E and F are dependent C The consumer demand for synthetic diamonds could not affect the amount of research funding for diamond synthesis so E and F are independen

Statistics
ProbabilityAccording to a survey the probability that a randomly selected worker primarily drives a van to work is 0 861 The probability that a randomly selected worker primarily takes public transportation to work 0 047 Complete parts a through d OECOR a What is the probability that a randomly selected worker primarily drives a van or takes public transportation to work P worker drives a van or takes public transportation to work Type an integer or decimal rounded to three decimal places as needed b What is the probability that a randomly selected worker primarily neither drives a van nor takes public transportation to work P worker neither drives a van nor takes public transportation to work Type an integer or decimal rounded to three decimal places as needed c What is the probability that a randomly selected worker primarily does not drive a van to work P worker does not drive a van to work Type an integer or decimal rounded to three decimal places as needed d Can the probability that a randomly selected worker primarily walks to work equal 0 15 Why or why not A No The probability a worker primarily drives walks or takes public transportation would be less than 1 OB Yes The probability a worker primarily drives walks or takes public transportation would equal 1 OC No The probability a worker primarily drives walks or takes public transportation would be greater than 1 D Yes If a worker did not primarily drive or take public transportation the only other method to arrive at work would be to walk

Statistics
StatisticsThe survey has bias a Determine the type of bias b Suggest a remedy A polling organization conducts a study to estimate the percentage of households that have more than one computer It mails a questionnaire to 1877 randomly selected households across the country and asks the head of each household i he or she has more than one computer Of the 1877 households selected 10 responded a Which of these best describes the bias in the survey O Undercoverage bias O Nonresponse bias O Sampling bias Response bias

Statistics
StatisticsA poll is being conducted on a college campus to obtain a sample of the population of an entire country What is the frame for this type of sampling Who would be excluded from the survey and how might this affect the results of the survey What is the frame for this type of sampling OA The frame is people who take college classes part time OB The frame is people who go to that campus OC The frame is people who like college sports OD The frame is the entire population of the country

Statistics
StatisticsThe following survey has bias a Determine the type of bias b Suggest a remedy Suppose you are conducting a survey regarding illicit drug use among teenagers in some school district You obtain a cluster sample of 12 schools within the district and sample all sophomore students in the randomly selected schools The survey is administered by the teachers a What is the type of bias Nonresponse bias O Sampling bias Response bias

Statistics
StatisticsWhat are the advantages of having a presurvey with open questions to assist in constructing a questionnaire that has closed questions Click the icon for an example of open and closed questions Choose the correct answer below OA The researcher can possibly eliminate the need for closed questions OB The researcher can get an idea of how large the sample needs to be O C The researcher can possibly create the option to use open questions D The researcher can learn common answers

Statistics
StatisticsWhat are some solutions to nonresponse Select all that apply A attempt callbacks C offer rewards and incentives E change wording of questions G reduce undercoverage www B use cluster sampling D use convenience sampling use stratified sampling H reduce interview error

Statistics
StatisticsSuppose you are reading an article online when the following text appeared in a popup window Would you be interested in participating in a short health related survey If you qualify and complete this survey you will receive 1 00 Your participation will make a difference What tactic is being used to increase the response rate for this survey Choose the correct answer below OA The company is using an online survey OB The company is selecting people randomly OC The company is using a reward in the form of the 1 00 payment and an incentive by telling the readers that his or her input will make a difference OD The company is using callbacks

Statistics
StatisticsSuppose a surveyor wants to conduct a phone survey about a new song He plans to take a simple random sample However some people do not want to participate Do you believe this can affect the ability of the surveyor to obtain accurate polling results If so how Choose the correct answer below OA Yes because it allows the surveyor to better target his intended demographic OB Yes because it keeps the people who are less informed from introducing bias to the survey OC Yes especially if the people who do not want to participate have a trait that is not accurately represented by the remaining people in the sample OD No this does not affect the surveyor s ability to obtain accurate polling results

Statistics
Statisticscompletely accurate Choose the correct answer below OA It is rare for frames to be accurate because individuals that were selected to be in the sample do not always respond to the survey which can create nonresponse bias OB It is rare for frames to be accurate because frames are obtained periodically whereas populations are constantly changing OC It is rare for frames to be accurate because frames are obtained in a way that causes the sample to favor om part of the population over another OD It is rare for frames to be accurate because large sample sizes used in frames almost always result in data entry errors

Statistics
ProbabilityConsider the two questions shown below a Who is your favorite actor b How interested are you in playing on a hockey team Will the order in which the questions are asked affect the survey results If so what can the pollster do to alleviate this response bias Choose the correct answer below OA Yes question order will affect the survey results The pollster cannot do anything to alleviate this response bias OB Yes question order will affect the survey results The pollster should alternate the order of the questions given in the questionnaire so that different respondents receive questionnaires with the same questions but different question orderings OC No there is no obvious reason that question order would affect the survey results in this scenario D Yes question order will affect the survey results The pollster should try to make the questions more impartial

Statistics
StatisticsSurveys tend to suffer from low response rates Based on past experience a researcher determines that the typical response rate for an e mail survey is 40 She wishes to obtain a sample of 500 respondents so she e mails the survey to 2500 randomly selected e mail addresses Assuming the response rate for her survey is 40 will the respondents form an unbiased sample Explain Is the sample unbiased OA Yes The sample was a randomly selected group of e mail addresses which does not introduce bias OB Yes The number of respondents will be approximately 1000 that is two times greater than the needed size of the sample O C No The survey was not given to the entire population O D No The survey still suffers from undercoverage sampling bias nonresponse bias and potentially response bias